
4 Types of
Heatmaps
See exactly where users click, move their mouse, focus attention, and scroll. Separate desktop & mobile views with advanced filtering by country, browser, and date range.

100% Self-Hosted
GDPR Compliant
Real-Time Updates
Unlimited Tracking
Visualize Every User Interaction
Four heatmap types give you a complete picture of how visitors interact with every page. Click, move, attention and scroll data — all rendered as beautiful overlays on your actual pages.
Click Heatmaps FREE
See exactly where users click on every page. Identify which buttons, links and elements attract the most attention. Spot dead clicks on non-interactive elements and optimize your CTAs.
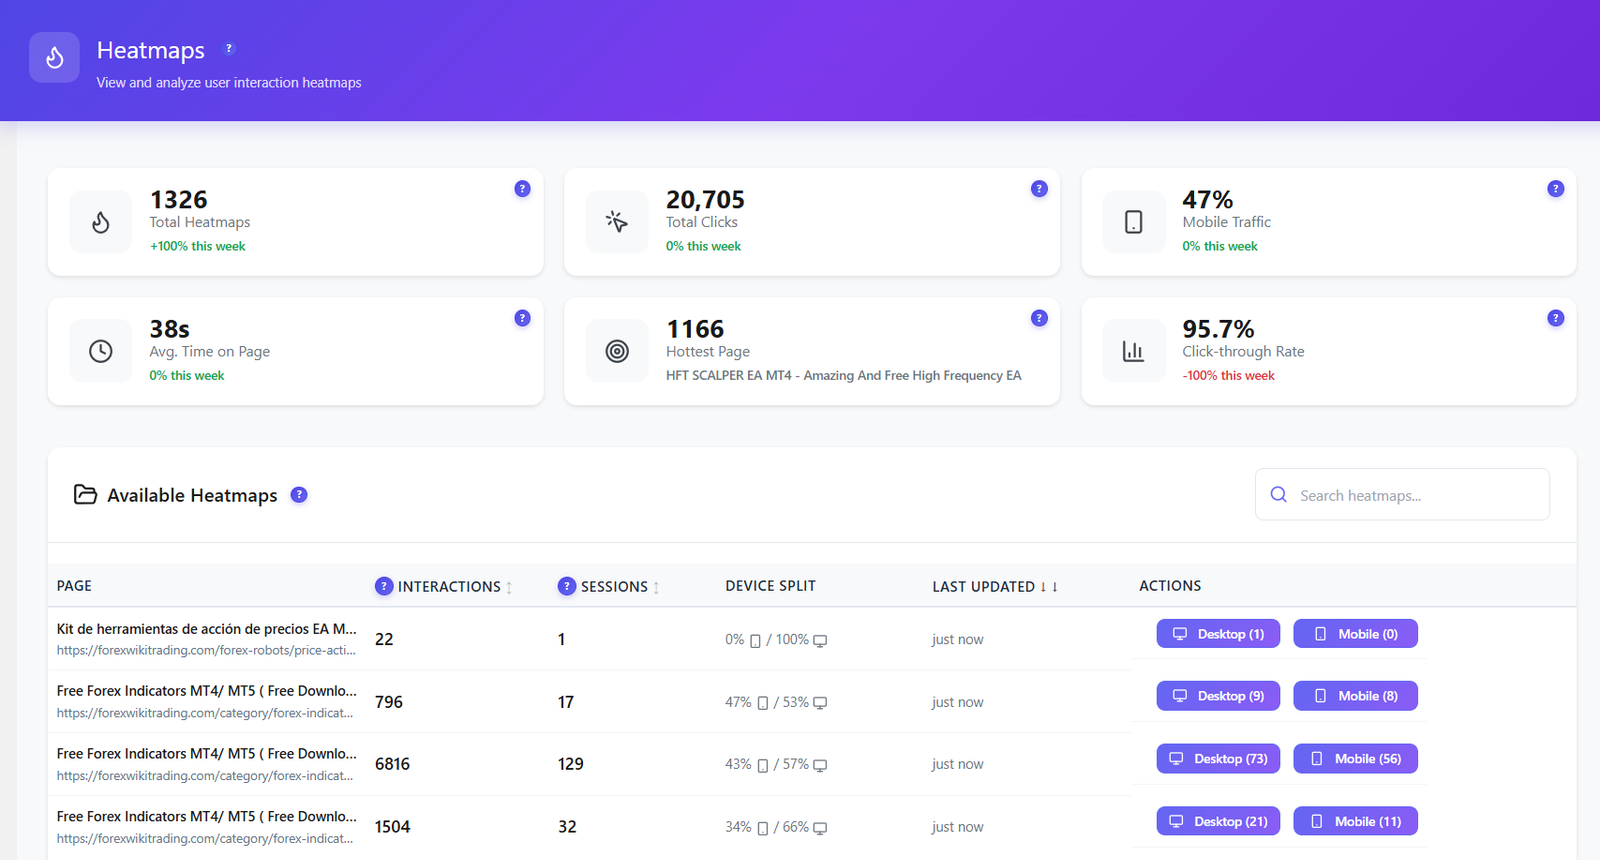
Heatmap Management
Browse and manage all your heatmaps from a central list. See session counts, filter by date range, country and browser. Switch between desktop and mobile views.

Move Heatmaps PRO
Track mouse movement patterns to understand where users hover and explore. Mouse movement correlates with eye tracking — revealing which content areas draw the most visual attention.

Attention Heatmaps PRO
Discover which sections of your page hold user attention longest. Attention maps combine dwell time, mouse position and viewport visibility to show content effectiveness at a glance.
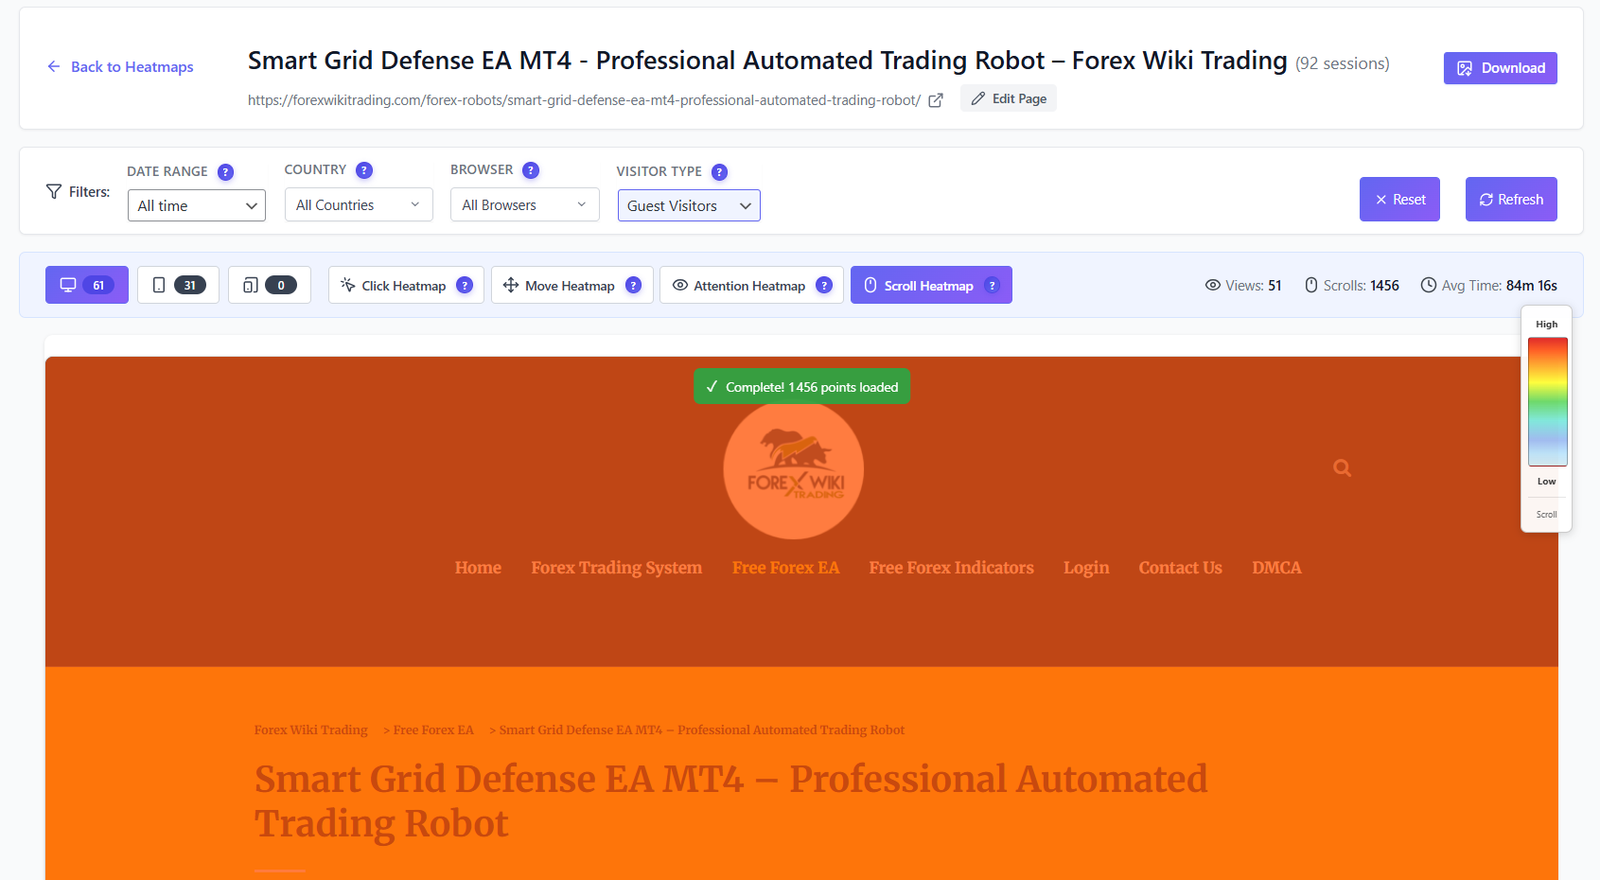
Scroll Heatmaps PRO
See exactly how far users scroll on every page. Identify the fold line where you lose visitors and optimize content placement. Color-coded bands show the percentage reaching each section.
Post & Page Analytics
Access heatmap data directly from the WordPress editor. The built-in widget shows click counts, scroll depth and engagement metrics for each post or page.
📊
FREE
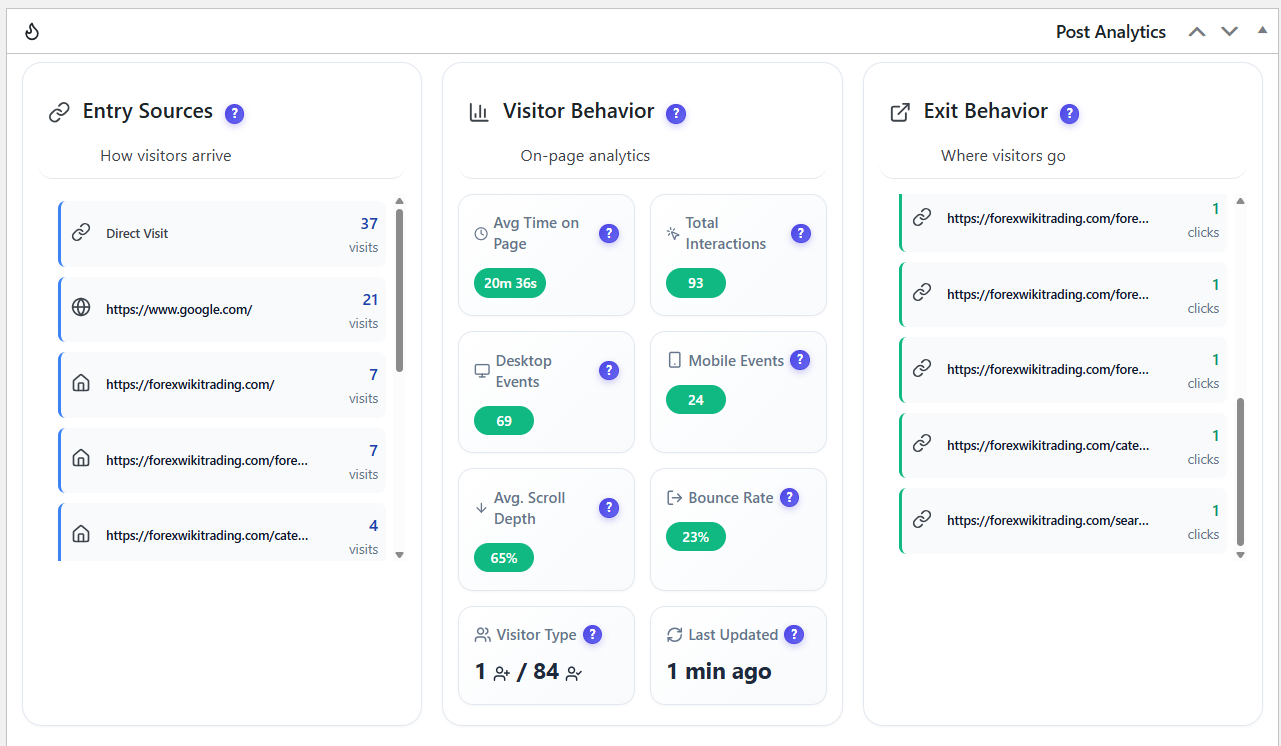
Per-Page Post Analytics
Every post and page in WordPress gets its own analytics widget. See heatmap session counts, top clicked elements, scroll depth percentages and visitor engagement metrics — all without leaving the editor.
- Heatmap session count per page
- Top clicked elements with click counts
- Average scroll depth percentage
- Desktop vs mobile breakdown
- Quick-launch heatmap overlay from editor
- Download heatmap as image
How It Works
1
Install & Activate
Install Opti-Behavior from WordPress.org. Activate it and heatmap tracking starts automatically — no configuration needed.
2
Visitors Browse Your Pages
As visitors interact with your site, the lightweight script captures clicks, mouse movements, scroll depth and attention data on your own server.
3
View Heatmap Overlay
Open any page heatmap to see a color-coded overlay rendered on your actual page. Switch between click, move, attention and scroll views with one click.
4
Analyze & Optimize
Use heatmap insights to reposition CTAs, remove distracting elements, shorten pages and improve conversion rates. Download heatmap images to share.
Who Uses Heatmaps?
E-Commerce Product Pages
See which product images, descriptions and add-to-cart buttons get the most clicks. Identify if users are scrolling past key information and optimize layouts for higher conversions.
Landing Page Optimization
Discover if visitors click your primary CTA or get distracted by secondary elements. Use scroll heatmaps to find the optimal fold position and validate content hierarchy.
Content Layout Testing
Test different page layouts and compare heatmap data to see which arrangement drives more engagement. Restructure content based on real user behavior data.
Heatmap Comparison
| Feature | Opti-Behavior | Hotjar | MS Clarity | Mouseflow |
|---|---|---|---|---|
| Click Heatmaps | ✓ Free | ✓ | ✓ | ✓ |
| Move Heatmaps | ✓ Pro | ✓ | ✗ | ✓ |
| Attention Heatmaps | ✓ Pro | ✗ | ✗ | ✓ |
| Scroll Heatmaps | ✓ Pro | ✓ | ✓ | ✓ |
| Desktop / Mobile Split | ✓ Free | ✓ | ✓ | ✓ |
| Country & Browser Filters | ✓ Free | ✓ Paid | ✗ | ✓ Paid |
| Heatmap Image Download | ✓ Free | ✓ | ✗ | ✓ |
| Self-Hosted Data | ✓ Free | ✗ | ✗ | ✗ |
| Session Limits | Unlimited | 35/day | Unlimited | 500/mo |
| Price | $0 – $46/yr | $213+/mo | $0* | $31+/mo |
* Microsoft Clarity is free but Microsoft uses your visitors’ data for advertising.
Heatmaps FAQ
What types of heatmaps are available?
Opti-Behavior offers 4 types of heatmaps: Click Heatmaps (free) show where users click, Move Heatmaps (Pro) track mouse movement patterns, Attention Heatmaps (Pro) reveal where users focus their gaze, and Scroll Heatmaps (Pro) show how far users scroll on each page.
Do heatmaps work on mobile devices?
Yes. Heatmaps automatically separate desktop and mobile data, giving you distinct views for each device type. Mobile heatmaps capture taps and scrolls, while desktop heatmaps track clicks and mouse movements. You can toggle between views with one click.
How many pages can I track with heatmaps?
There is no limit. You can enable heatmap tracking on every page of your site. The free version includes click heatmaps for unlimited pages. Pro adds scroll, move, and attention heatmaps — also with no page limits.
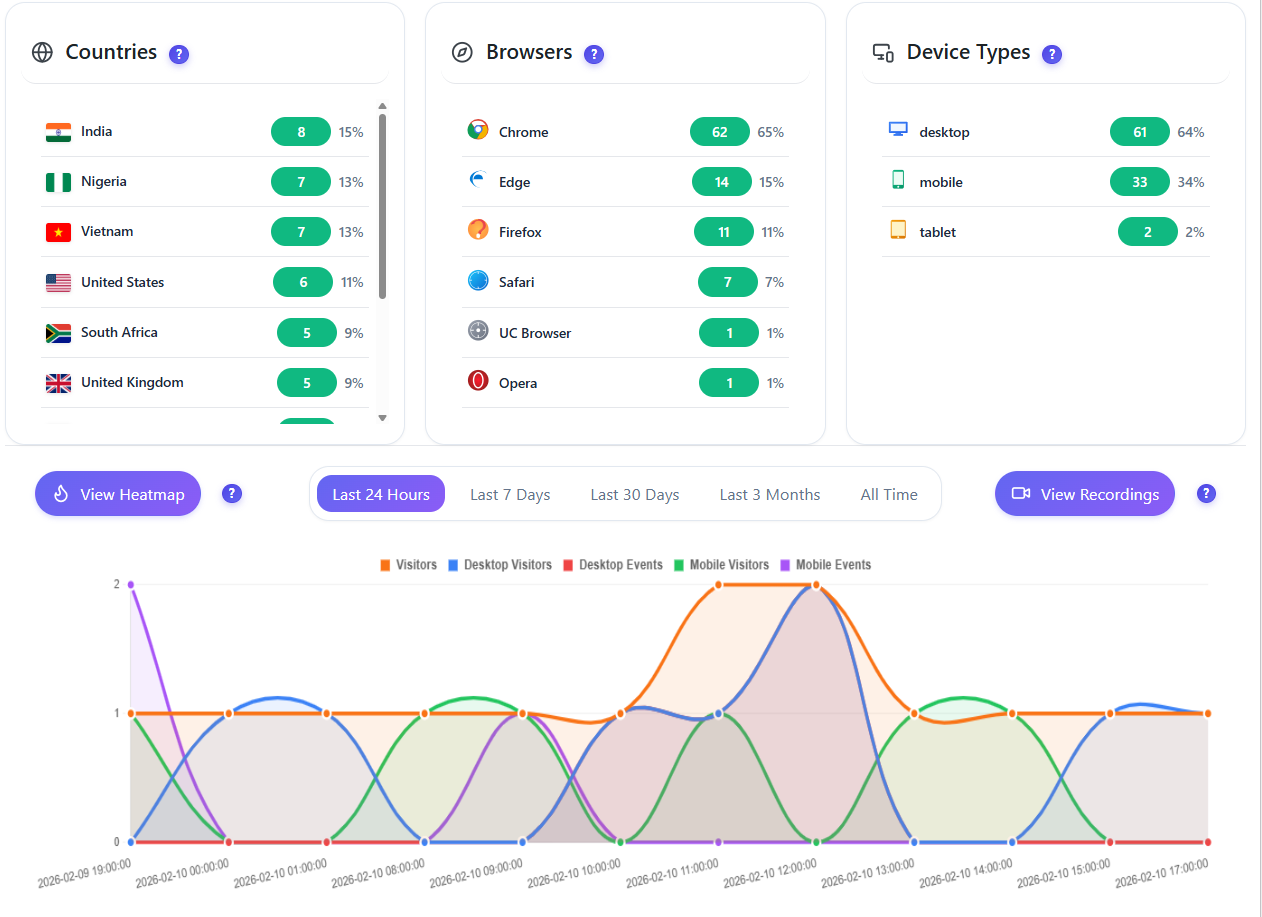
Can I filter heatmap data by date, country, or browser?
Yes. The Pro version includes advanced heatmap filters that let you narrow data by date range, visitor country, browser, device type, and whether the visitor is new or returning. This helps you understand behavior differences across audience segments.
Can I download or share heatmap images?
Yes. You can download heatmap images as PNG files directly from the heatmap viewer. This makes it easy to include heatmap data in client reports, presentations, or team discussions without needing to share WordPress admin access.
See Where Your Users Click
Install Opti-Behavior for free and start generating heatmaps within minutes. No signup, no API keys, no monthly fees.