Heatmaps, recordings, funnels, forms and errors — recorded on your own WordPress server. Smart Insights ranks what to fix; A/B testing proves it works.
You don’t have a traffic problem. You have a blind spot.
Most sites don’t need more visitors. They need to know why the ones they already pay for leave.
0visitors you paid for
↓ the leak: between interest and action
0engage · add to cart, start a form
0convert
Where, not why
is all your analytics tells you — and never what to fix first
Google Analytics and WooCommerce show the drop at step 2. Not the button below the fold, the rage clicks on a dead element, or which of twenty issues is costing you the most.
0 tests
from tools that only observe — on a site that changes weekly
External heatmaps ship your visitors’ data to someone else’s servers, go blind on visitors who reject cookies, and stop at the diagnosis. Meanwhile yesterday’s plugin update broke a button on mobile, and nobody noticed.
Opti-Behavior closes the loop inside WordPress — capture, insight, fix, proof. See how it works ↑
Built for speed · measured, not promised
Fast for your visitors. Light on your server.
Every analytics plugin says it’s lightweight. Here is what ours actually costs, measured on a live WordPress site with every module on.
0 blockingpassive listeners, batched & gzipped in the browser, sent with sendBeacon
Cache-safecompatibility layer for WP Rocket, LiteSpeed, SG Optimizer and the other optimizers
90 days on a production site1 June – 29 August 2026 · every module enabled, default retention
sessions
page views
MBdatabase growth per day
KBdatabase per page view
≈ KBper session, full replay included
MySQL · small indexed rows
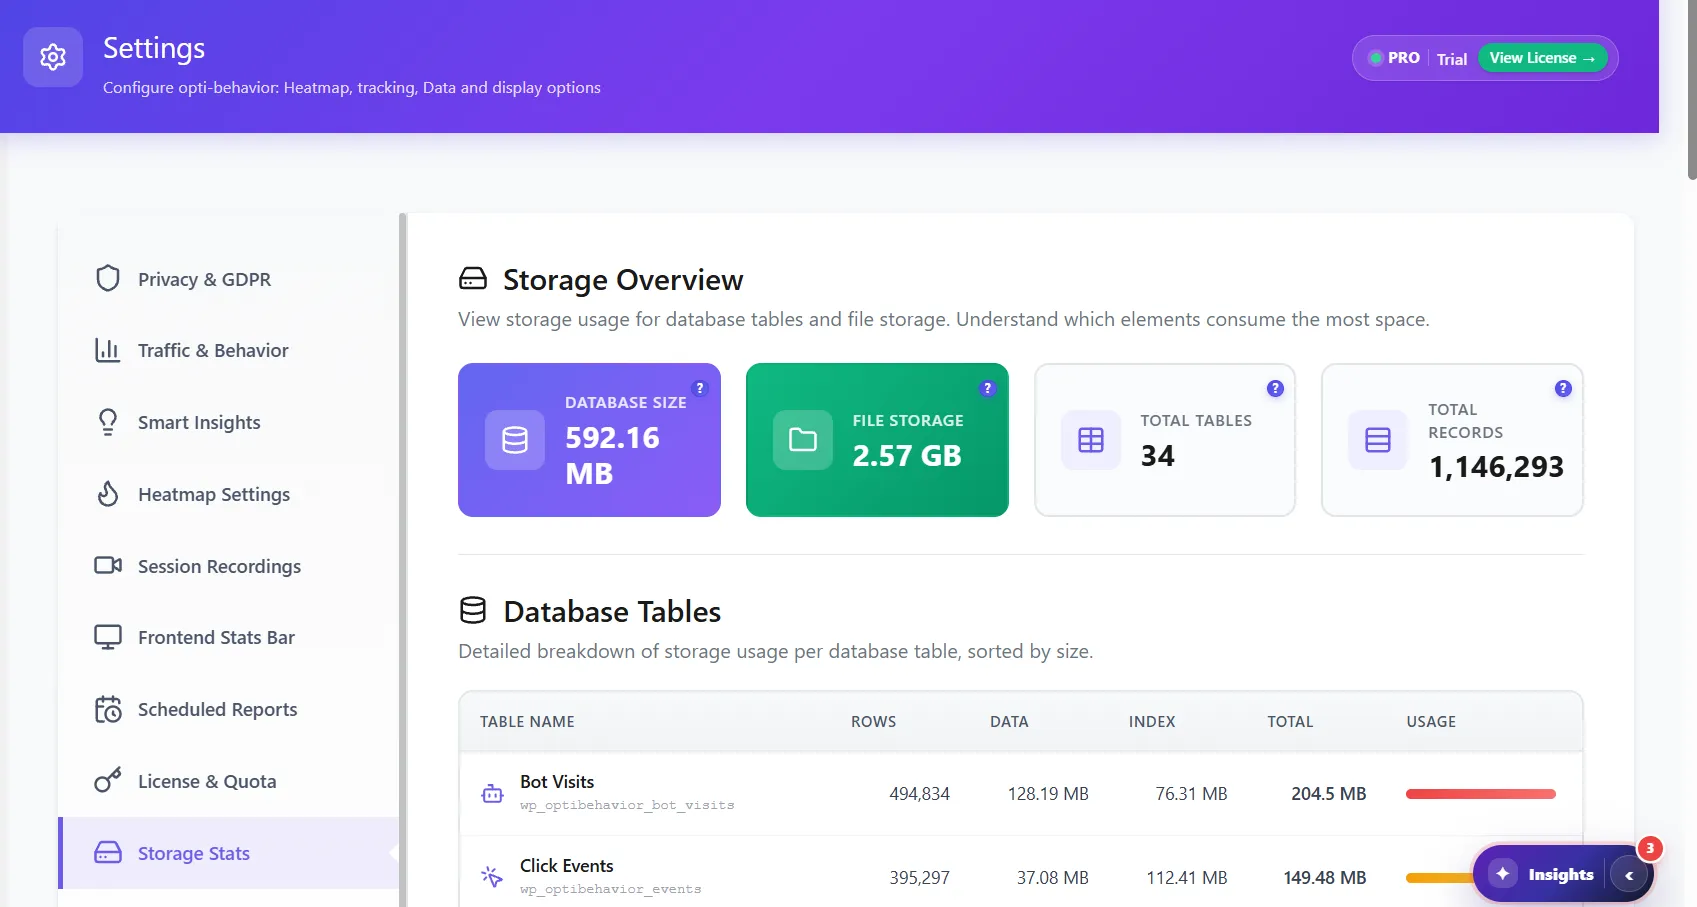
565 MB
Files on disk · gzip JSON
1.52 GB
Heavy payloads — recordings, raw heatmap events — never enter MySQL. Your posts, options and buffer pool stay untouched. Per session: ≈3.7 KB in the database, ≈10.3 KB in files.
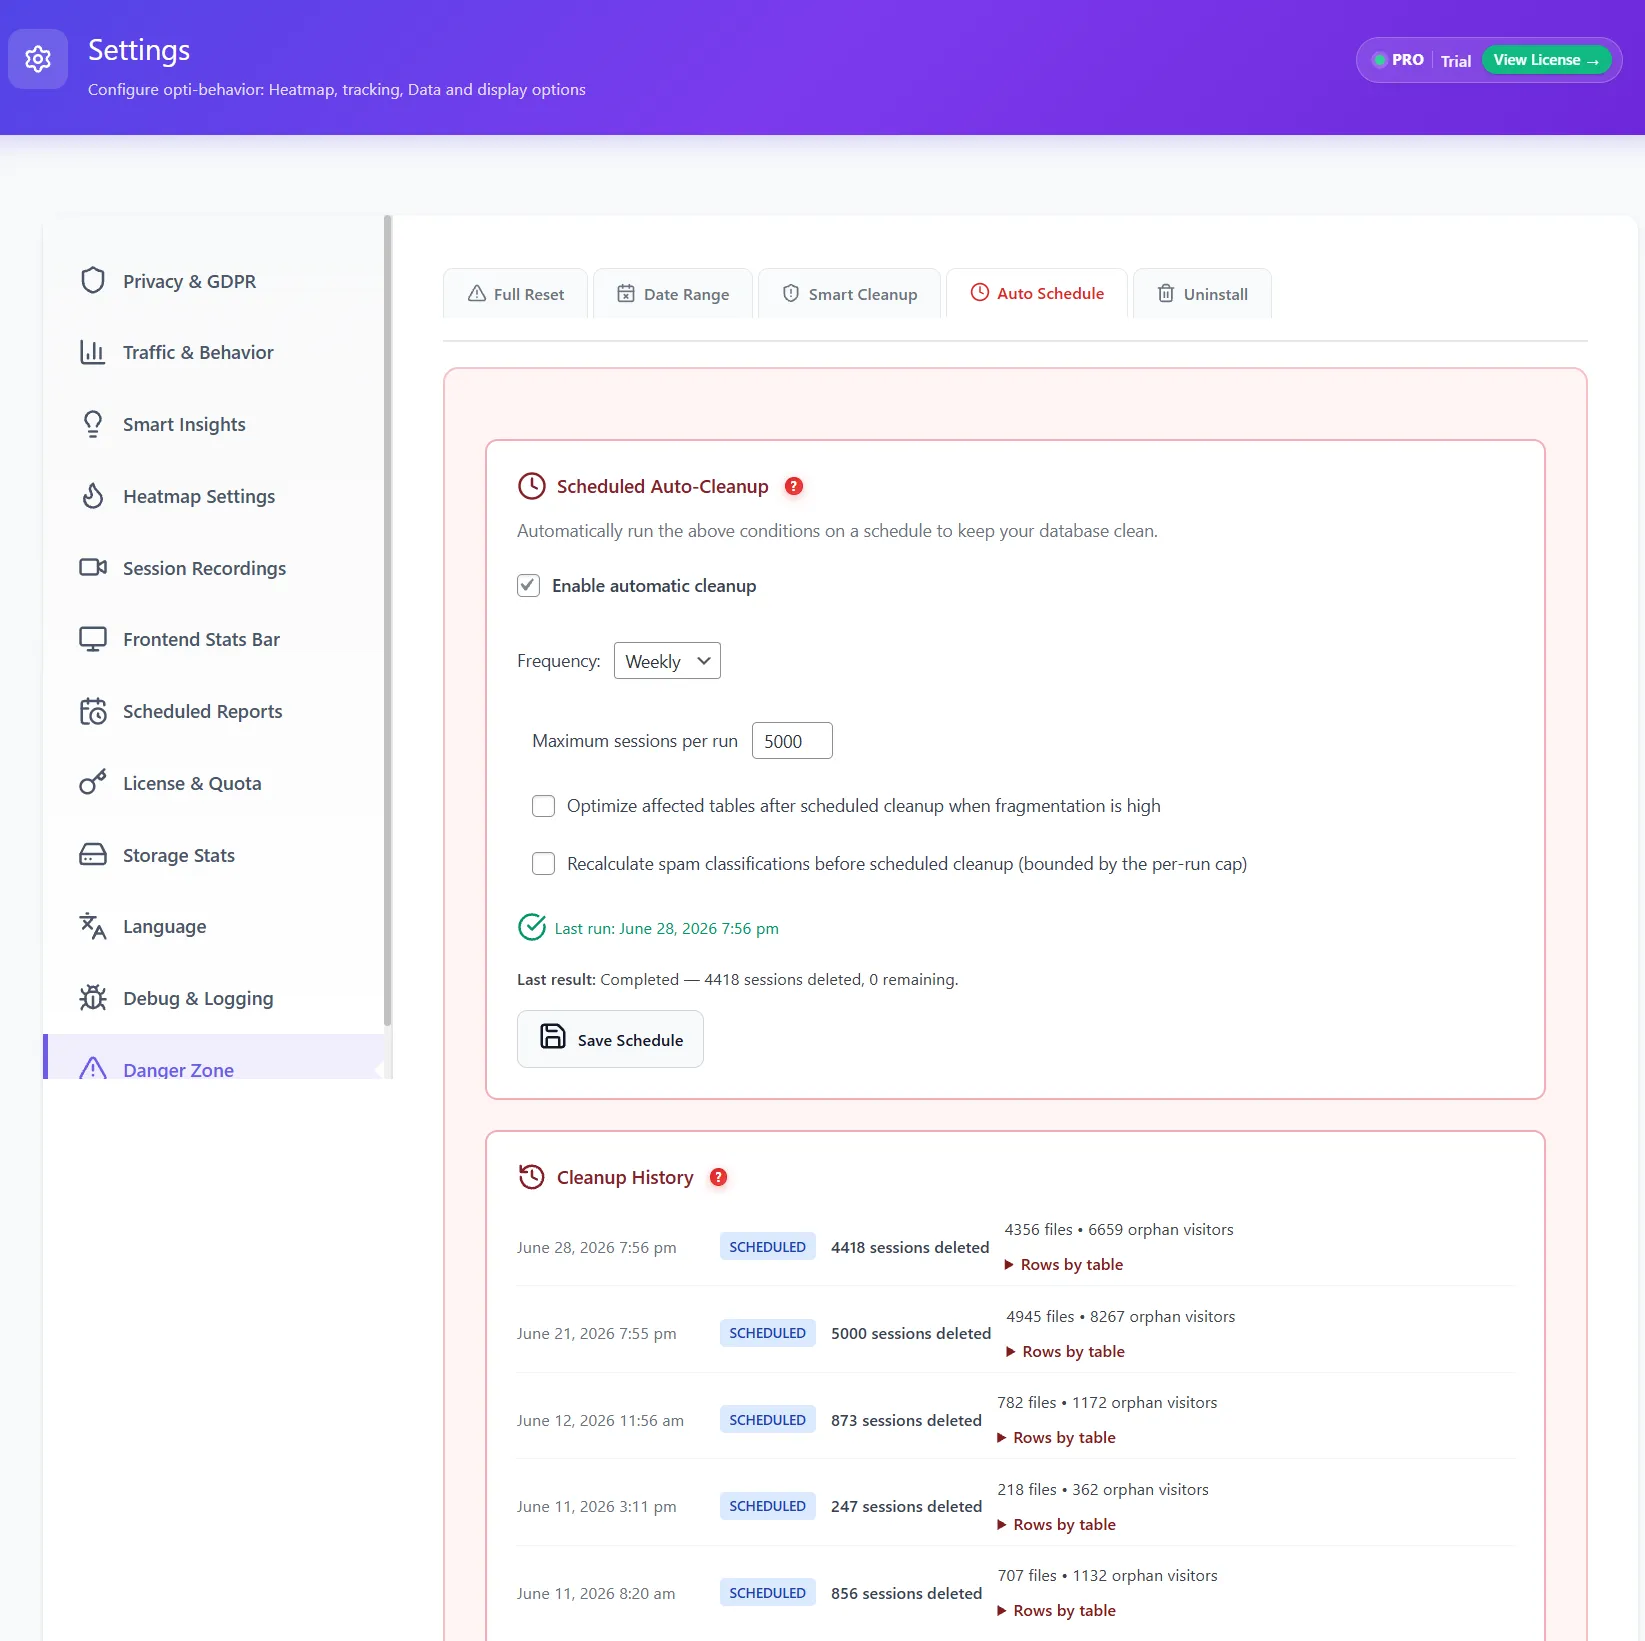
Your footprint has a ceiling.Automatic, tiered cleanup runs every day. Raw data has a horizon; the numbers you chart have no expiry by default.
Every daySpam & bot sessions purged — with their recordings and files, in one cascade
90 daysRecordings and raw heatmap files expire
365 daysDetailed session rows expire
No expiryDaily aggregates stay — every chart, every total, for kilobytes
At the measured traffic (≈1,700 sessions/day), defaults plateau at about≈2.3 GB database · ≈1.5 GB files— then it stops growing. All windows are configurable.
Safety valve: any automated cleanup that would delete more than 50% of your sessions aborts and logs a warning instead. A bad rule can never erase your data overnight.
Visitor eventsclicks, scroll, forms, errors
↓
Batched in the browsergzip · sendBeacon
↓ split ↓
MySQLsmall indexed rows · ~1.45 KB / view
Gzip files on diskrecordings · raw heatmap events
↓
Your dashboarddaily aggregates, no expiry by default
Everything in one plugin
Nine analytics modules. One dashboard. Your server.
Seven tools collect the signals, Smart Insights decides what to fix, A/B testing proves it. Click a tool to follow the story.
1Collect the signals
everything above feeds↓
2Smart Insights decides
→
3A/B test proves it
→
4You stay in control
The moment
ClickMoveAttentionScroll
yoursite.com/product
Product photo
Add to cart
100%
58%
22%
0clicks on the photo
0on “Add to cart”
Visitors keep clicking the product photo. It isn’t a link. The real button sits below the fold.The mouse hovers over the price and the shipping line for seconds — hesitation you can see.Attention piles up on the description, not on the offer. They read; they don’t decide.Only 22% ever reach the button. The page is long; the decision point is at the bottom.
→
With Heatmaps · 4 types
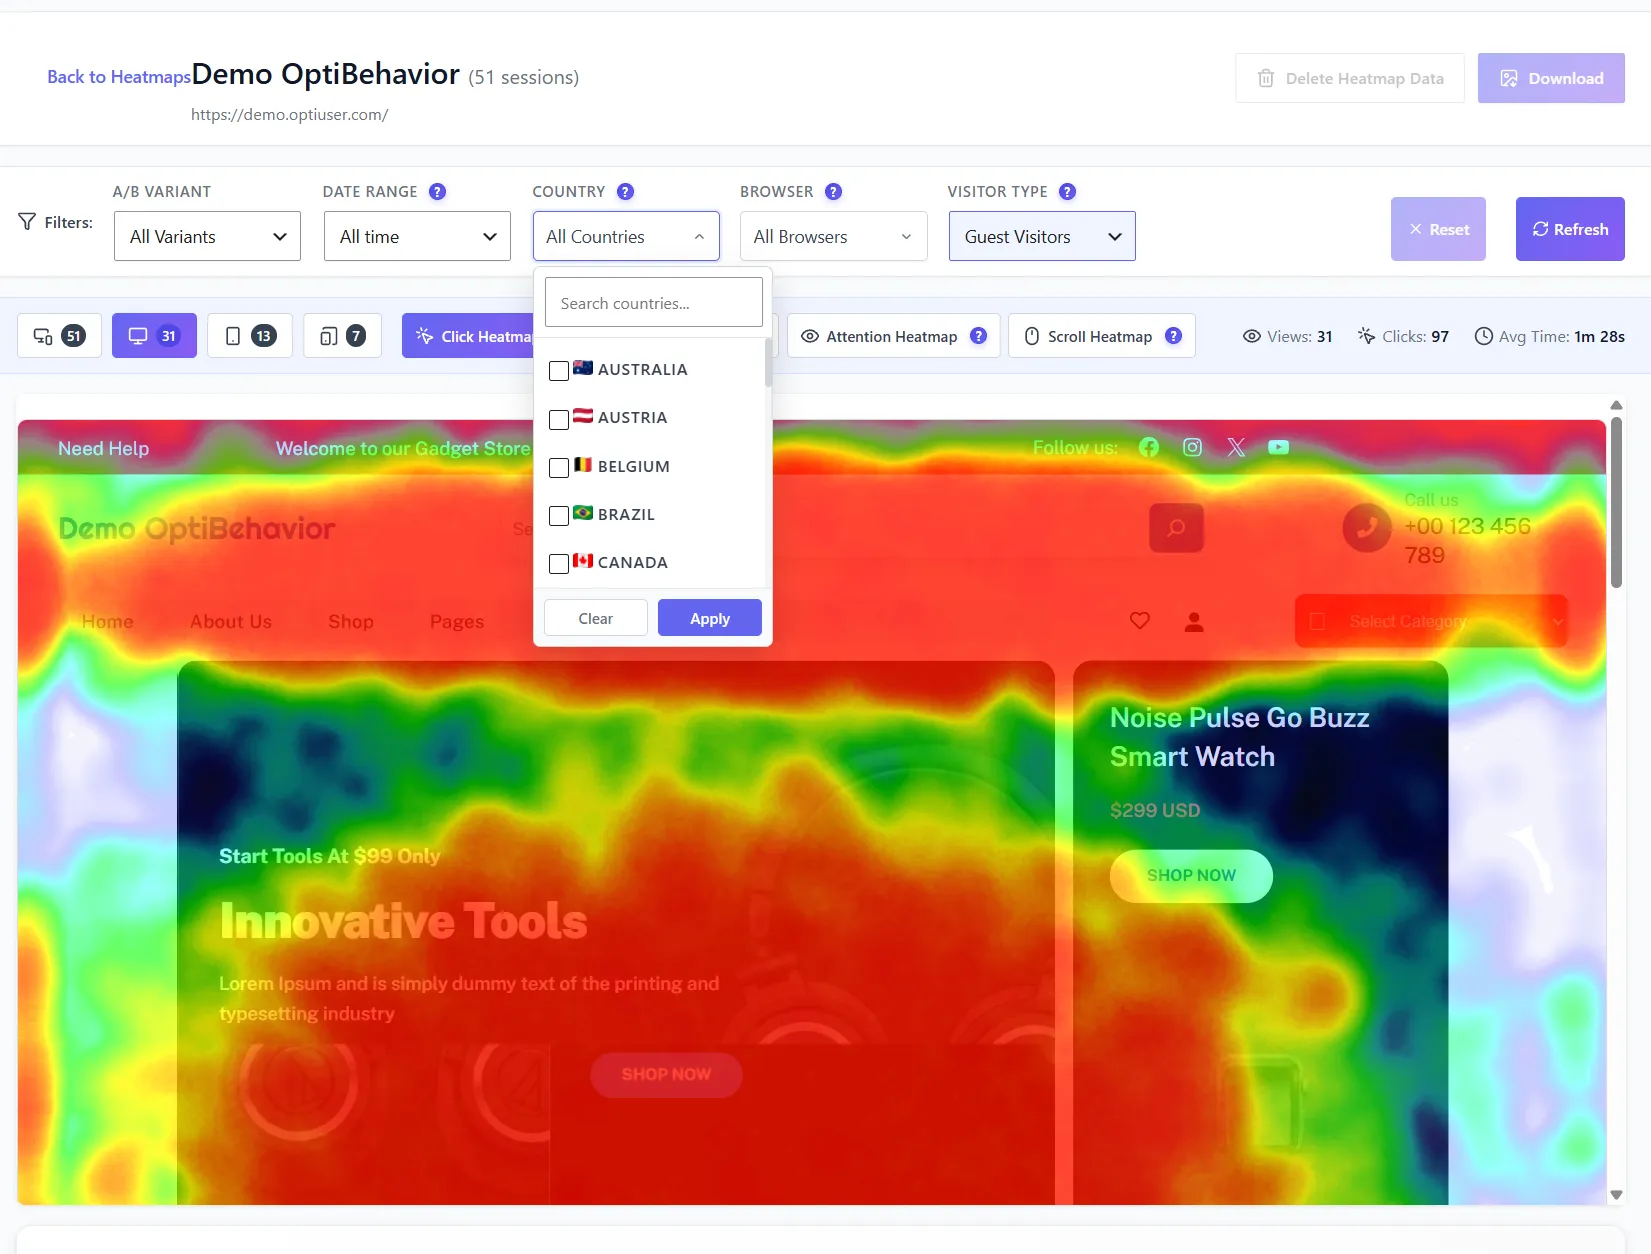
Click heatmap FreeWhere people click — and where they click on things that aren’t links. Make the photo the link.
Move heatmap ProMouse paths reveal hesitation before the click. Put the answer where the cursor hovers.
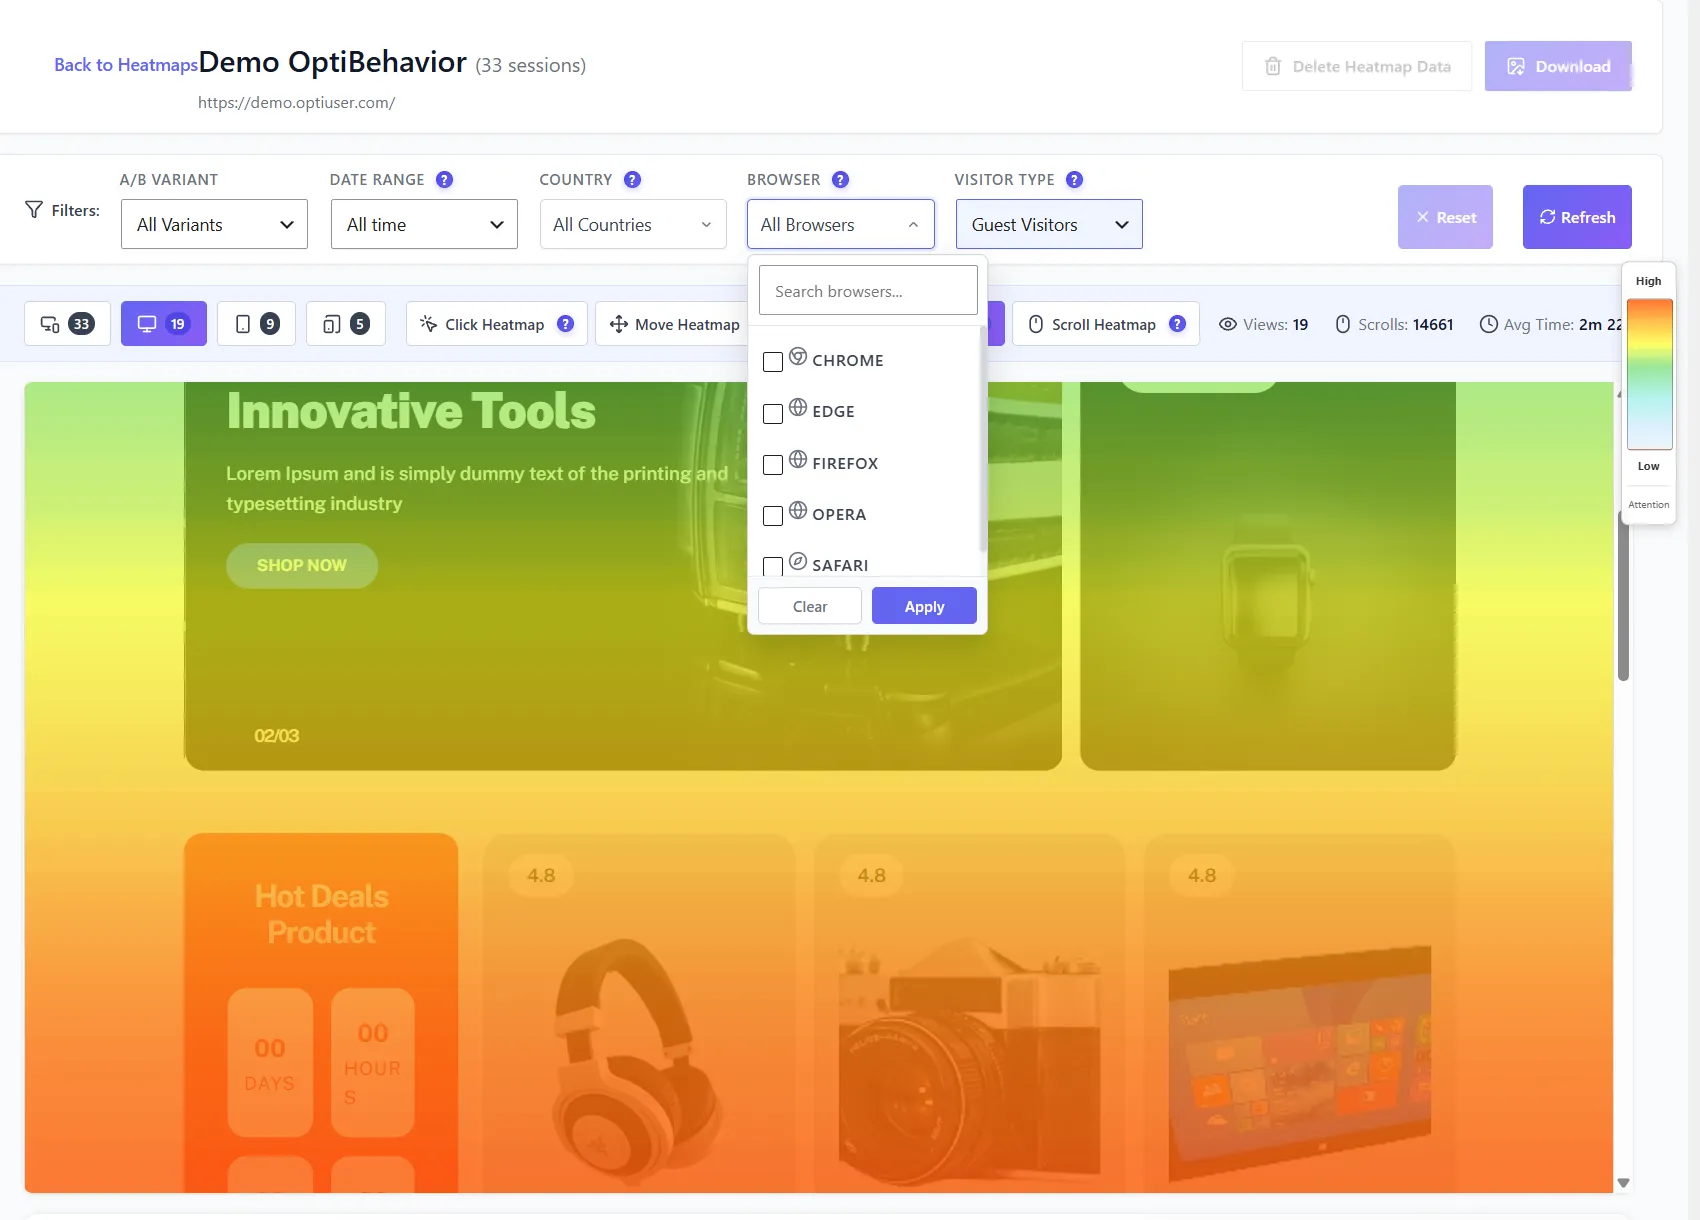
Attention heatmap ProTime spent per zone. Shorten what they read; strengthen what they skip.
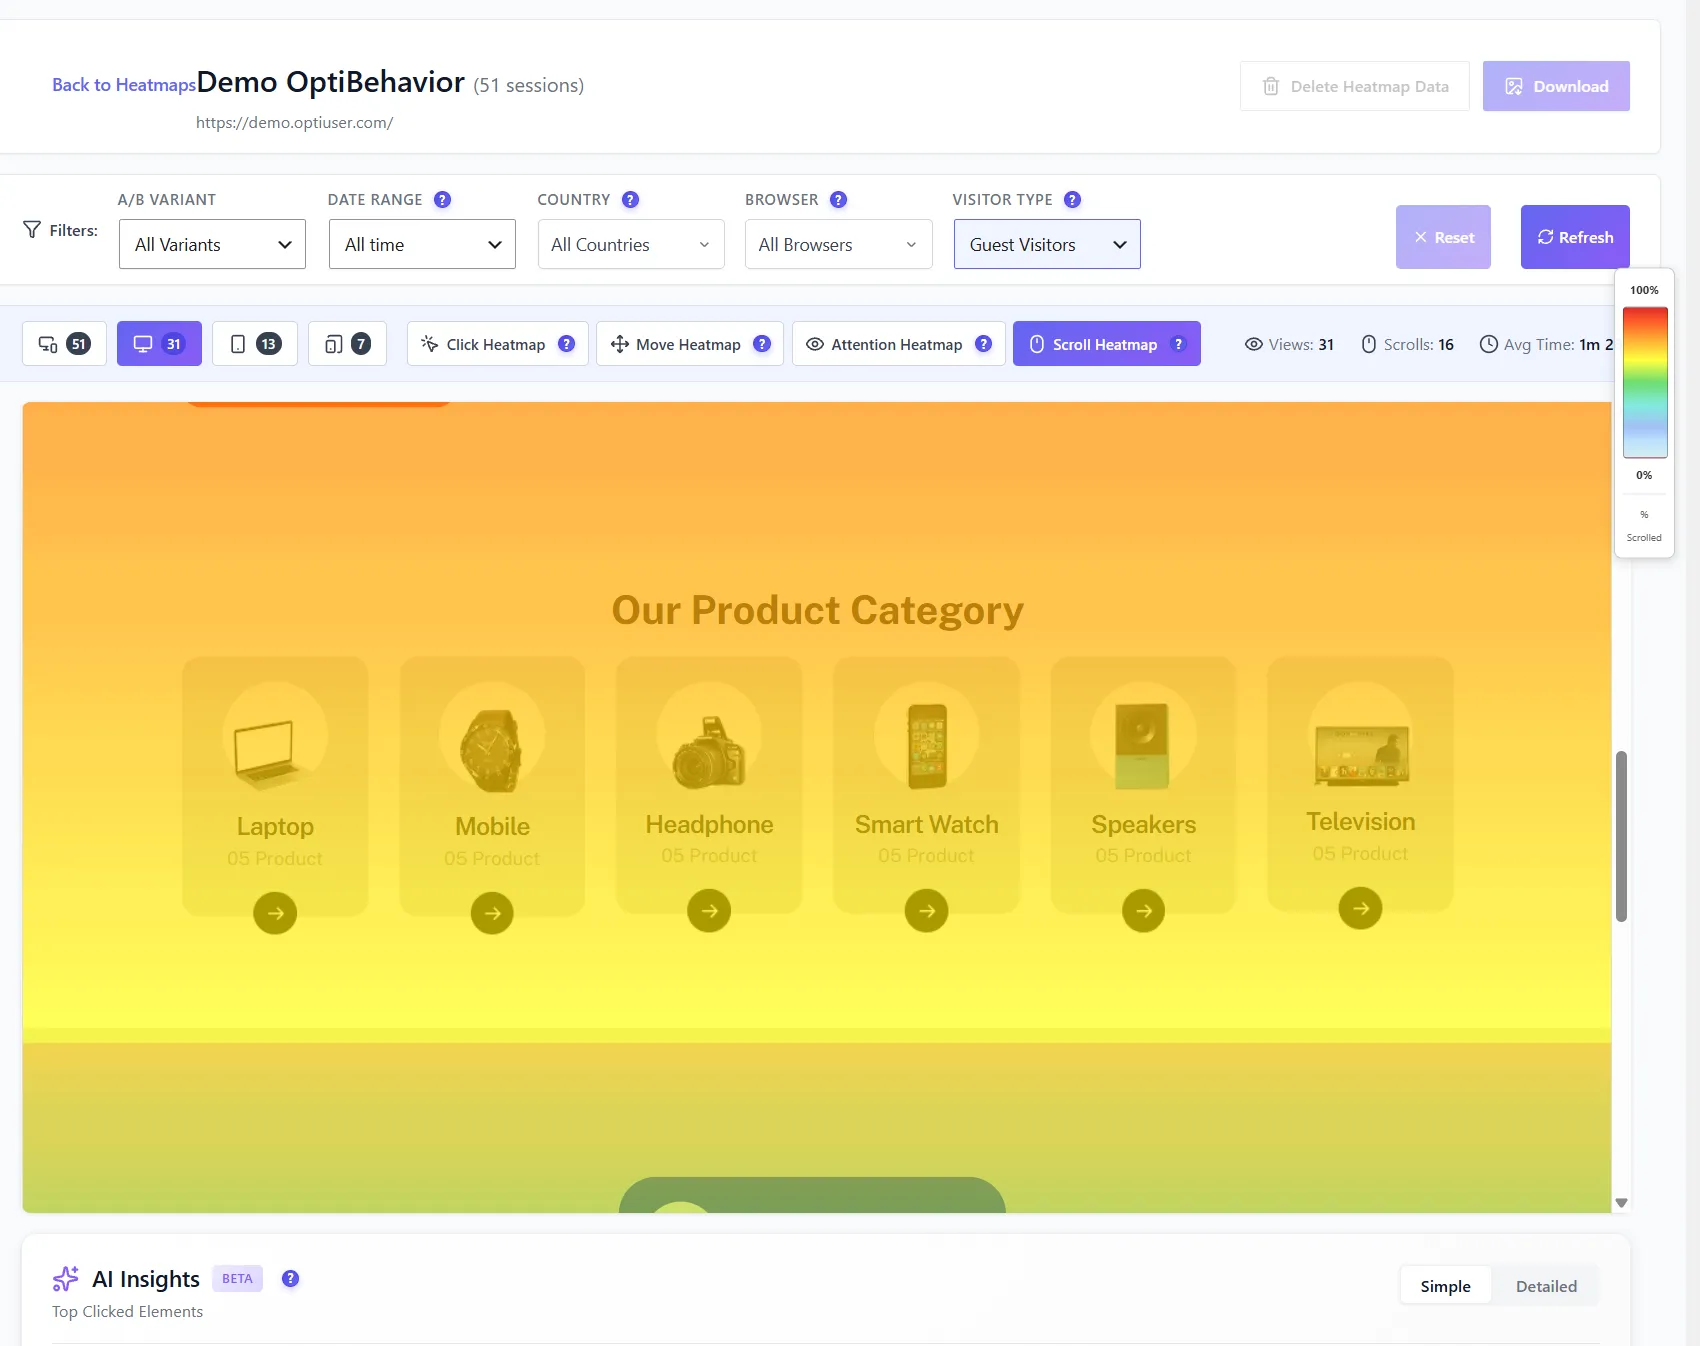
Scroll heatmap ProHow far each visitor gets. Move the button above the 58% line.
Desktop and mobile views, per page, all stored on your server.
FREEPRO
4 Types of Heatmaps
See exactly where users click, move, focus, and scroll — on every page. Separate desktop and mobile views. Advanced filtering. All data stays on your server.
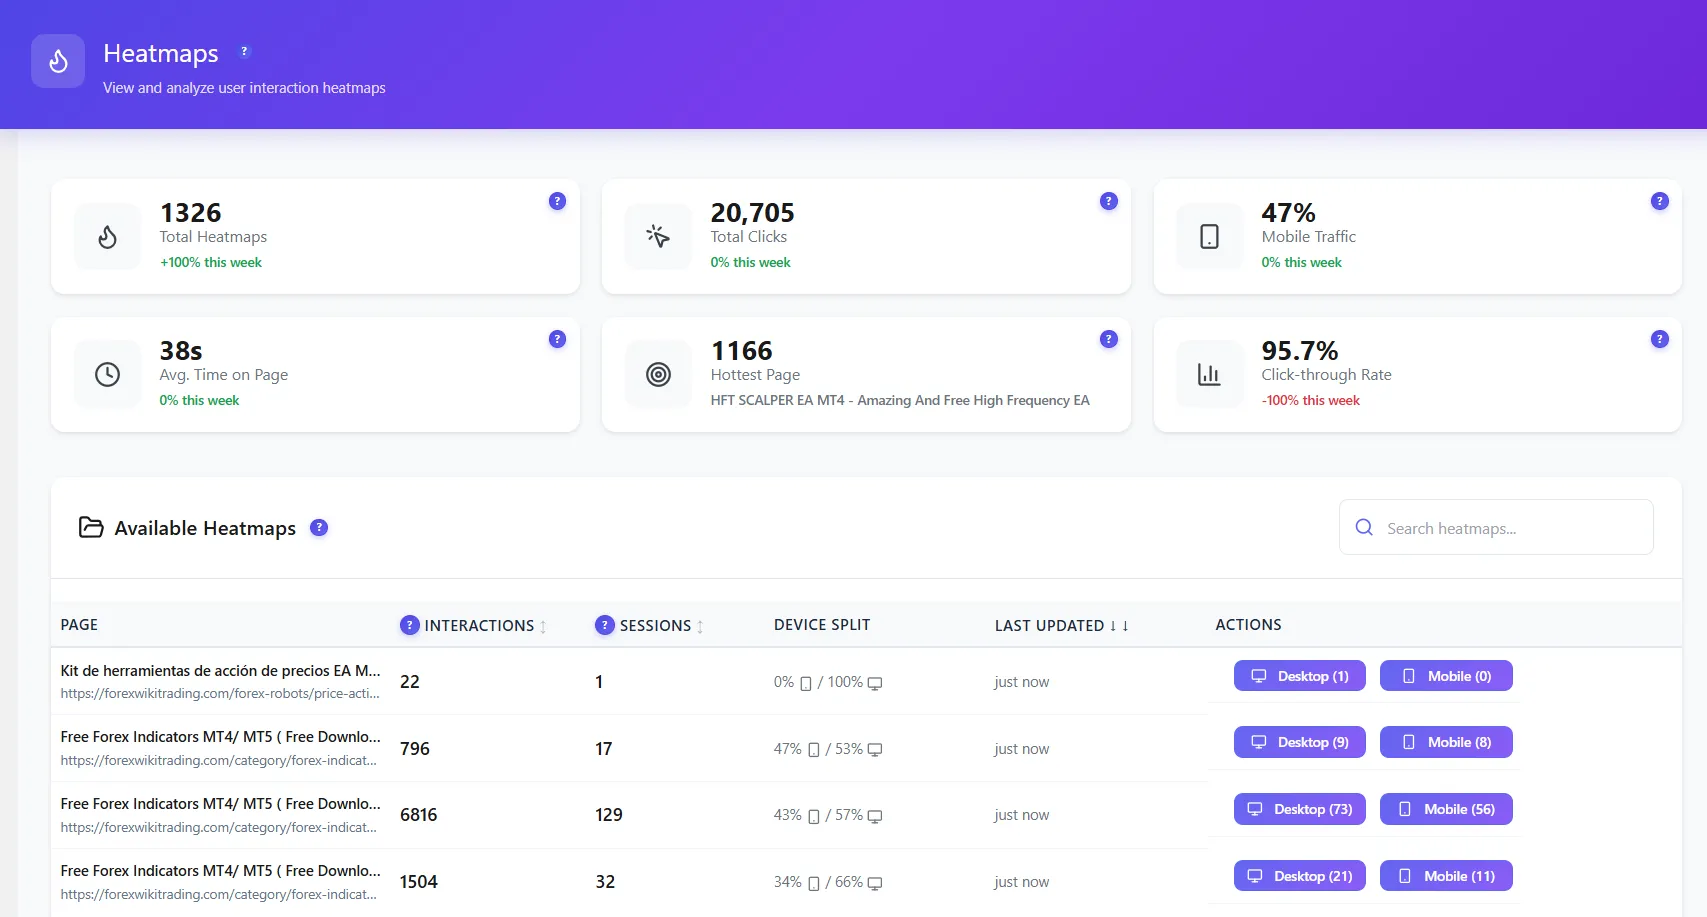
KPI OVERVIEW — WITH GROWTH INDICATOR
Total heatmaps — ↑Total clicks — ↑Mobile traffic — ↑Avg. time on page — ↑Hottest page /homeClick-through rate — ↑
Mobile, 3 pm. “Add to cart” works. “Buy now” doesn’t — four taps, nothing, gone. You watch it happen, click by click.
→
With Recordings
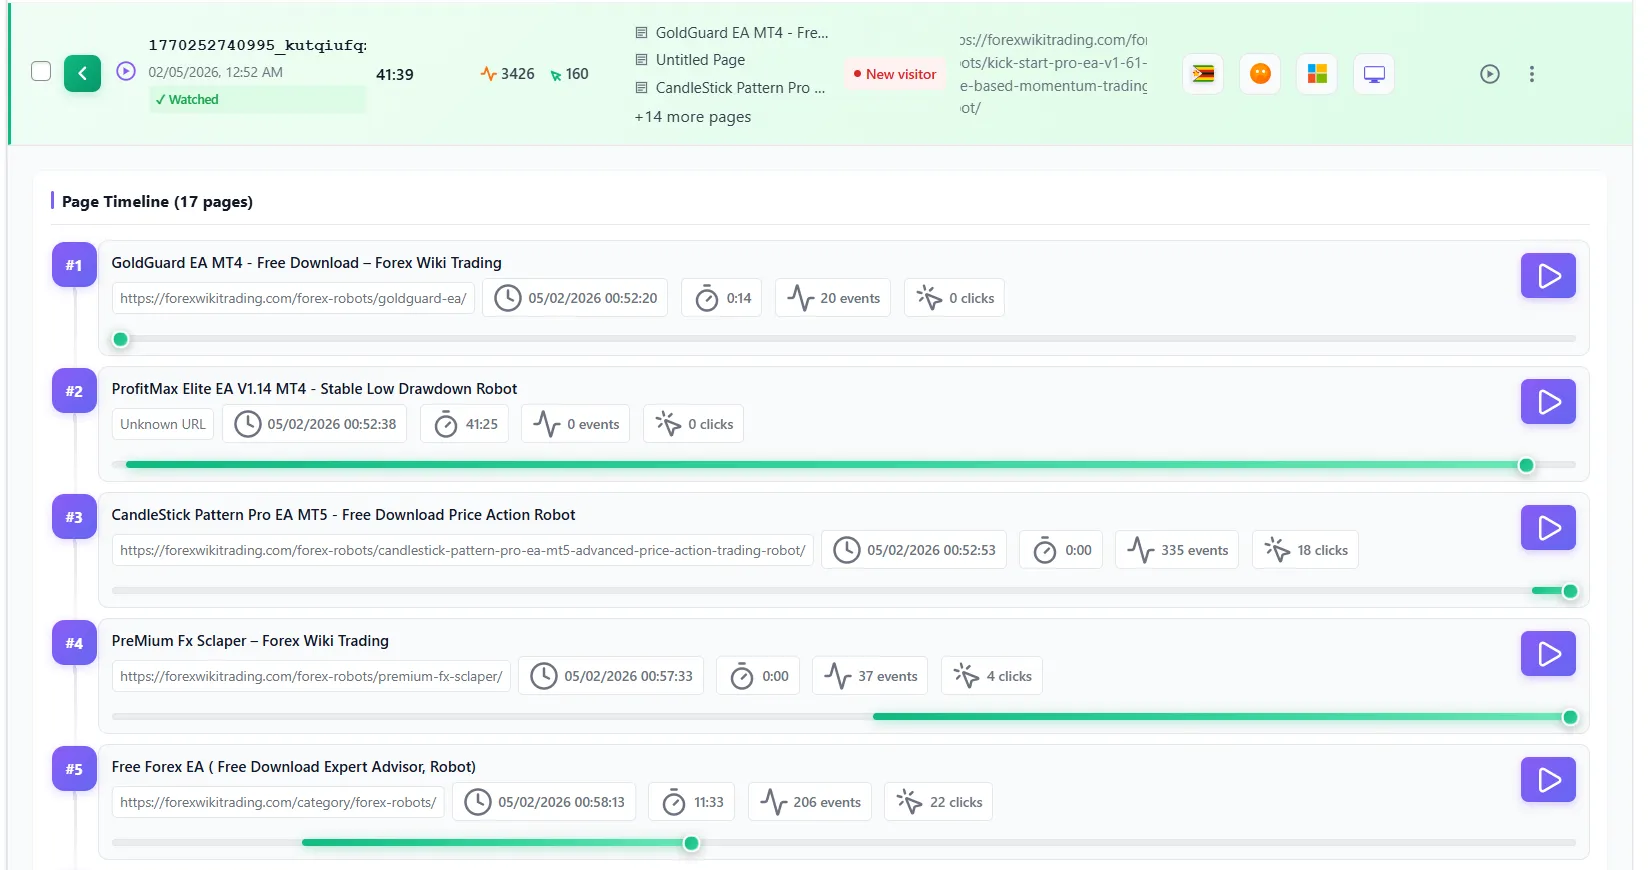
Replay the exact 12 secondsWatch the taps, the pause, the exit. No guessing from numbers.
Filtered for youJump straight to sessions with rage clicks, errors or abandoned carts.
Stored on your serverRecordings never leave WordPress. 90-day retention by default.
PRO6 Months Free
Session Recordings
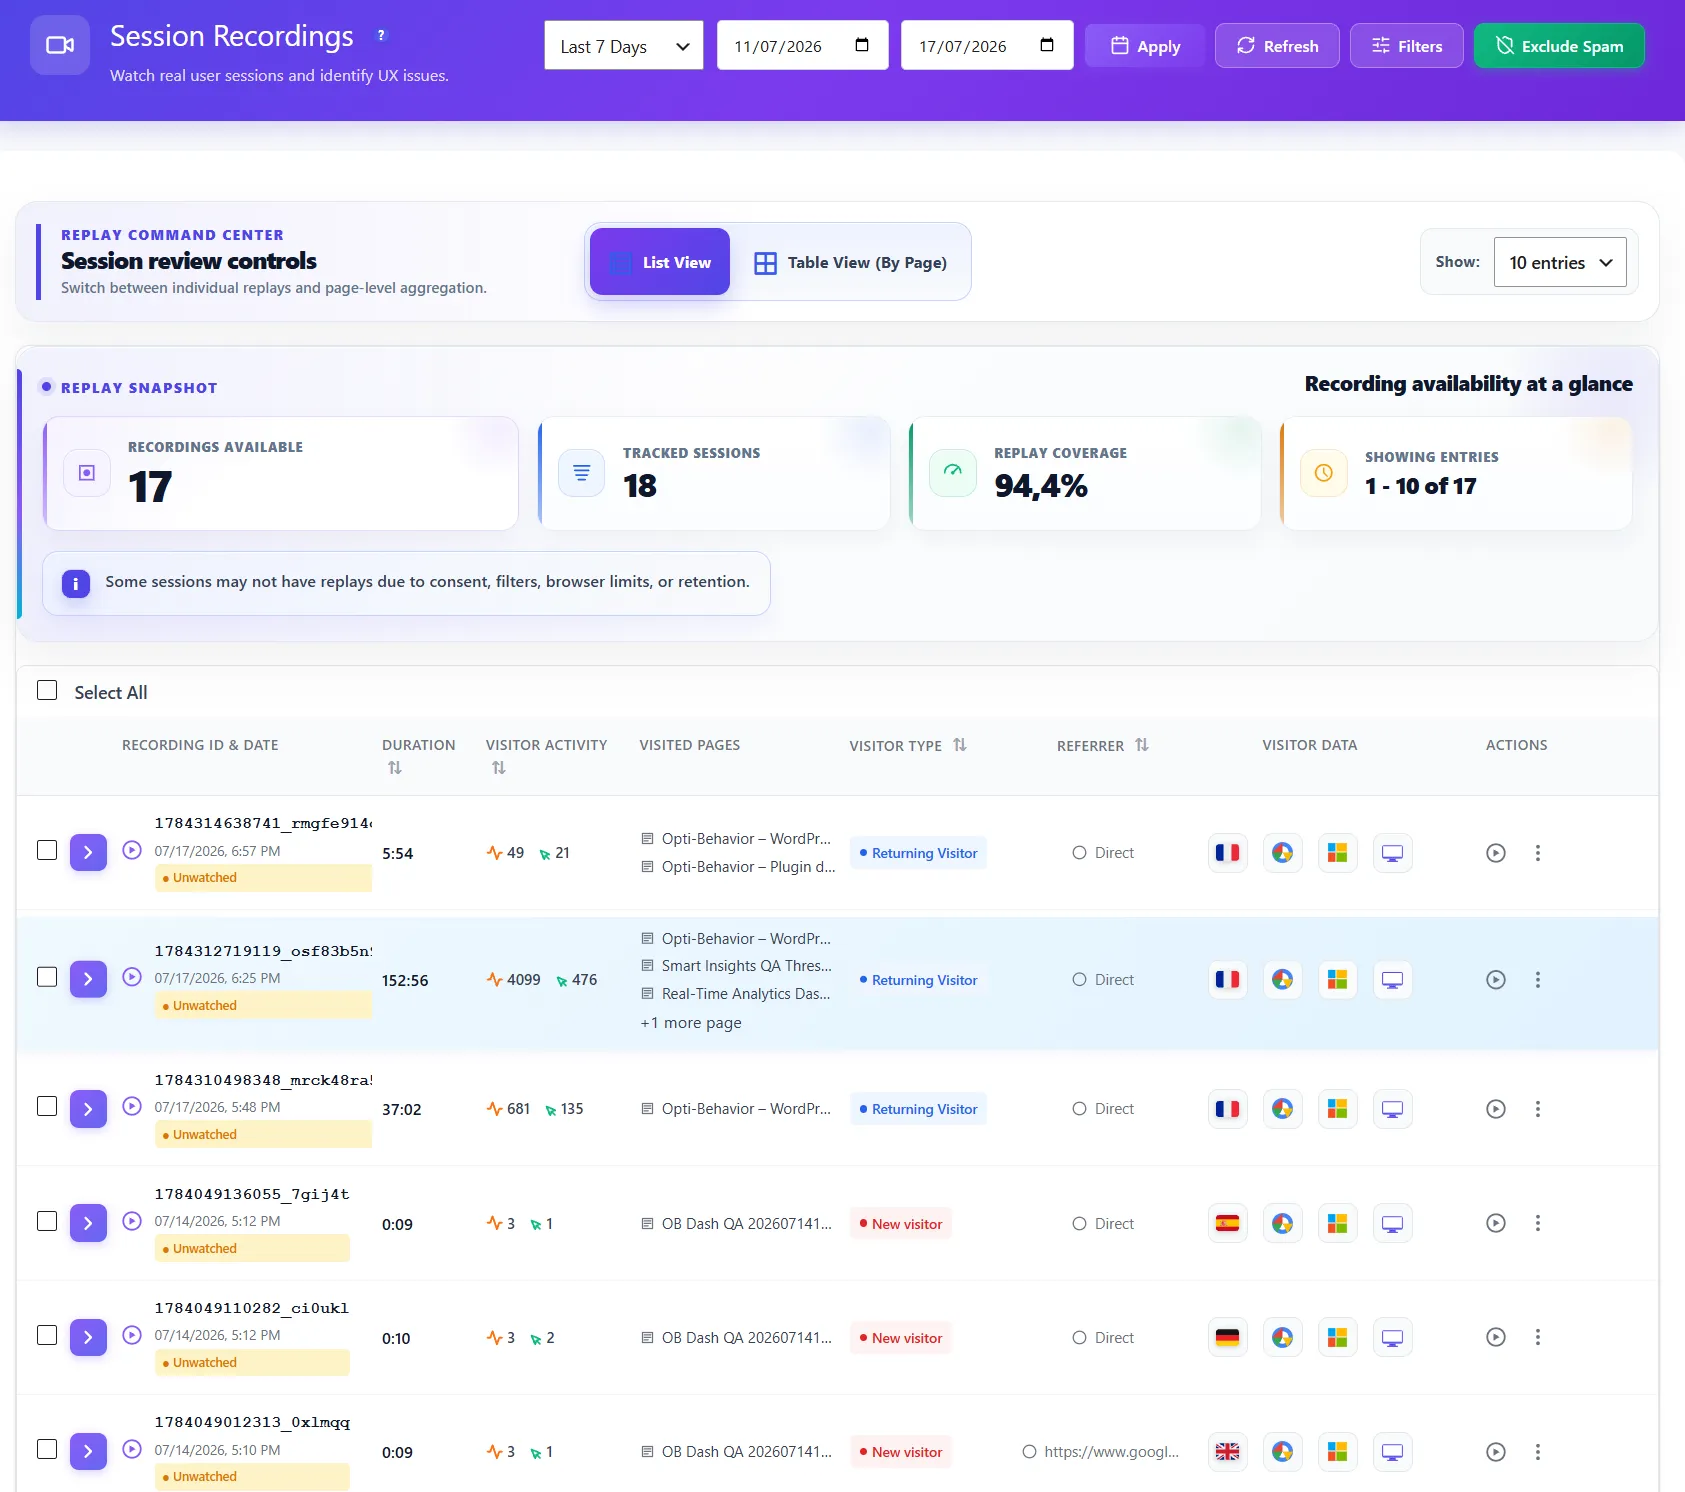
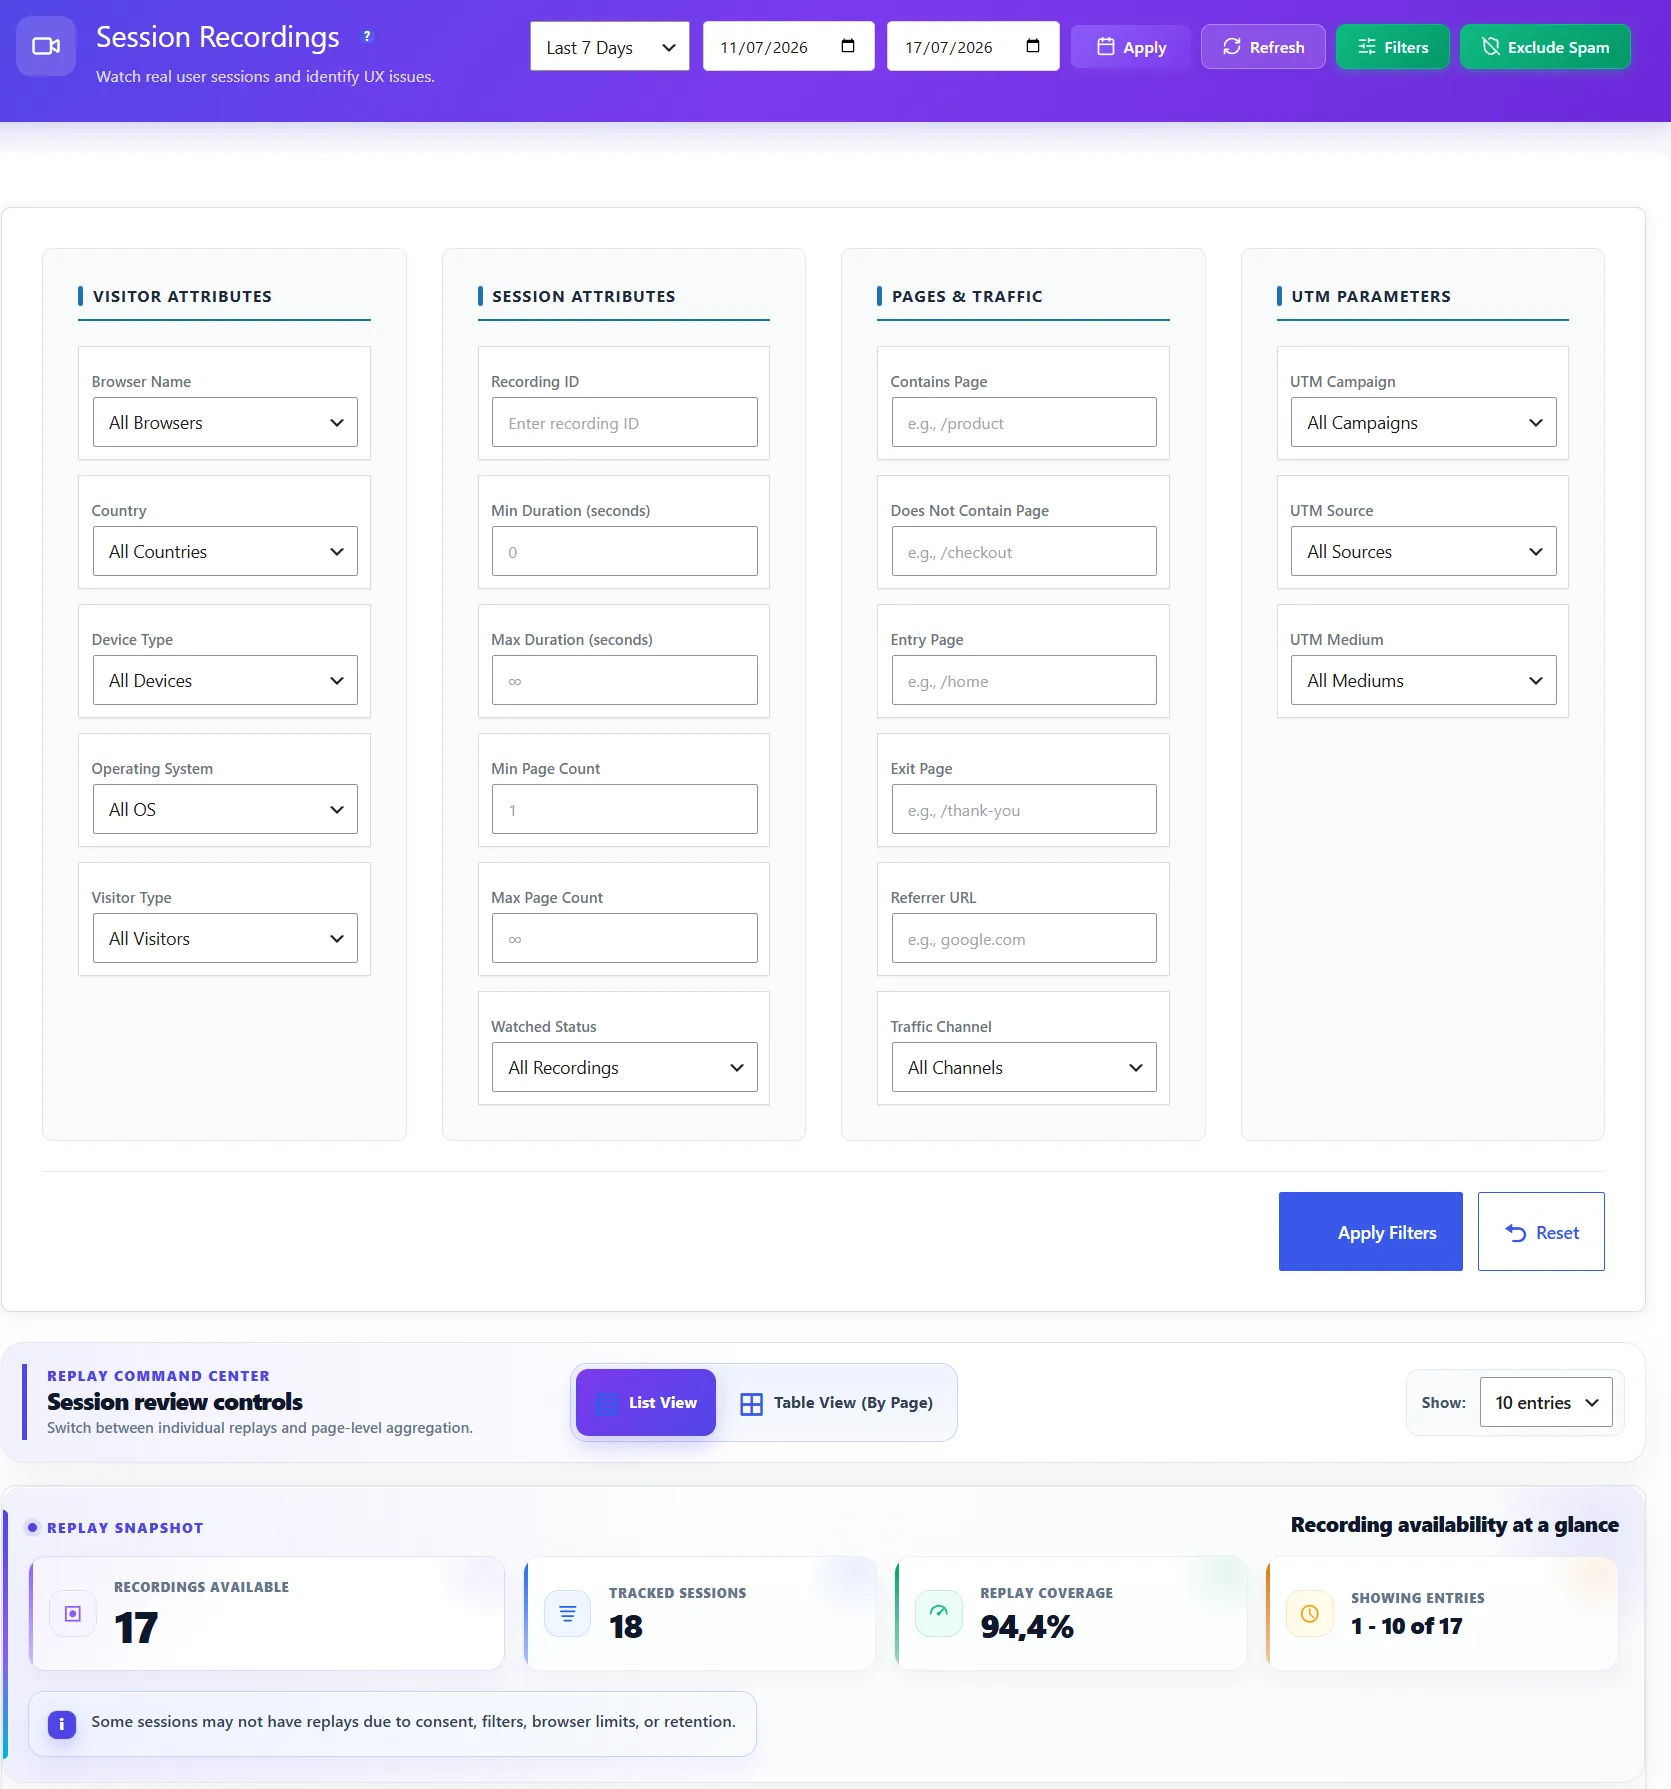
Watch real user sessions in full HD. Every click, scroll, hesitation, and tab change captured. Jump to any moment instantly — no more wasted time scrubbing through recordings.
SESSION TABLE COLUMNS
ID + DateDurationActivity countPages visitedVisitor typeReferrer URLCountryBrowserOSDevice typeWatch statusClicks count
PAGE TIMELINE PER SESSION
URL visitedTime of visitDuration on pageEvents countClicks countEntry pageExit pageJump to moment
SESSION ACTIONS
☆ Save to favorites↓ Download recording↗ Share URL◉ Mark watched○ Mark unwatched☐ Delete
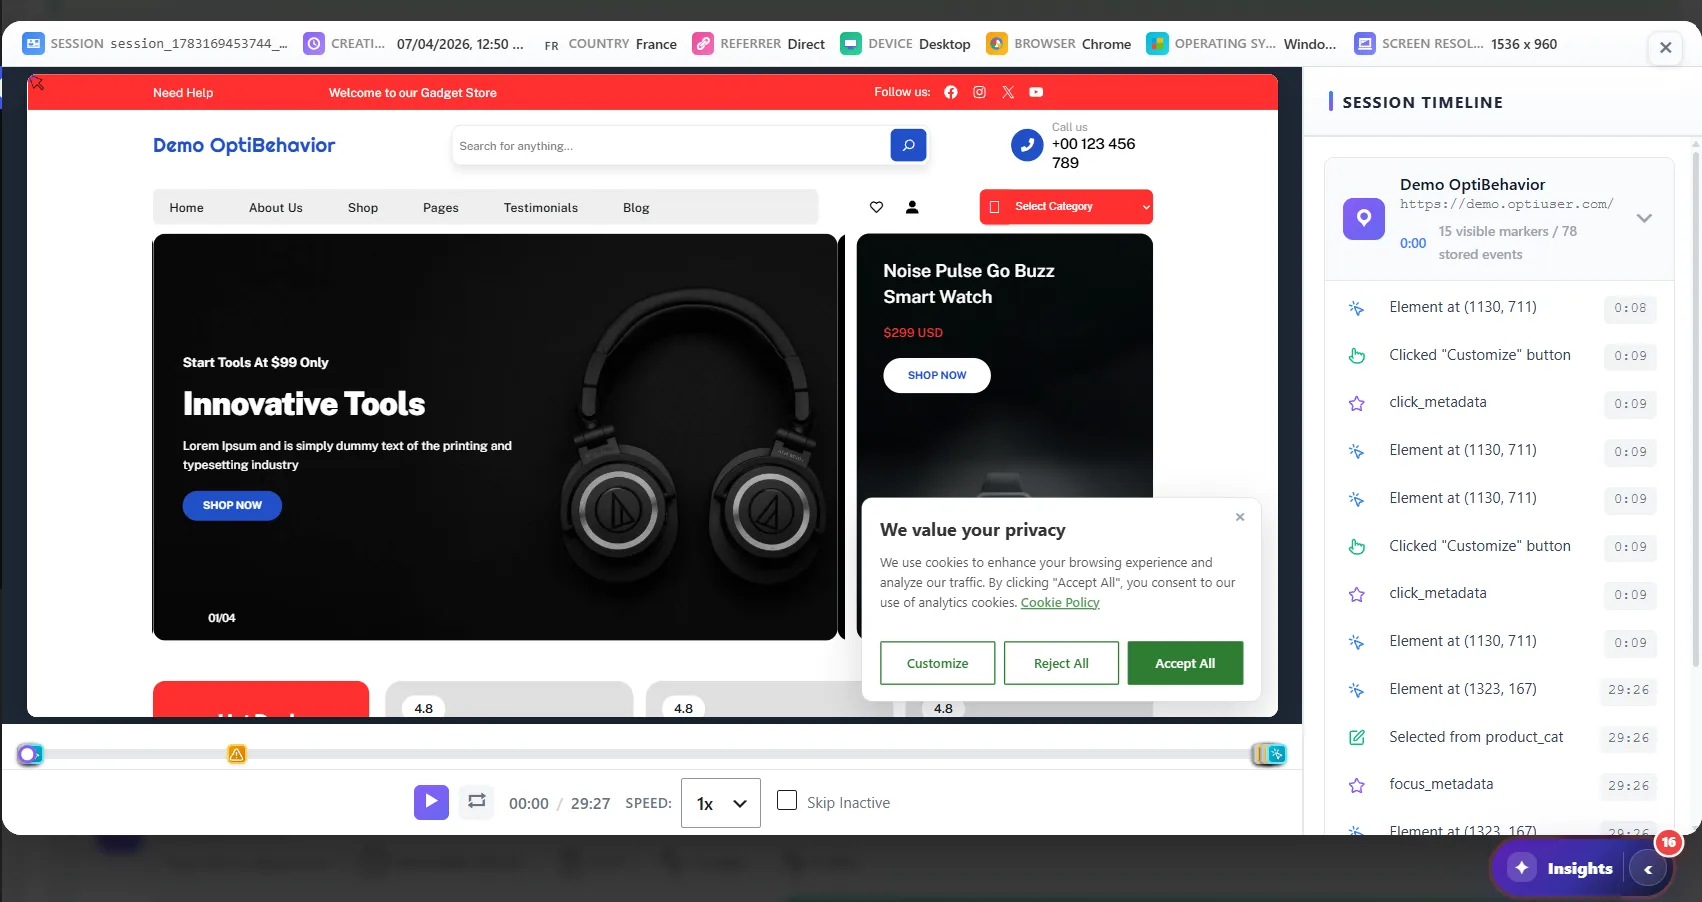
SESSION PLAYER
Visitor metadata barAlways visible
Country + browser OS + device type Session duration Pages visited count Referrer URL UTM parameters
Interactive timelineClick to jump
Every event is marked on the timeline. Click any event to jump directly to that moment — no scrubbing needed.
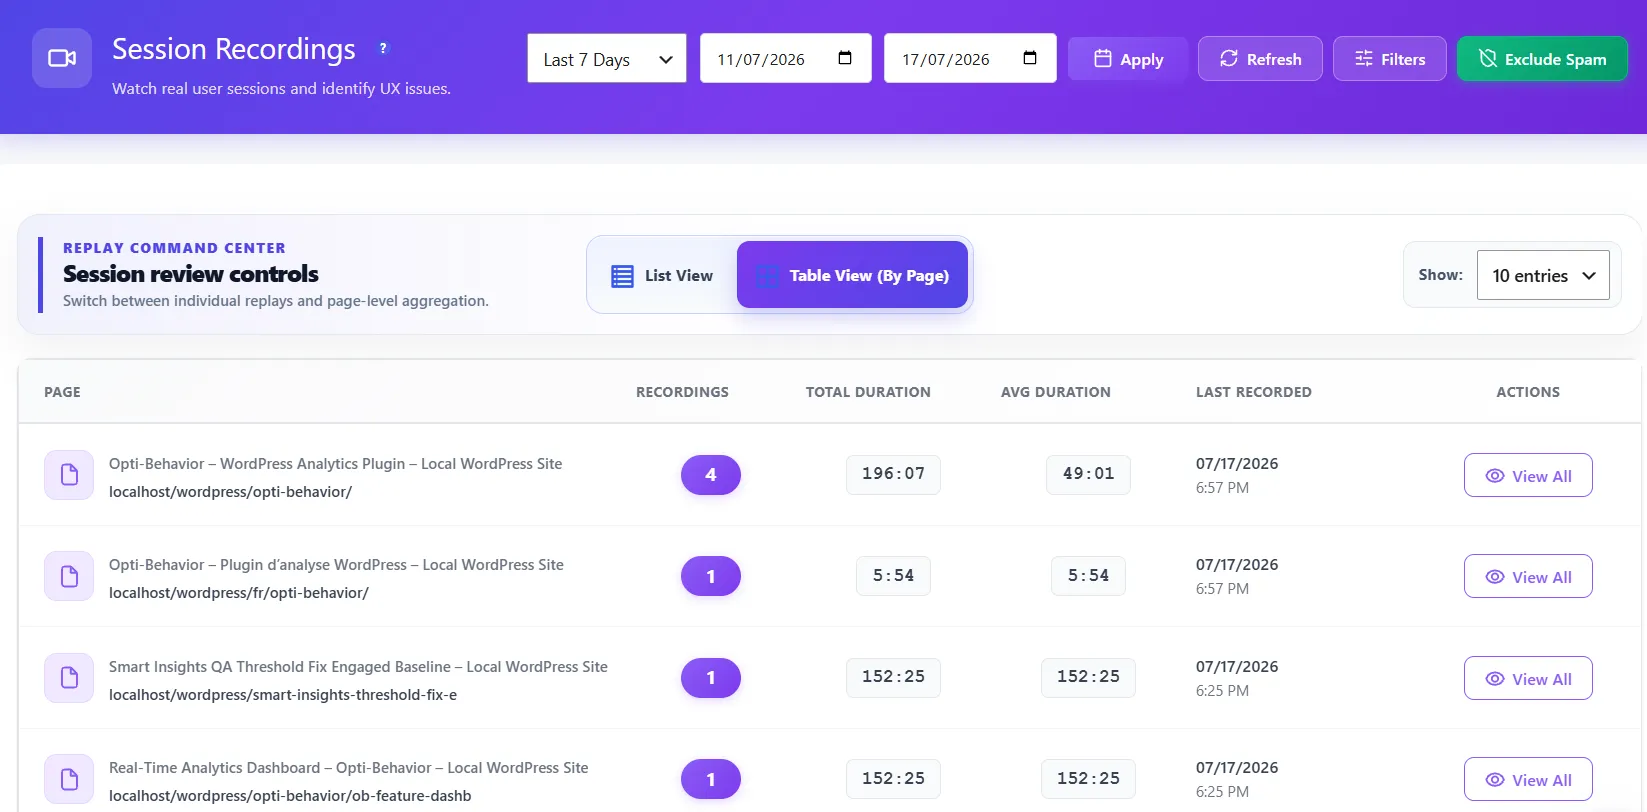
View all recordings for a specific page, post, or URL in one place — instantly see how visitors behave on each individual page without manual filtering.
Sales are down and every report says “conversion 1.4%”. Which step is the leak?
→
With Funnels
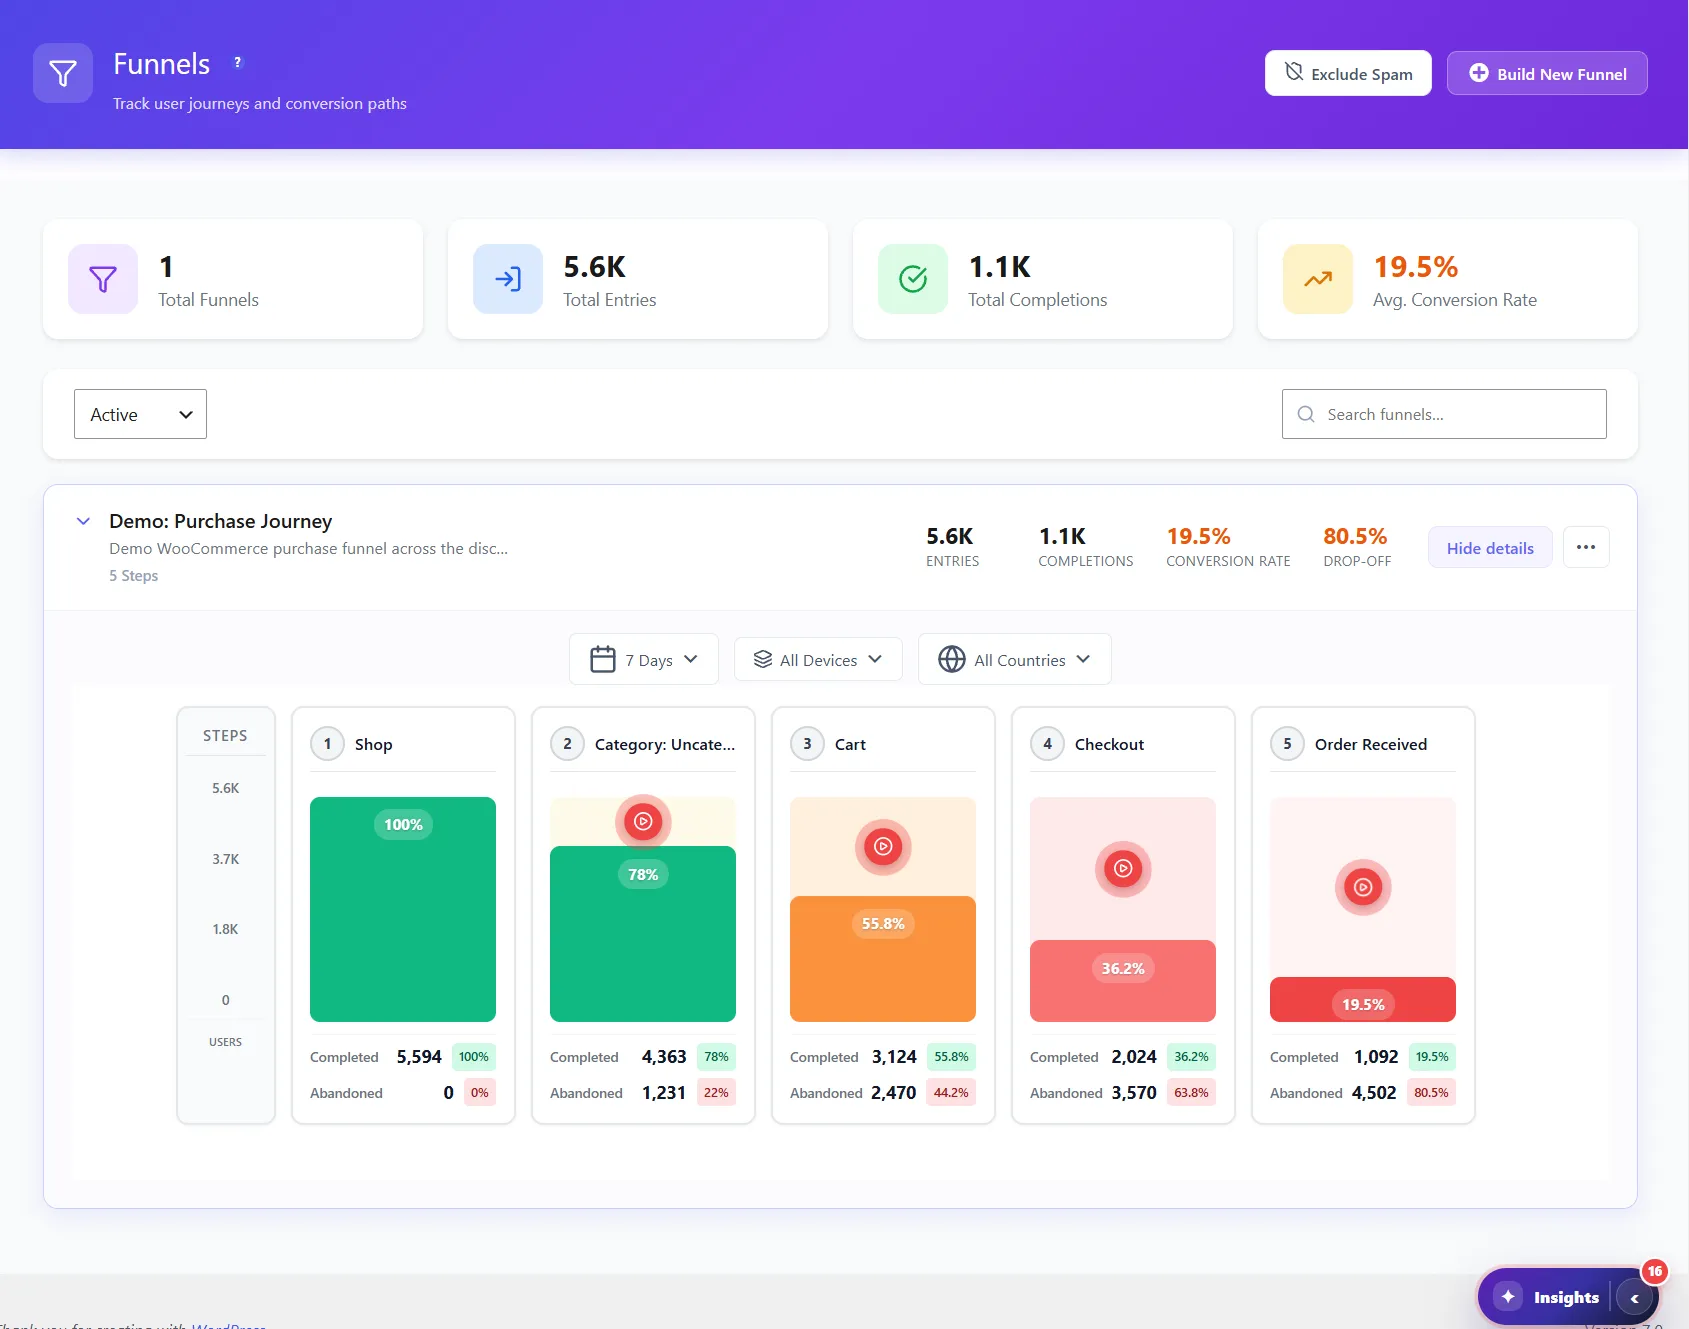
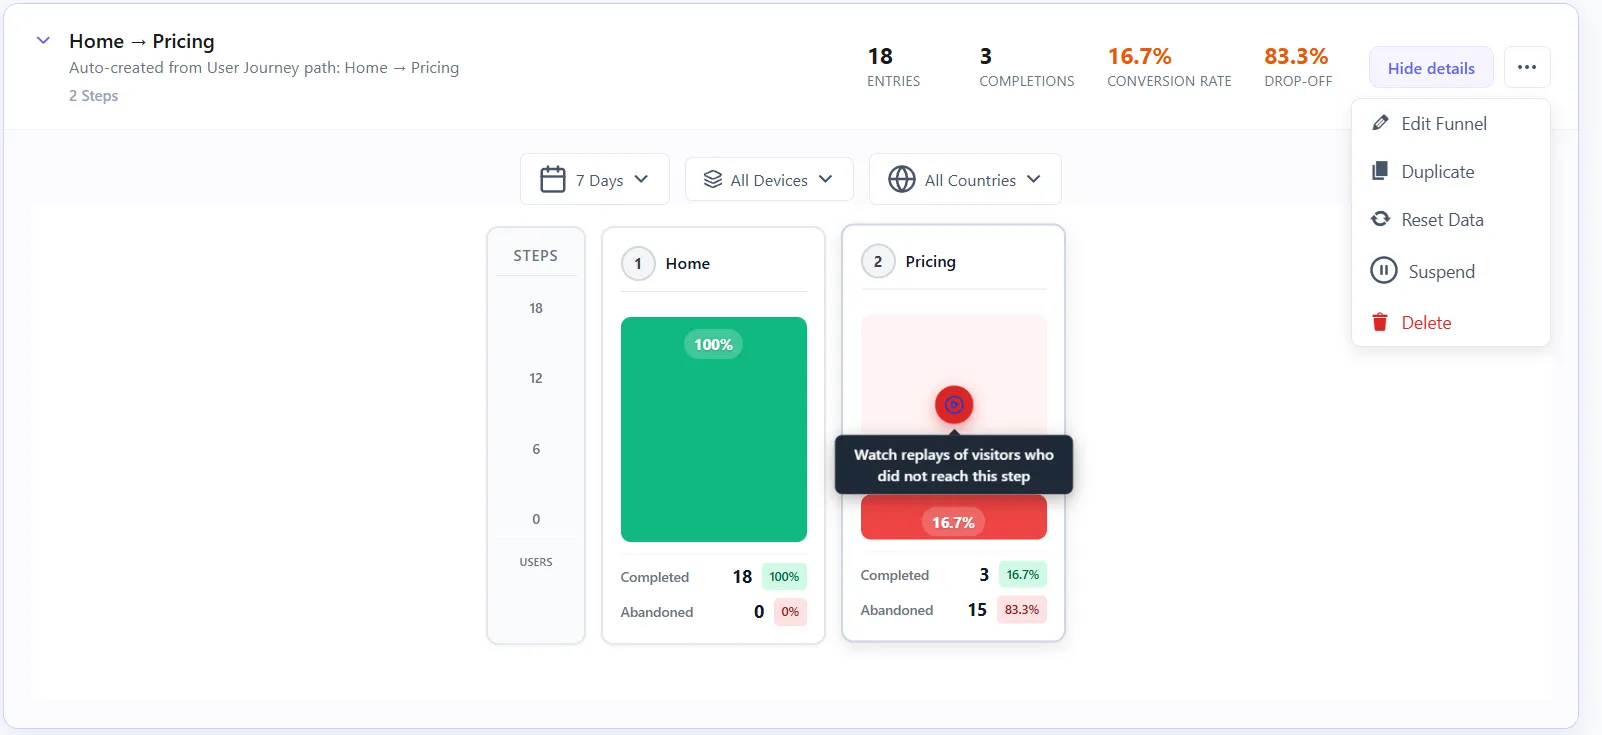
See the step that leaksDrop-off per step, with the count and the percentage — not one blended rate.
Split by deviceThe shipping step loses 61% on mobile and 22% on desktop. Now you know where.
Jump to the evidenceOne click from the leaking step to the recordings of visitors who left there.
FREE
Conversion Funnels
Build unlimited multi-step funnels to track exactly where visitors drop off. Visual dropout analysis at every step — with percentage, abandoned count, and device breakdown.
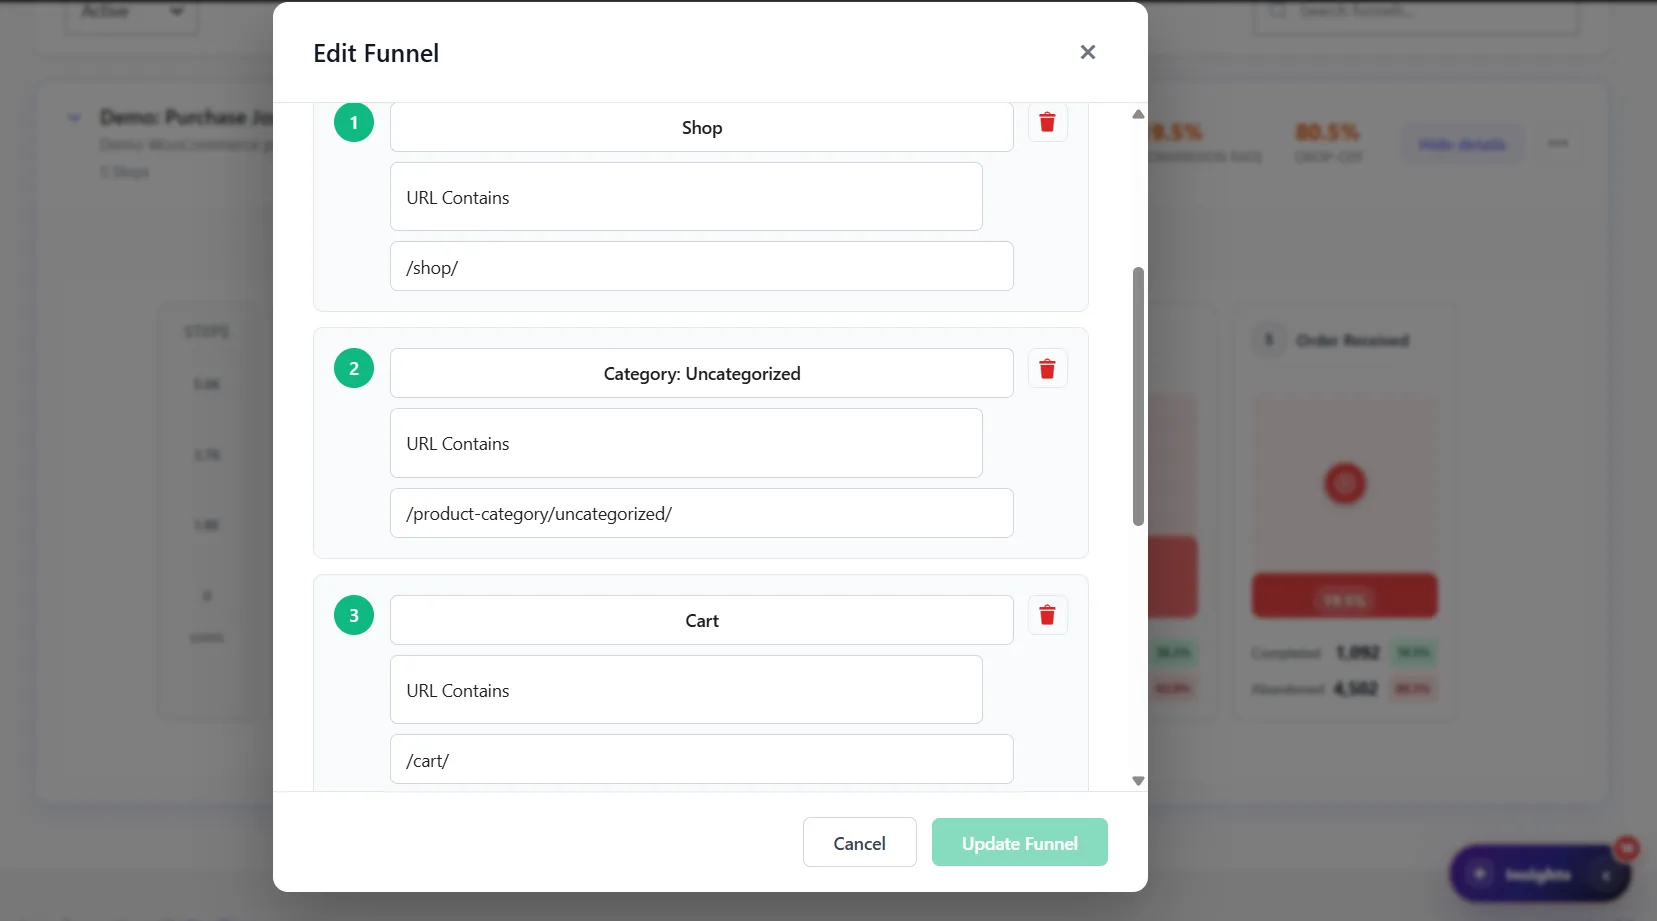
STEP MATCHING RULES
Any page viewMatches all pagesExact URLPerfect match onlyURL containsPartial keywordURL starts withPrefix matchURL ends withSuffix matchRegexAdvanced patterns
Half your leads type their name and email, hit “Company VAT number” and close the tab.
→
With Form Analytics
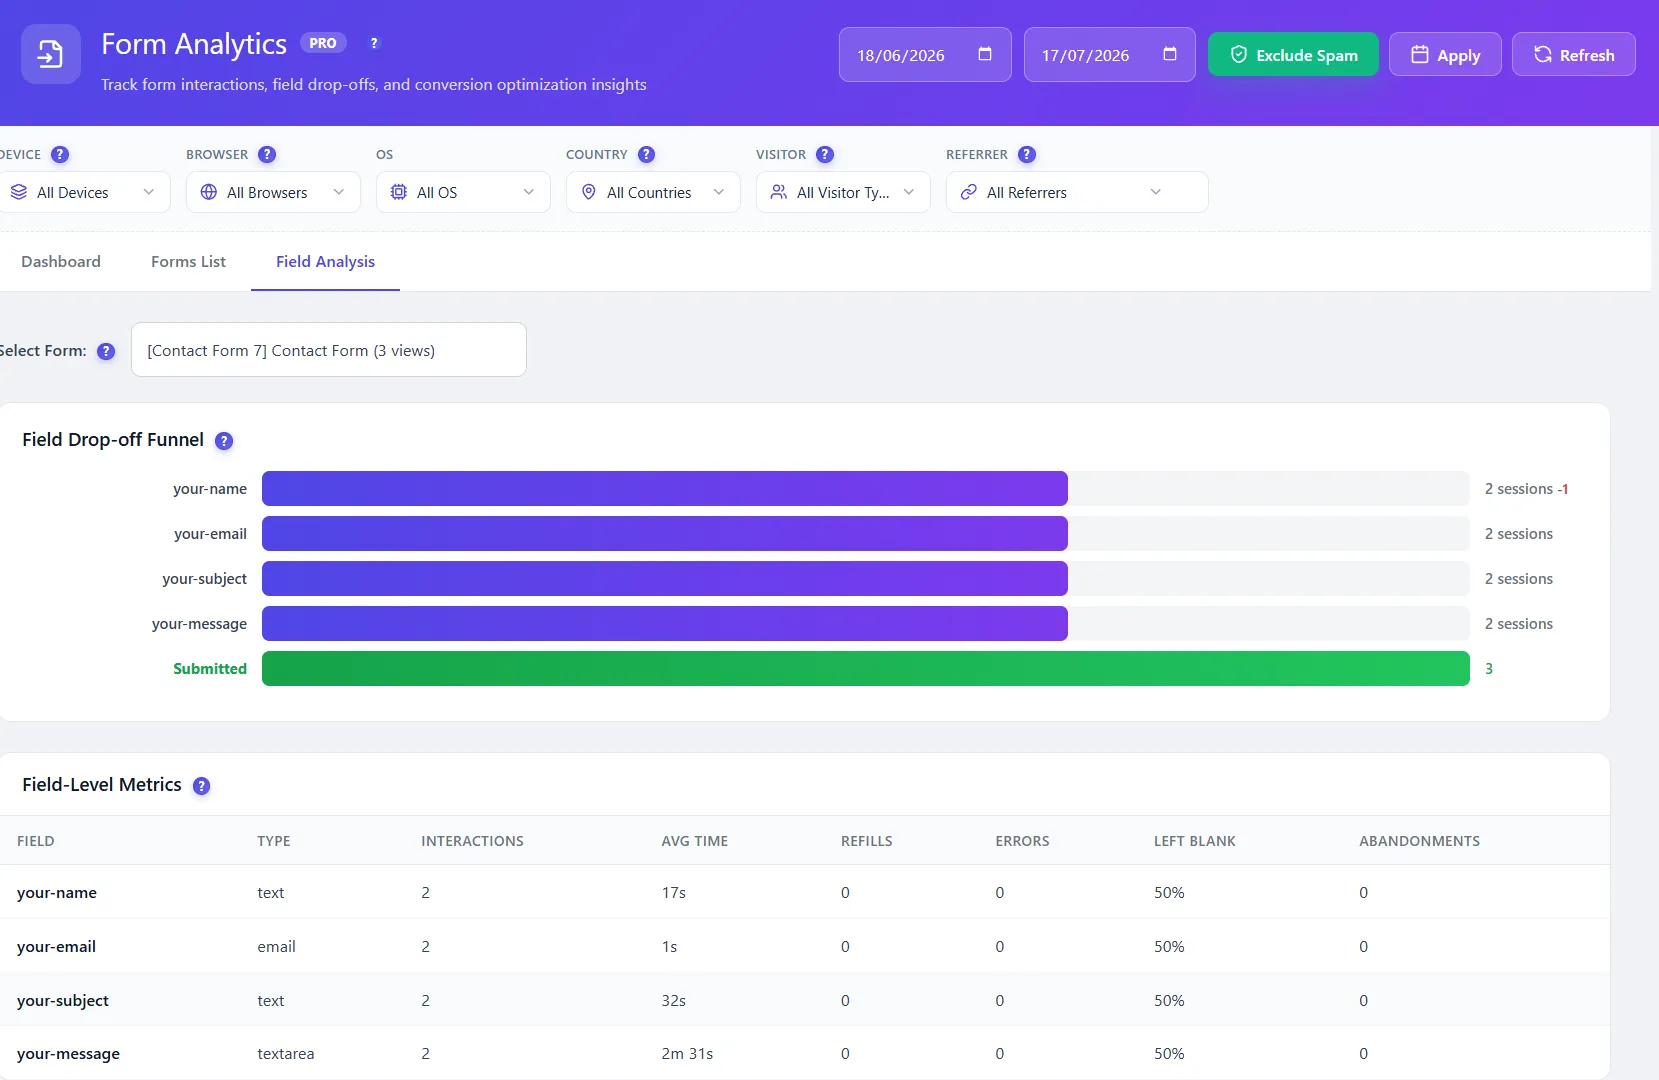
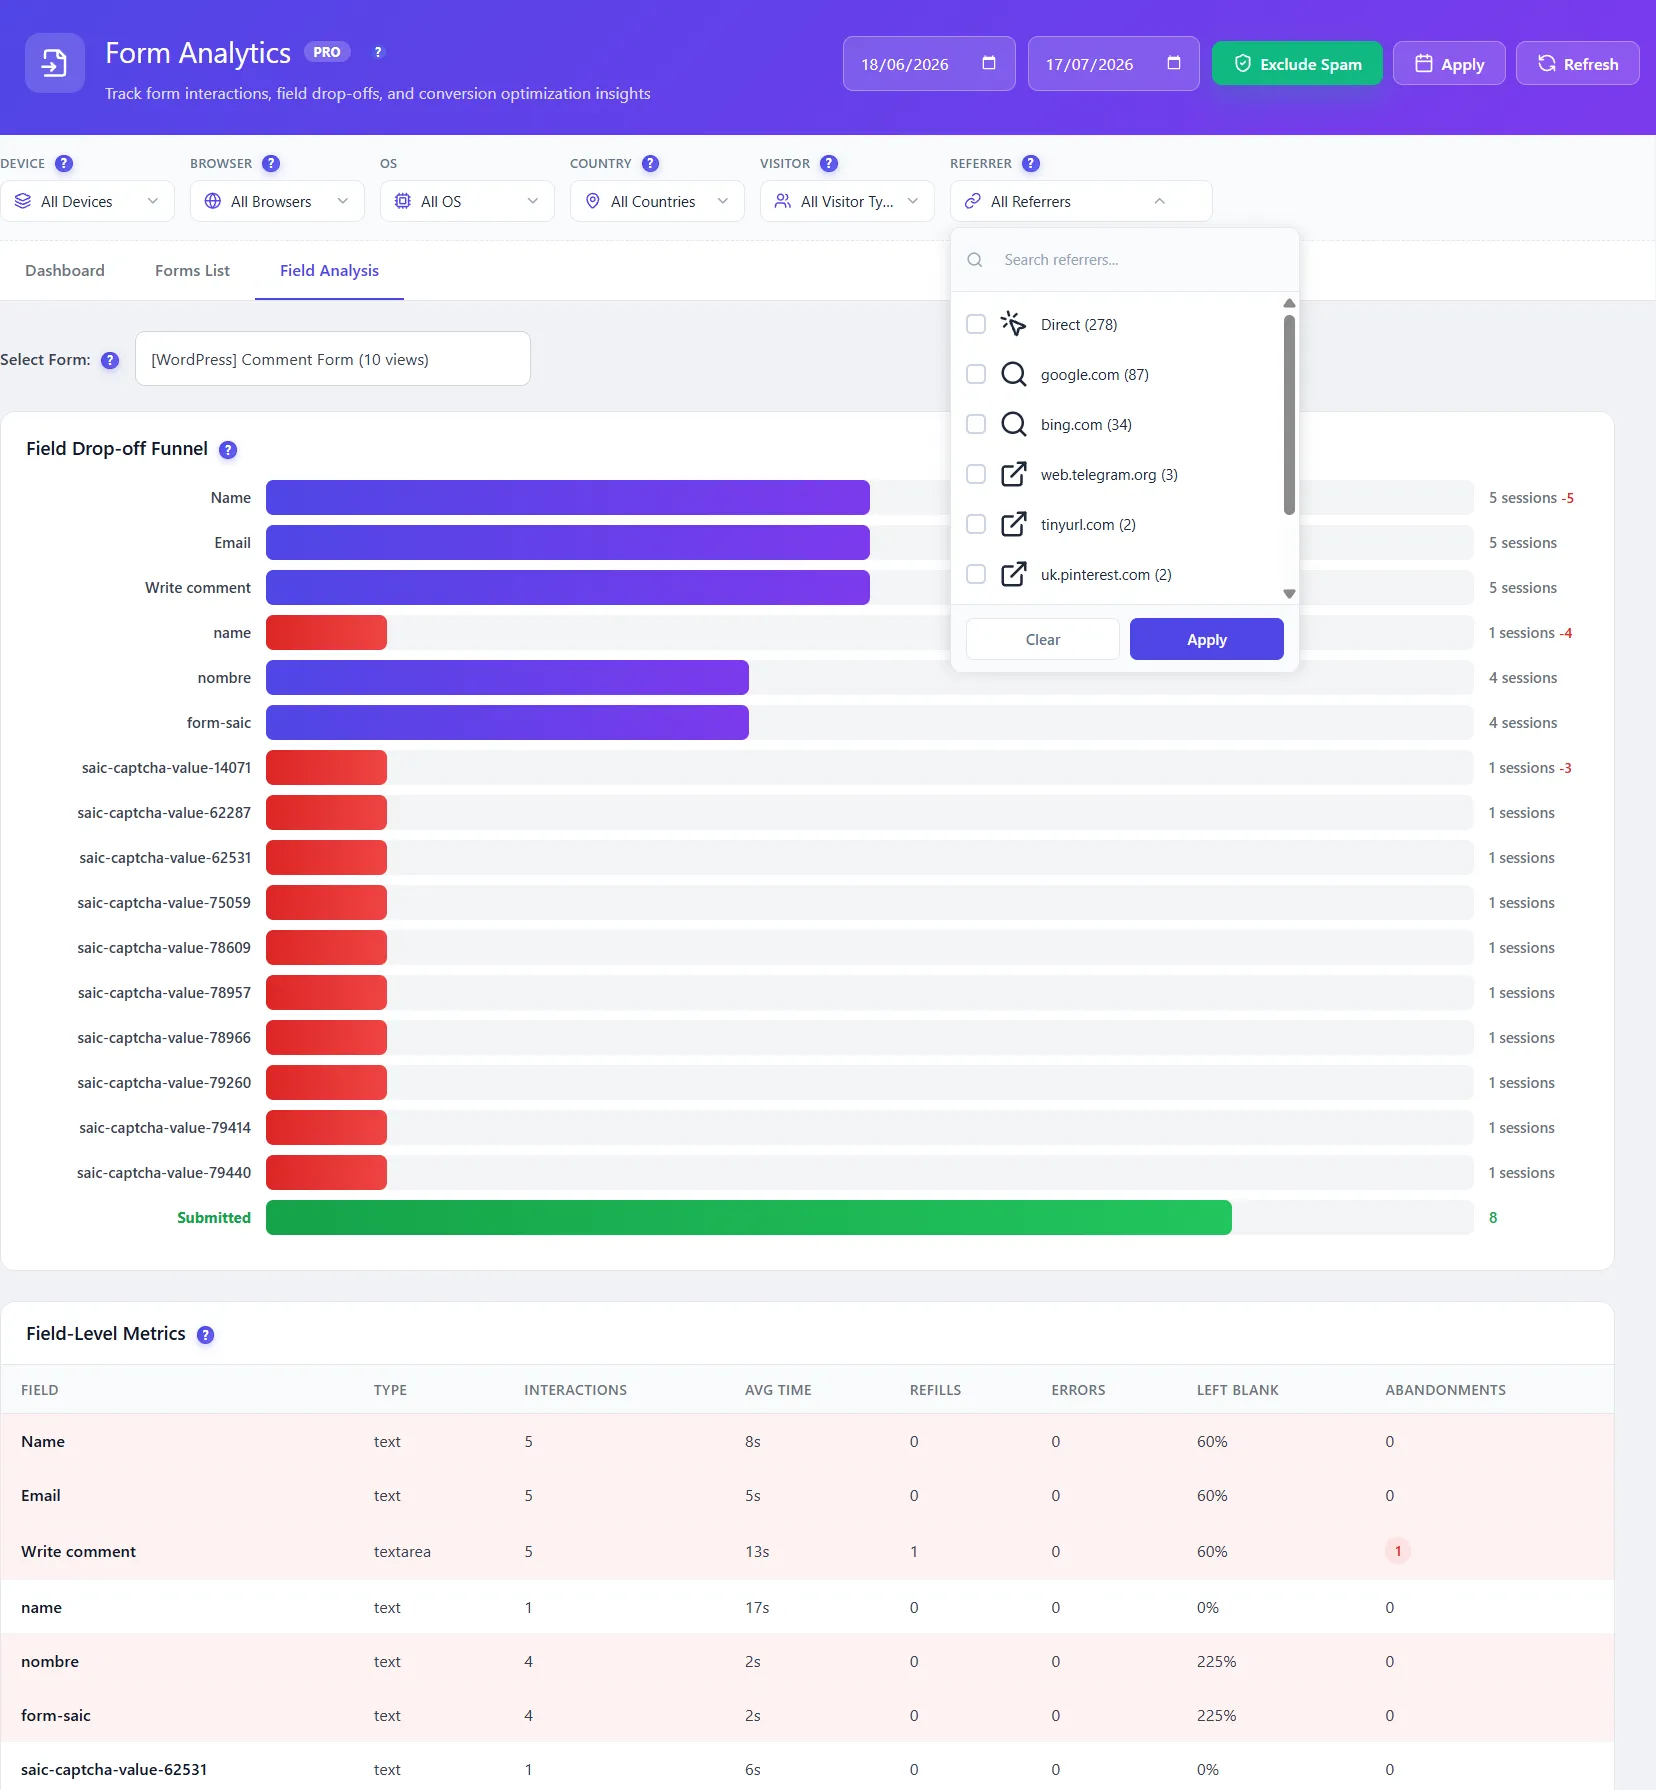
Field-by-field drop-offTime spent, refills and abandonment per field. The guilty field is obvious.
Works with every form pluginGravity, WPForms, Contact Form 7, Elementor, Fluent — no setup.
Fix with evidenceRemove or move the field, then watch completion rise on the same chart.
PRO6 Months Free
Form Analytics
Track every form interaction at the field level. Drop-off funnels, time per field, error detection, and session replay for every form submission — all self-hosted.
Auto-detects all forms — no manual setup needed. Works with CF7, WPForms, Gravity Forms, Forminator, Ninja Forms, Everest Forms, SureForms, and native HTML forms
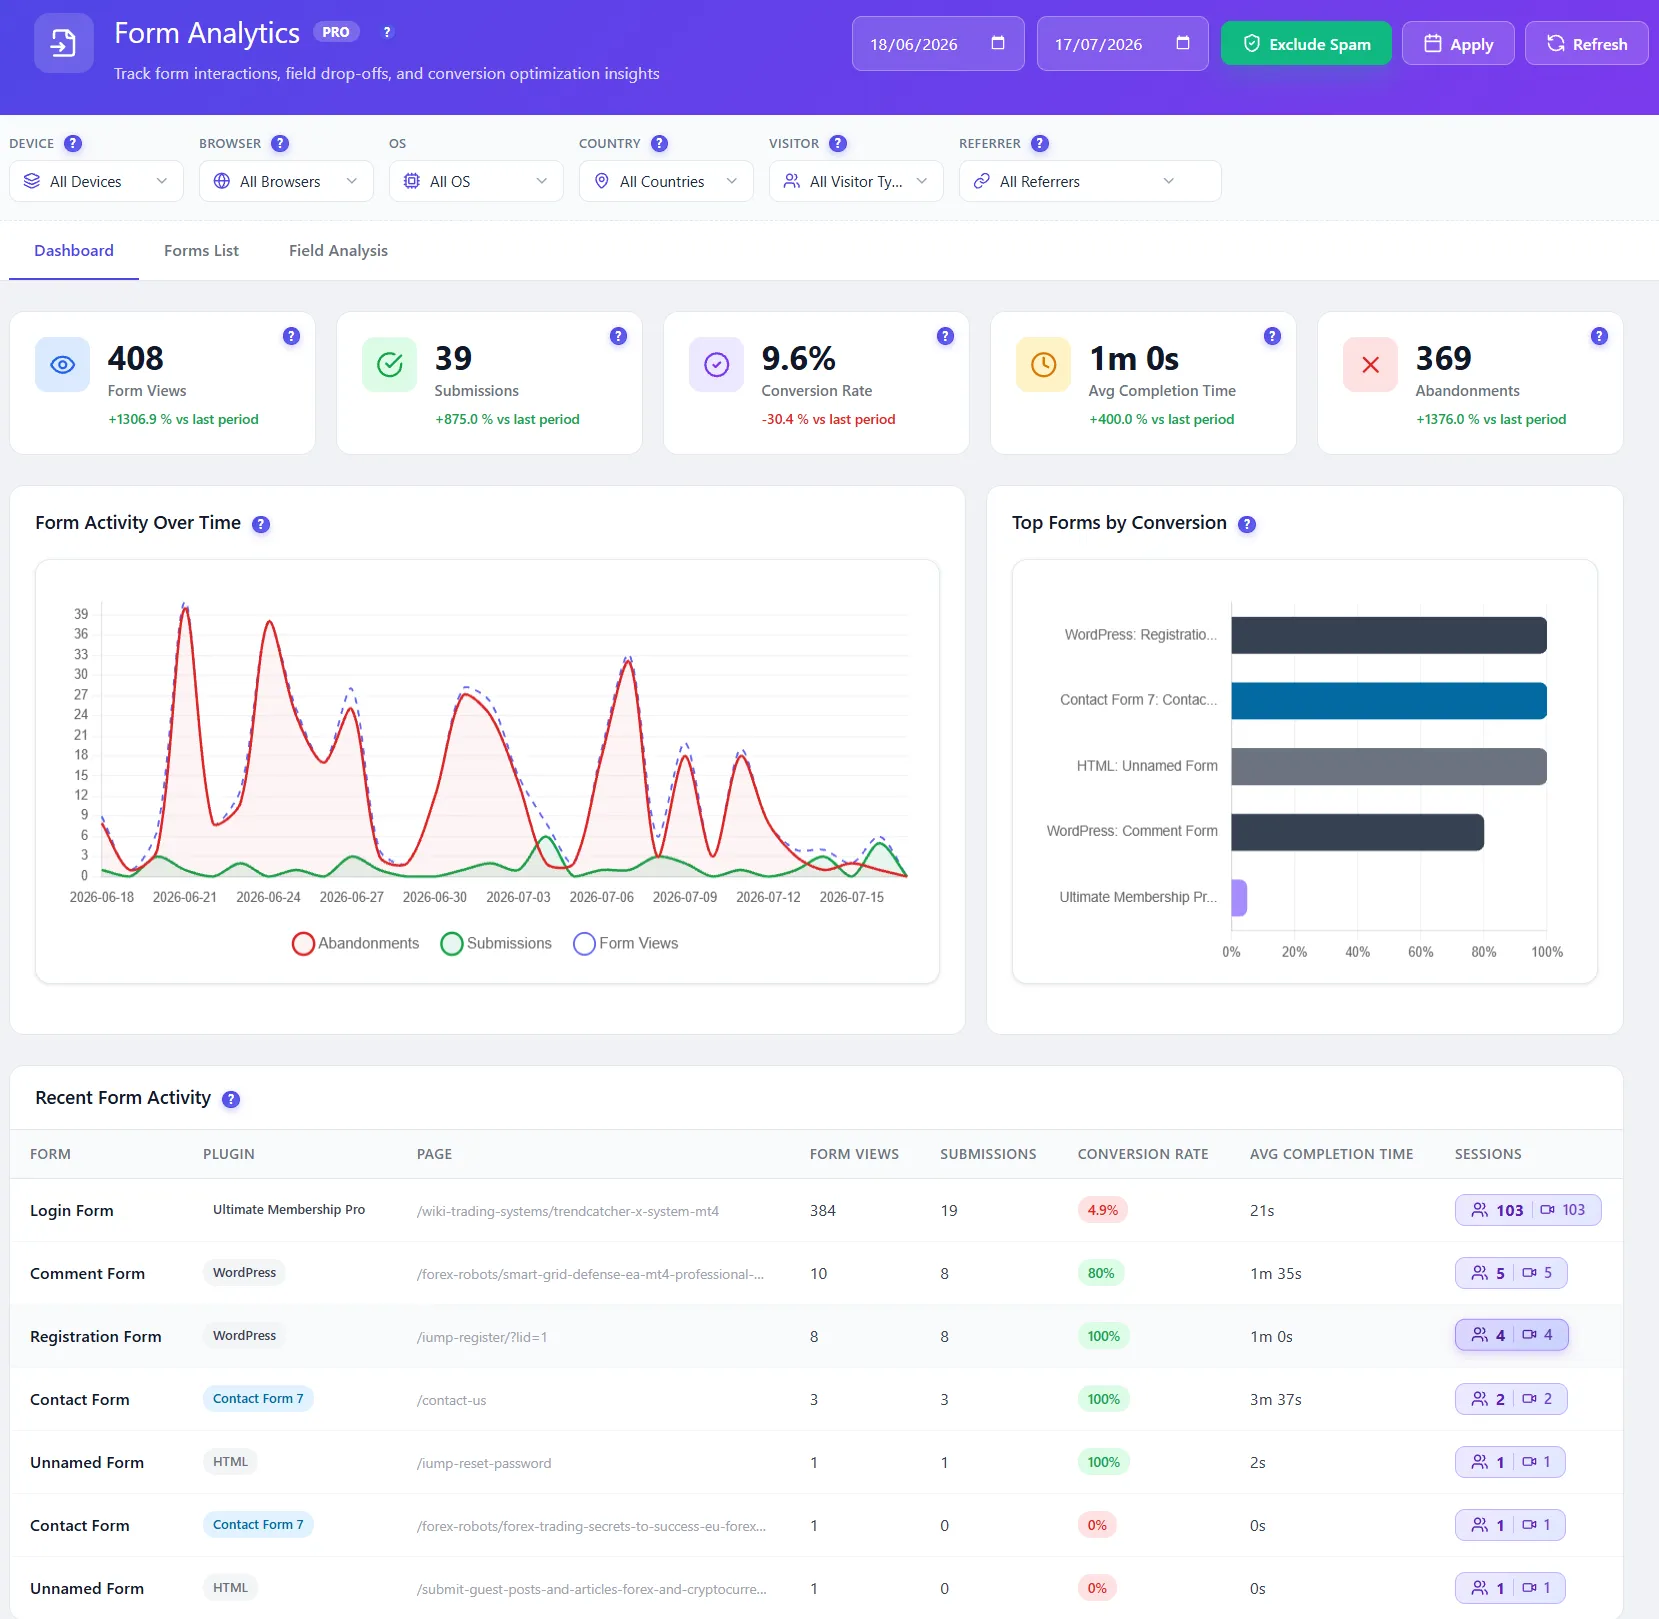
Form-level KPIs — Form Views, Submissions, Conversion Rate, Avg. Completion Time, Abandonments — all with growth indicator
Form Activity Over Time chart — history of views, submissions, and abandonments on the same curve
Top Forms by Conversion — ranked by submission rate so you instantly see which forms perform best
Field drop-off funnel — visual funnel showing exactly which field causes visitors to abandon your form
Field-level metrics — Interactions, Avg. Time, Refills, Error Rate, Blank Rate — per field, per form
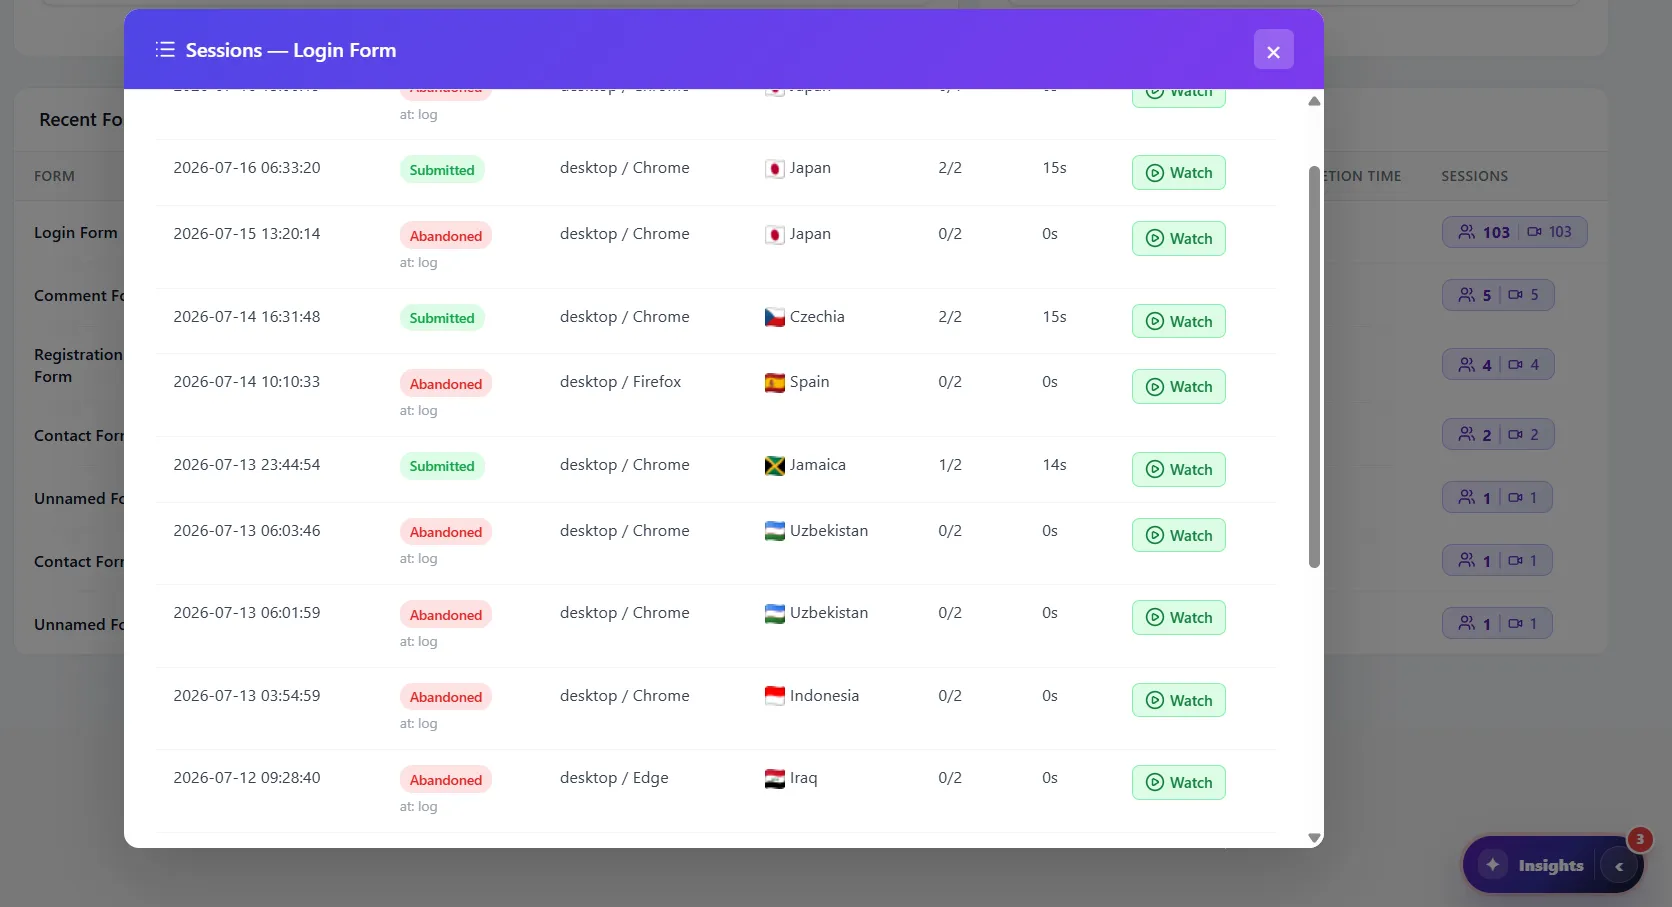
Session recordings per form — watch every session where a user interacted with a specific form. Filter by submitted vs abandoned
Abandoned vs submitted tracking — see the last field a visitor was on when they left your form
DASHBOARD TAB Overview
Form Views Submissions Conversion Rate Avg. Completion Time Abandonments Top Forms by Conversion
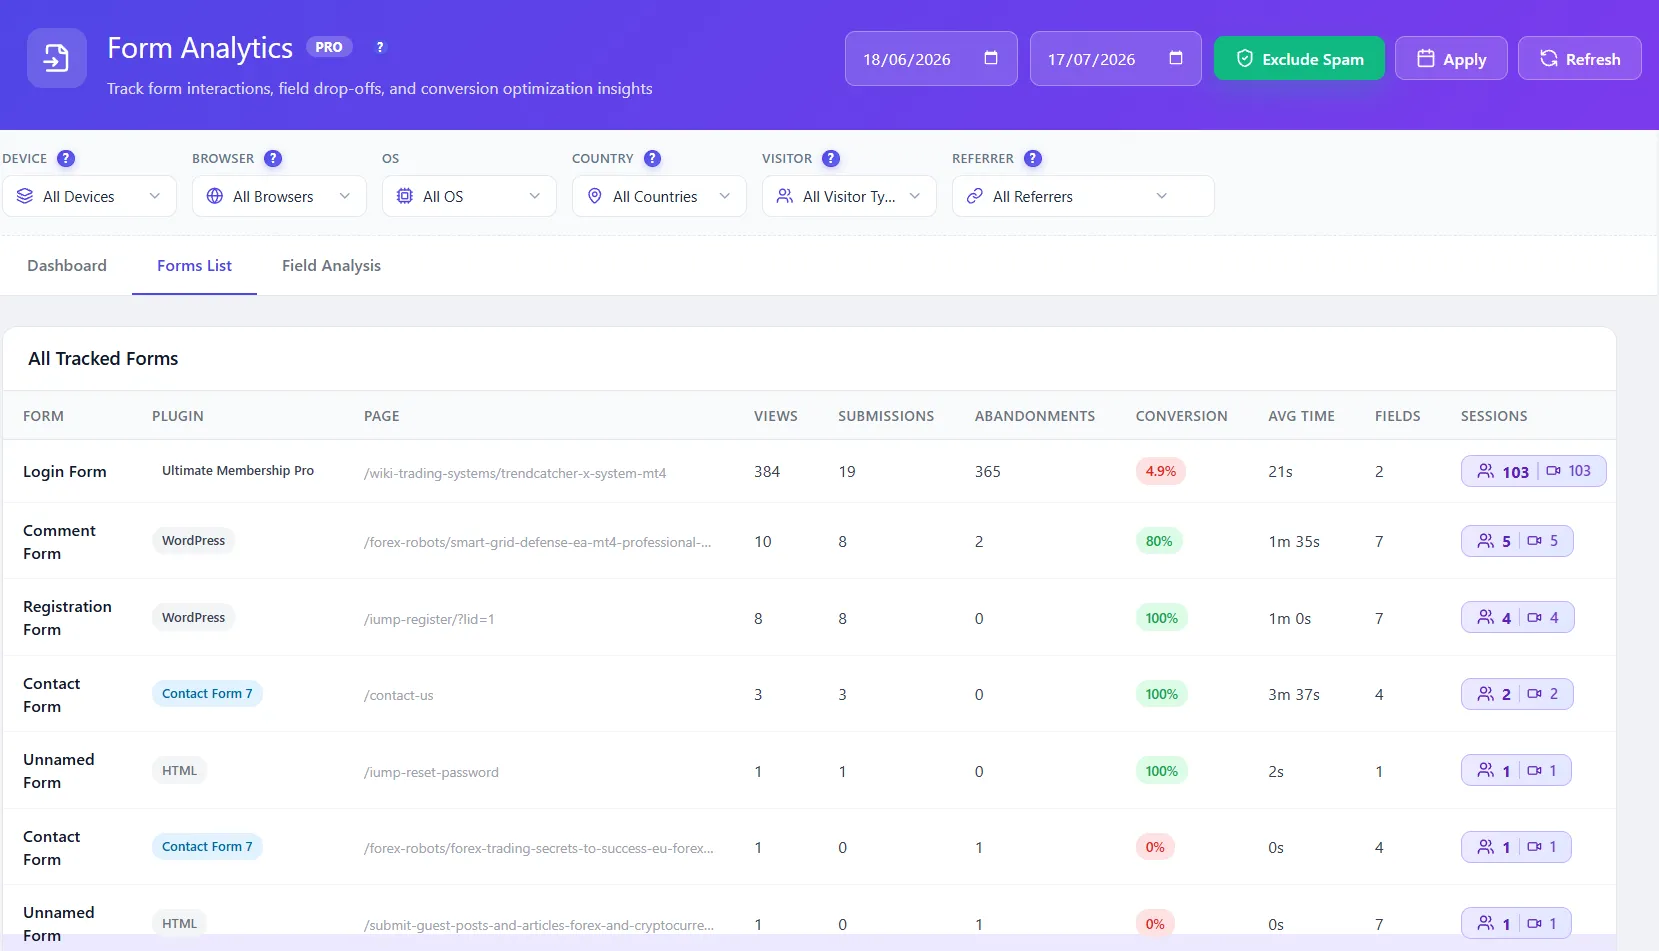
Recent Form Activity table shows every tracked form with Plugin, Page, Views, Submissions, Conversion Rate, Avg. Time, and Sessions. Click Sessions to watch every recording for that specific form.
FORMS LIST TAB All tracked forms
Form name Plugin auto-detected Page URL Views · Submissions Abandonments Conversion rate Avg. time · Fields Sessions link
Each form row links directly to its session recordings — watch exactly how visitors interacted with that form.
A plugin update at 9 am breaks “Add to cart” on mobile. Your customers notice. You don’t.
→
With Errors & Performance
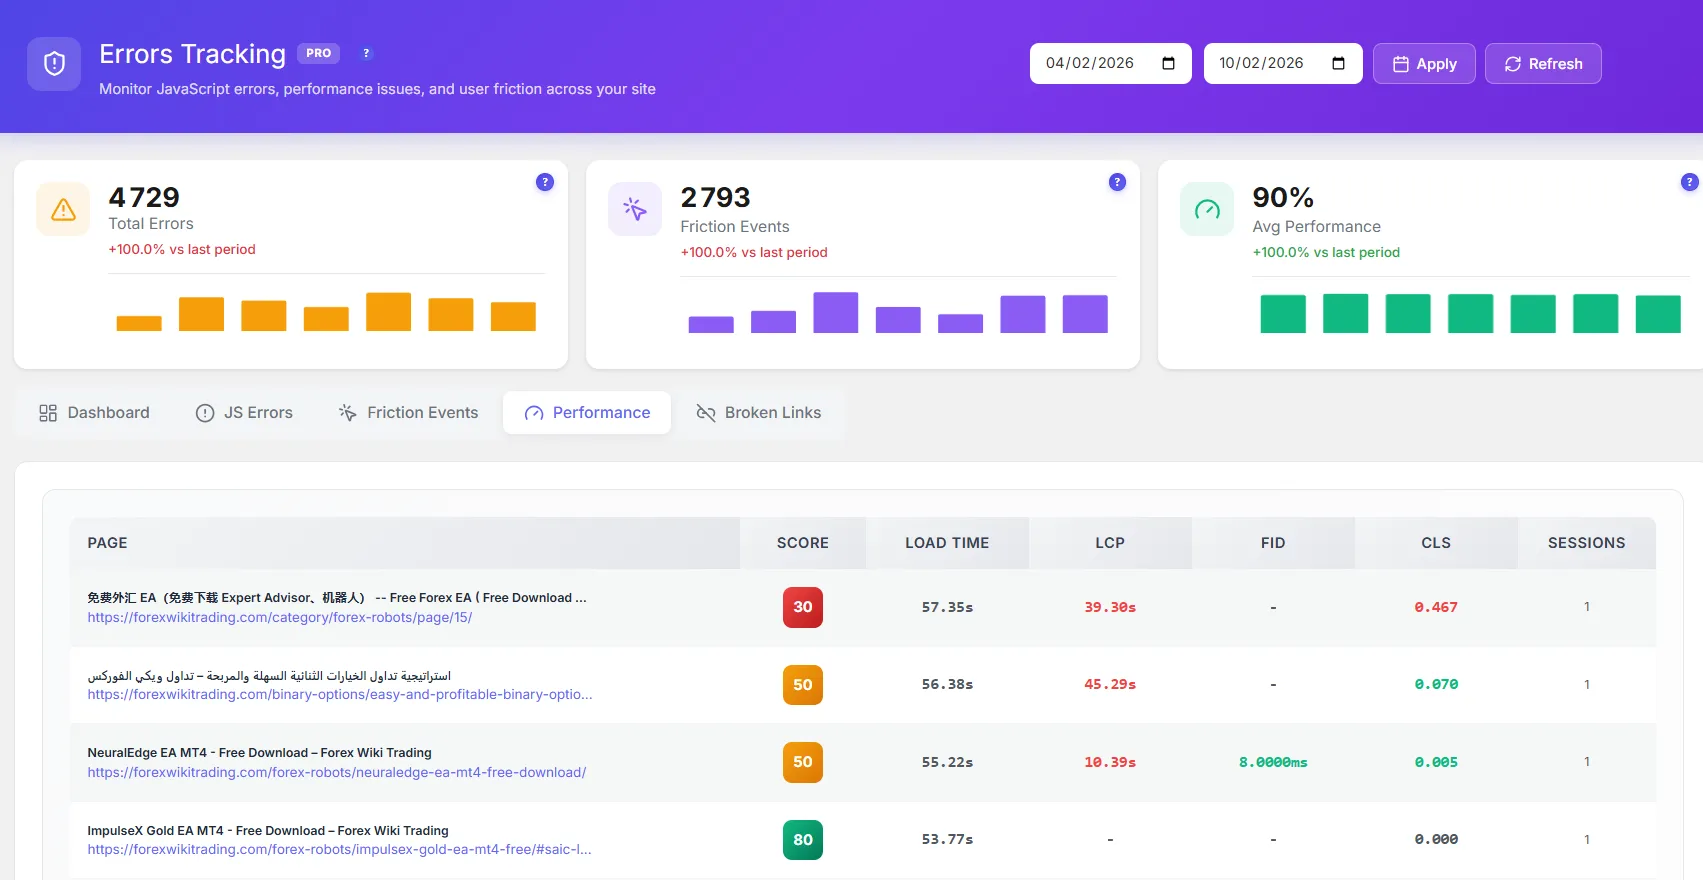
Caught the same hourJS errors, 404s and slow pages, tied to the page, device and session where they happened.
See what the visitor sawEvery error links to the recording of the session that hit it.
Core Web Vitals per pageLCP, CLS and INP from real visitors, not a lab score.
PRO6 Months Free
Errors & Performance Tracking
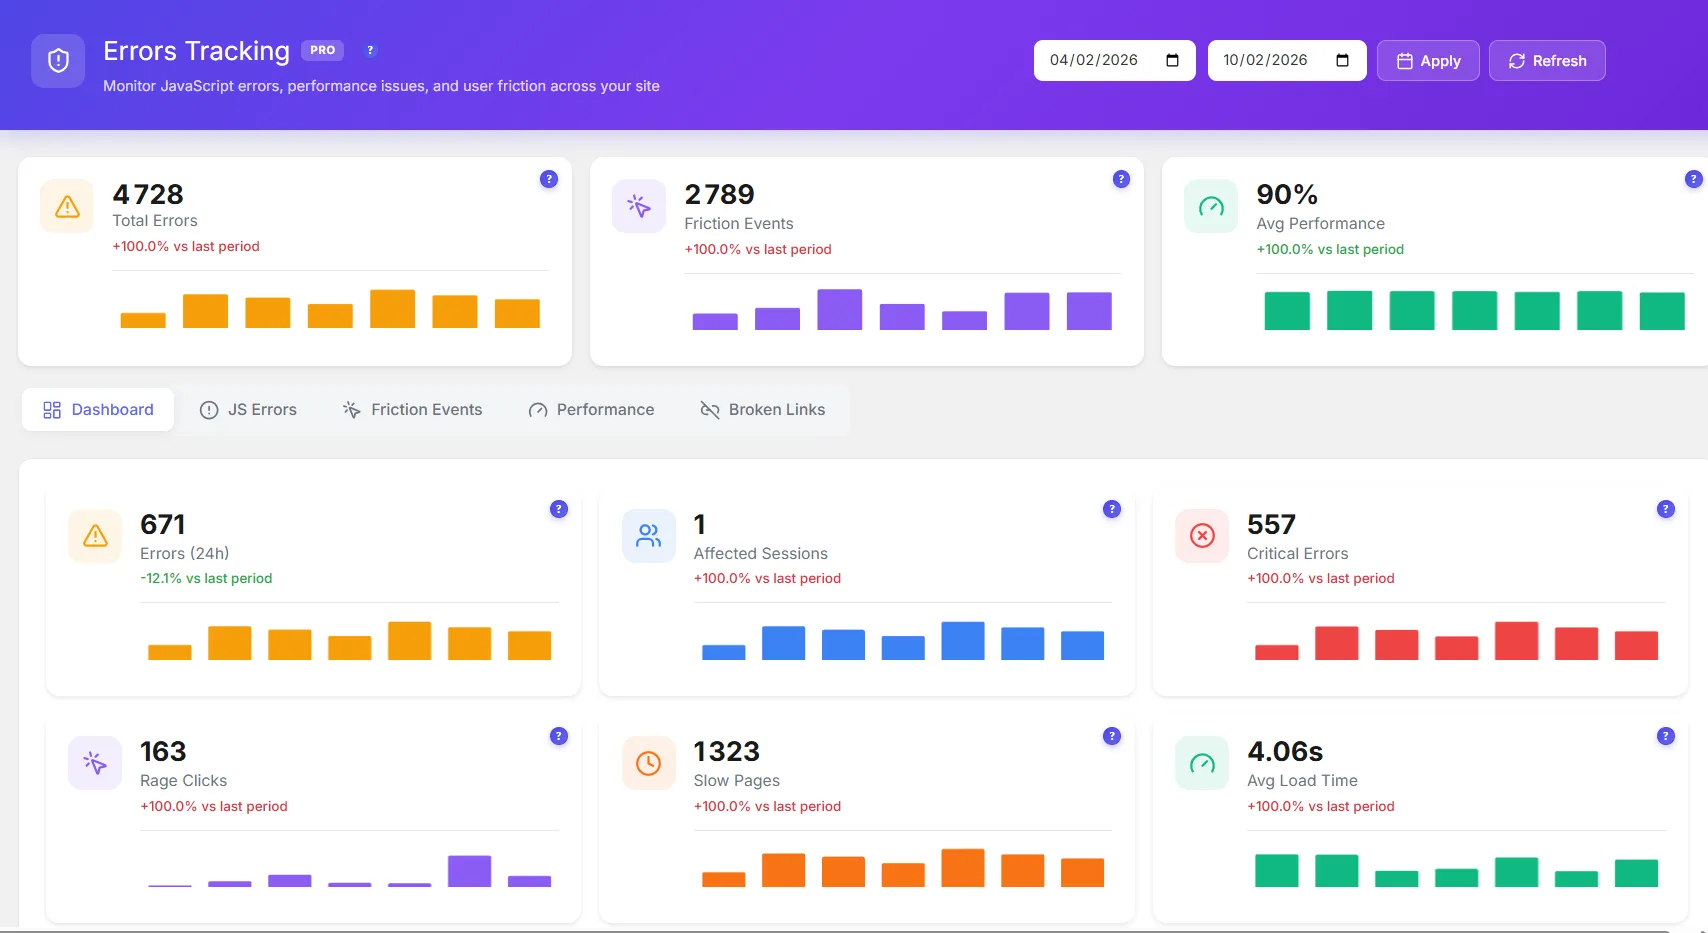
5 monitoring tools in one dashboard — JS Errors, Friction Events, Core Web Vitals, Performance Scoring, and Broken Link Detection. Know everything that breaks before your users do.
3 KPI cards with history bar chart and growth indicator — Total Errors, Friction Events, Avg. Performance
6 live dashboard widgets — Errors (24h), Affected Sessions, Critical Errors, Rage Clicks, Slow Pages, Avg. Load Time
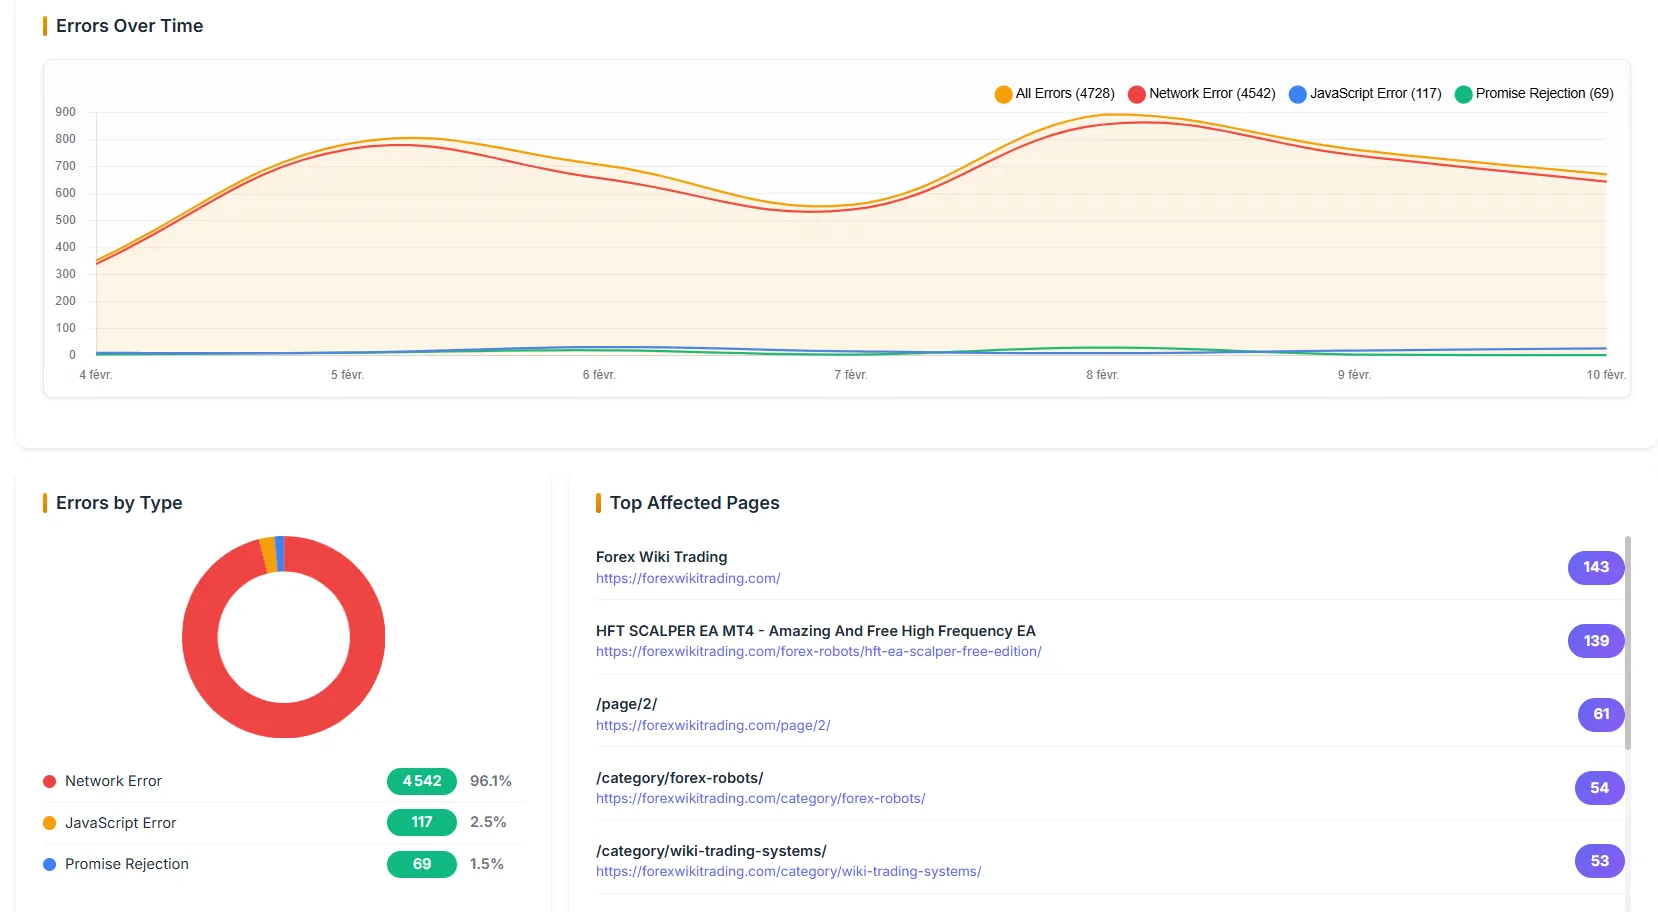
Errors over time chart — all errors visualized through time with type breakdown
Top affected pages — ranked by error count with severity and session impact
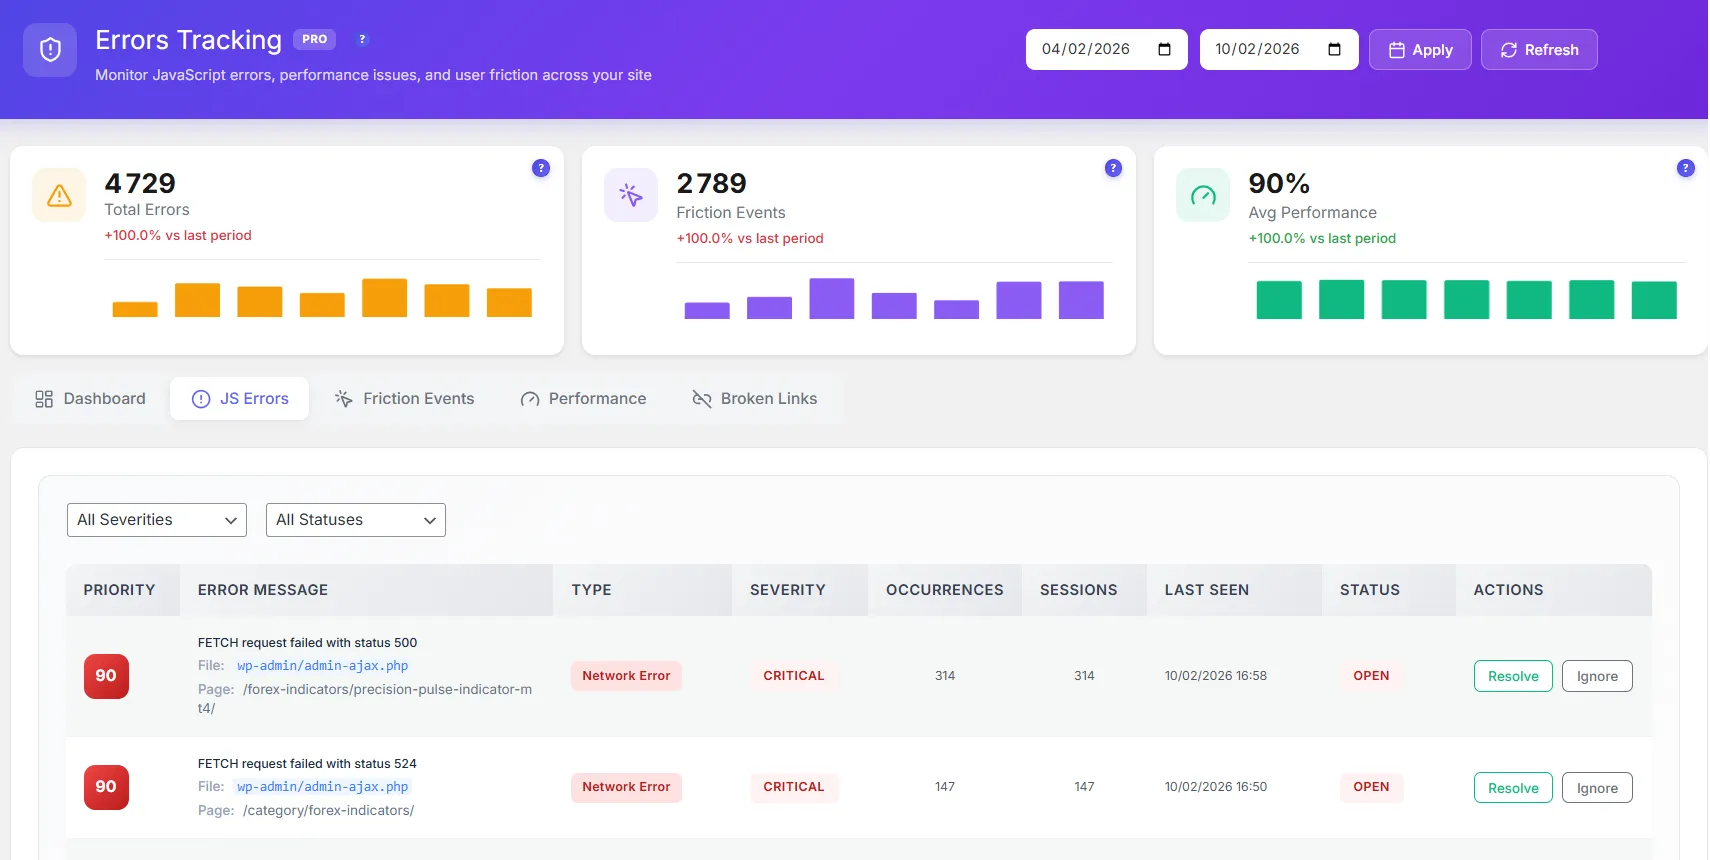
JavaScript error tracking with full stack traces — Priority, Message, Type, Severity, Occurrences, Sessions, Last Seen
Status workflow per error — Open → Investigating → Resolved
Performance score (0–100) per page with full table — Page, Score, Load Time, LCP, FID, CLS, Sessions
Broken link detection — auto-detects 404 and 500 errors with Source Page, HTTP Code, Count, Last Detected
Custom date range filter applies across all tabs simultaneously
ERROR TYPES AUTO-CLASSIFIED
JavaScript ErrorNetwork ErrorPromise RejectionRage ClickDead Click404 Not Found500 Server ErrorSlow Page
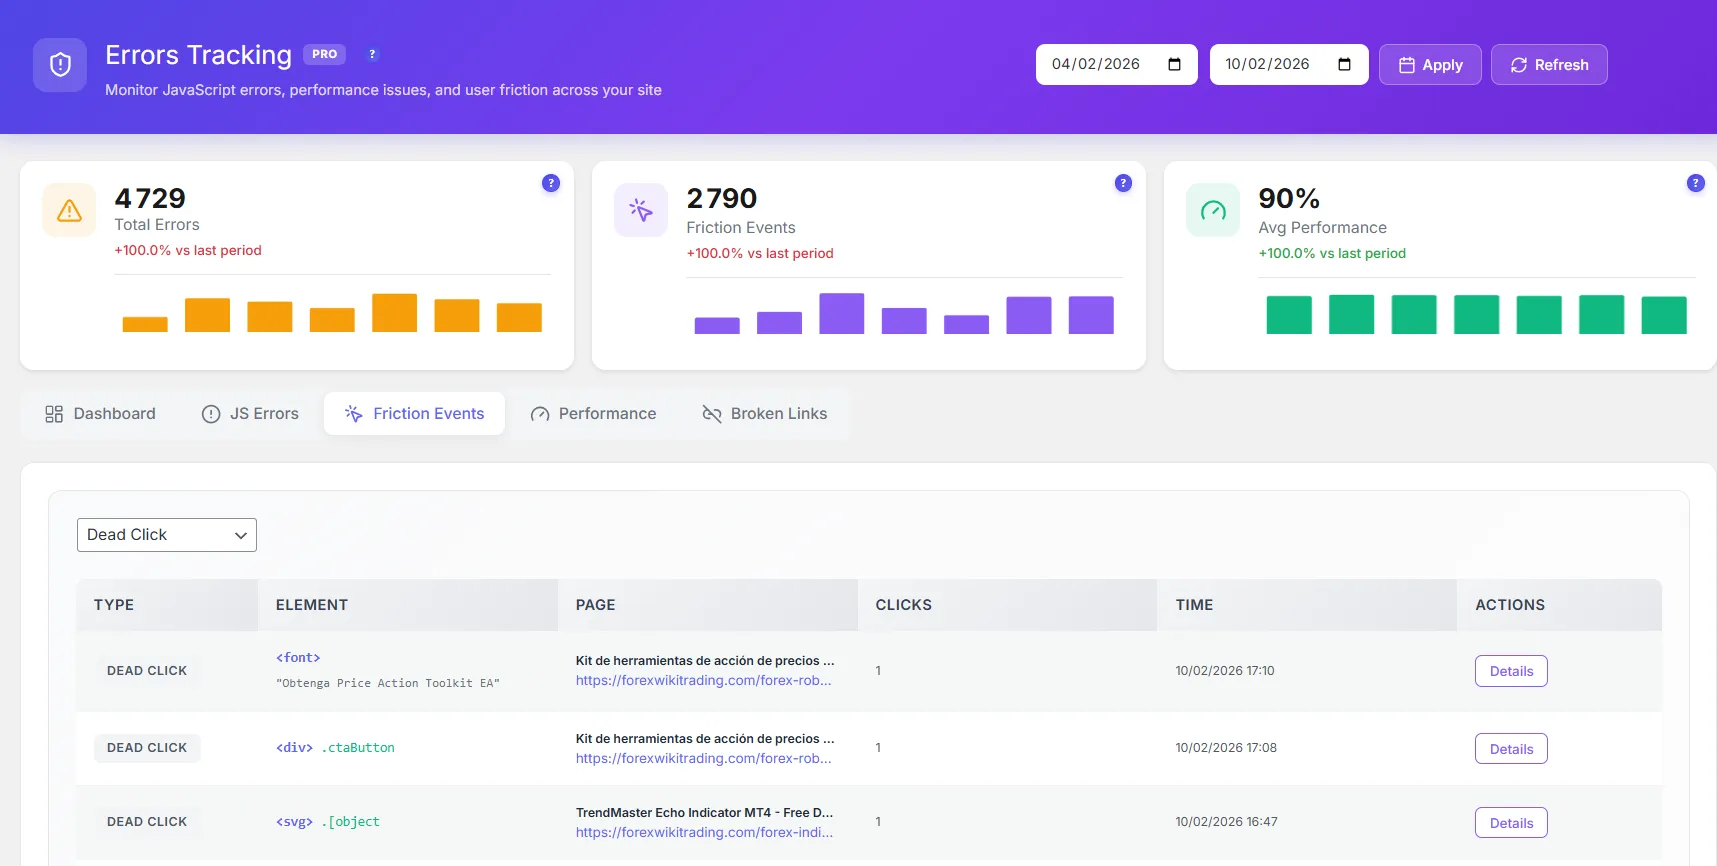
Rage clicks Dead clicks Element detected Page source Click count Timestamp
Every friction event links directly to the affected session recording — watch exactly what frustrated your visitor.
CORE WEB VITALS Per page
LCP — Largest Contentful Paint FID — First Input Delay CLS — Cumulative Layout Shift INP — Interaction to Next Paint TTFB — Time to First Byte FCP — First Contentful Paint
Impacts your Google ranking. Know which pages are dragging your SEO score down and fix them first.
Where do visitors actually go? Half of the home-page traffic goes nowhere. The cart fills from product and pricing — and 39% still leave before paying.
→
With User Journeys
See the loopsPaths, backtracks and exits per session — the pattern nobody reports.
Friction score per pagePages ranked by how often visitors bounce back from them.
Broken links, foundDead ends and 404s discovered from real journeys, not a crawler.
PRO6 Months Free
User Journey Analytics
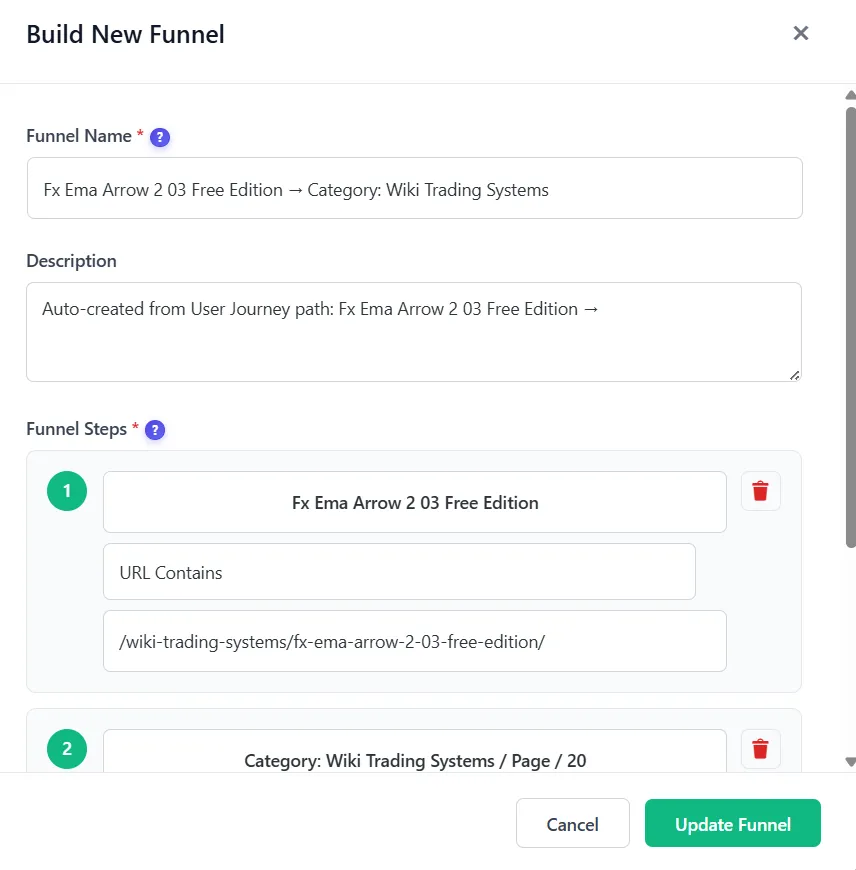
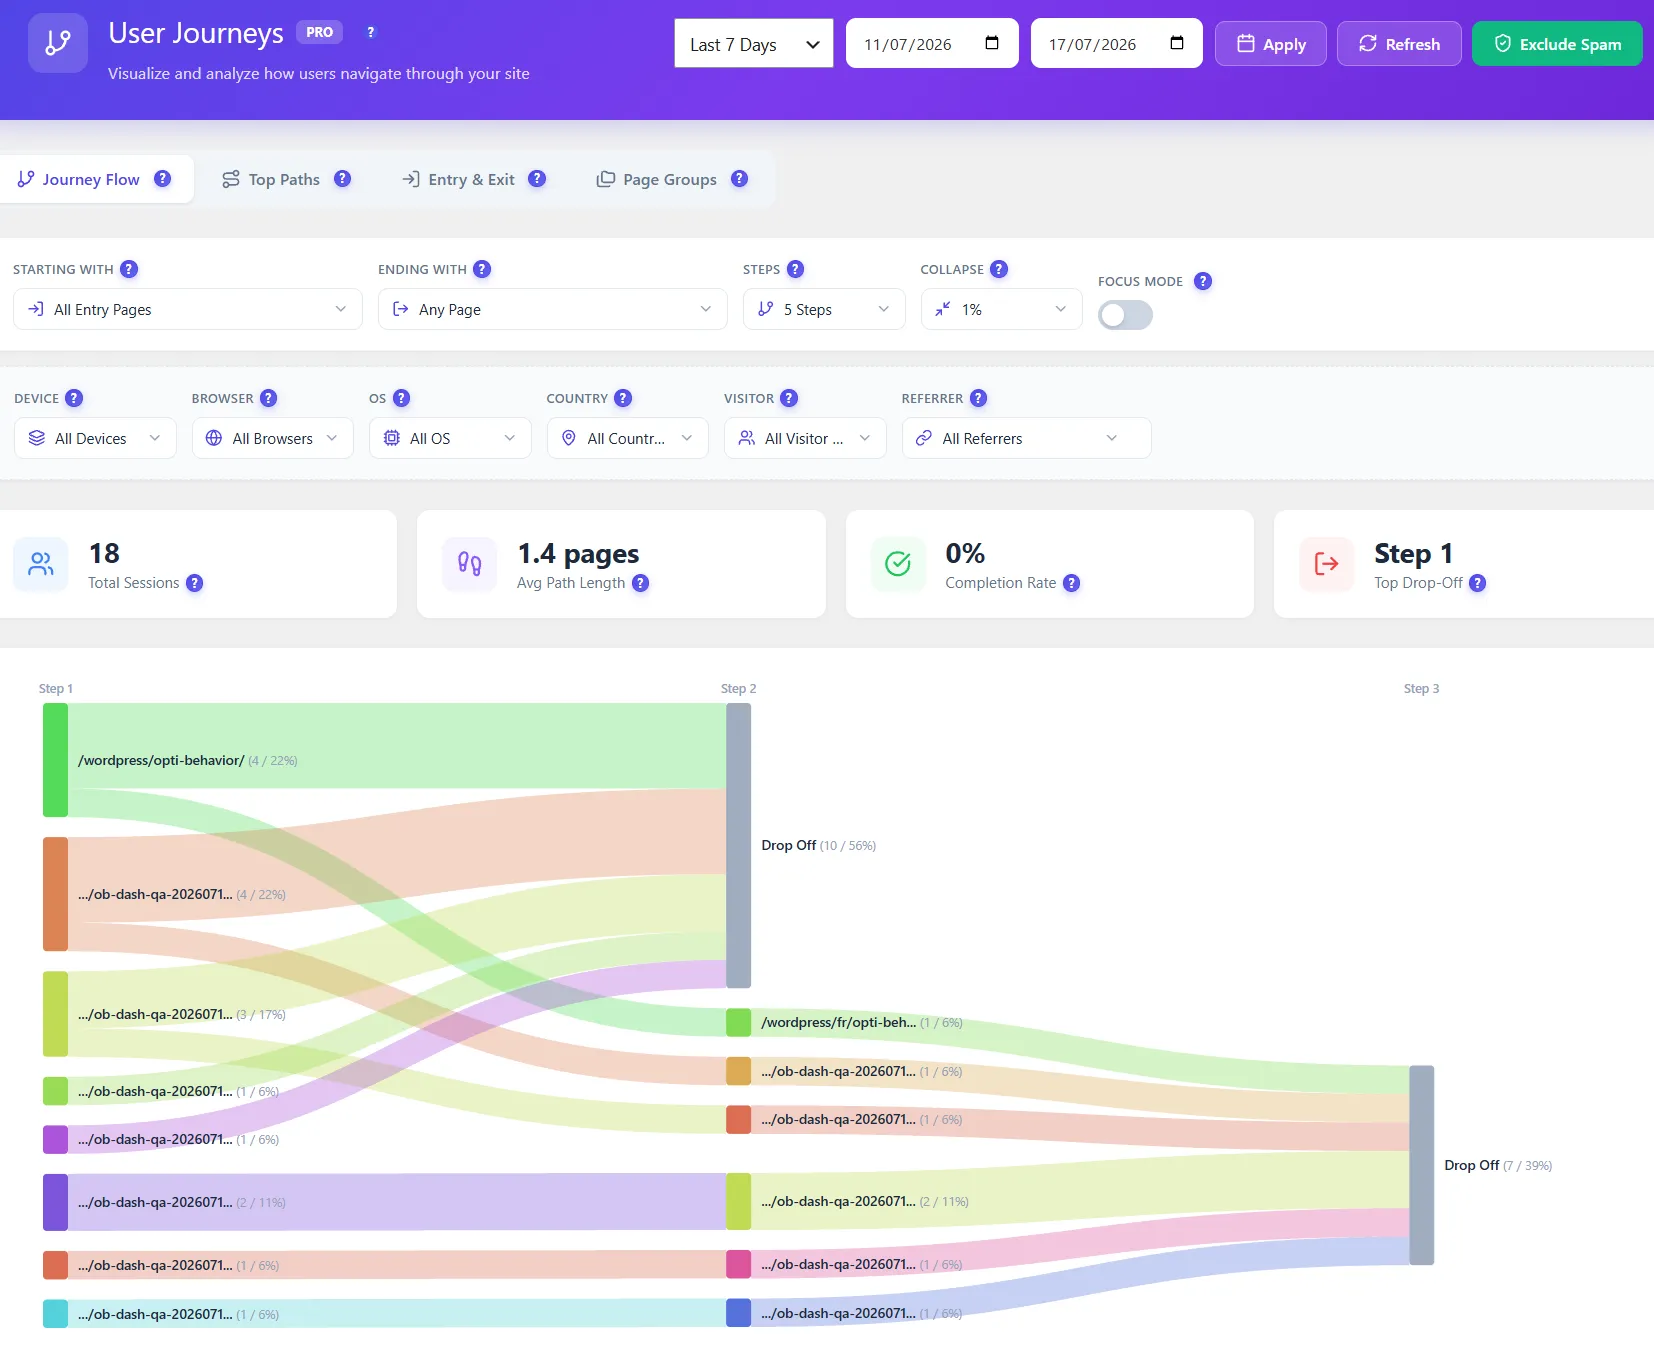
Visualize how users navigate your site with Sankey flow diagrams. Discover top paths, analyze entry and exit pages, group similar URLs, and convert any discovered path into a funnel in one click.
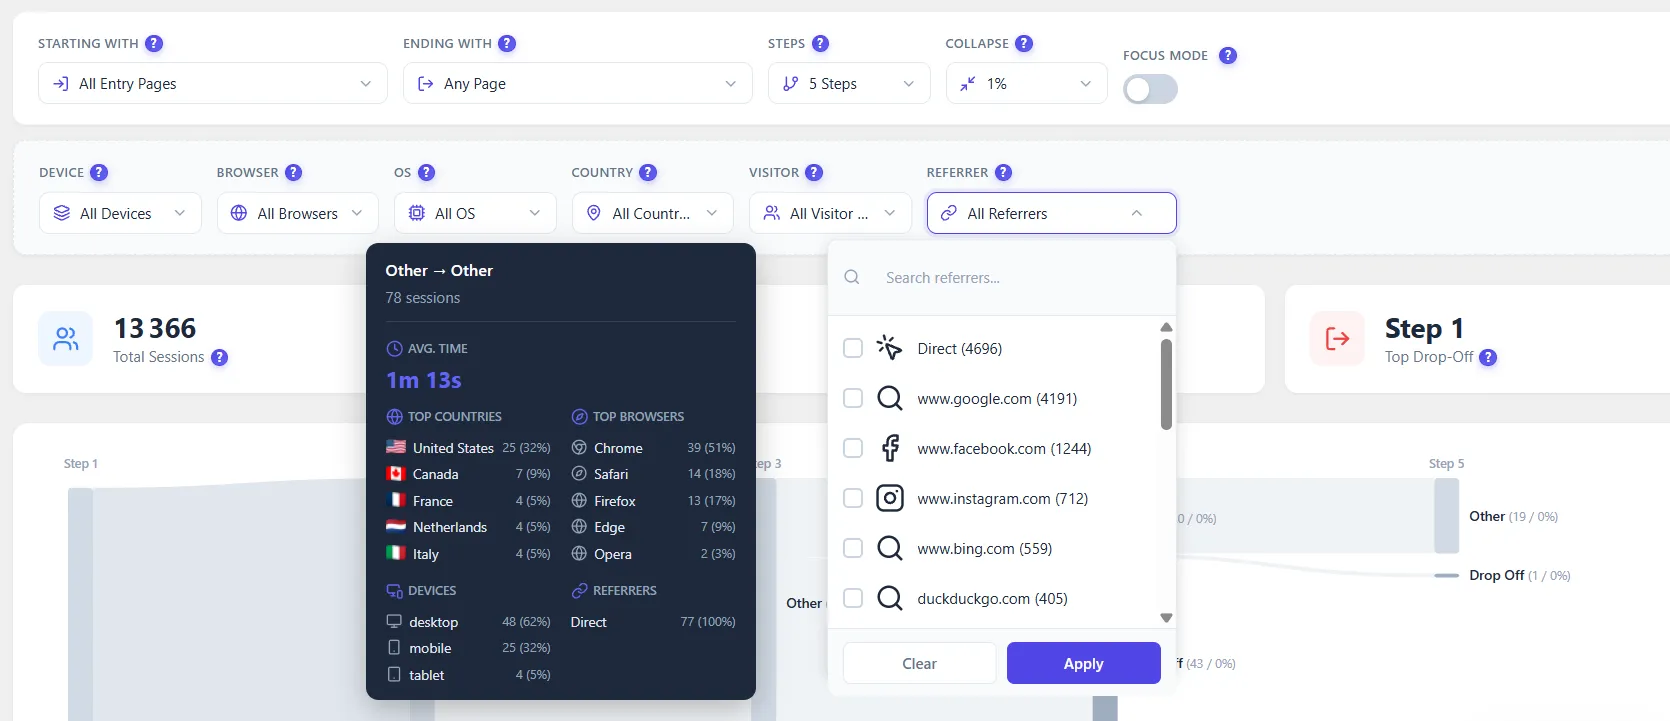
Sankey flow diagram — visual map of how users move through your site step by step
3 to 7 step path analysis — control the depth of the journey you want to visualize
One-click funnel creation — convert any discovered path into a conversion funnel instantly
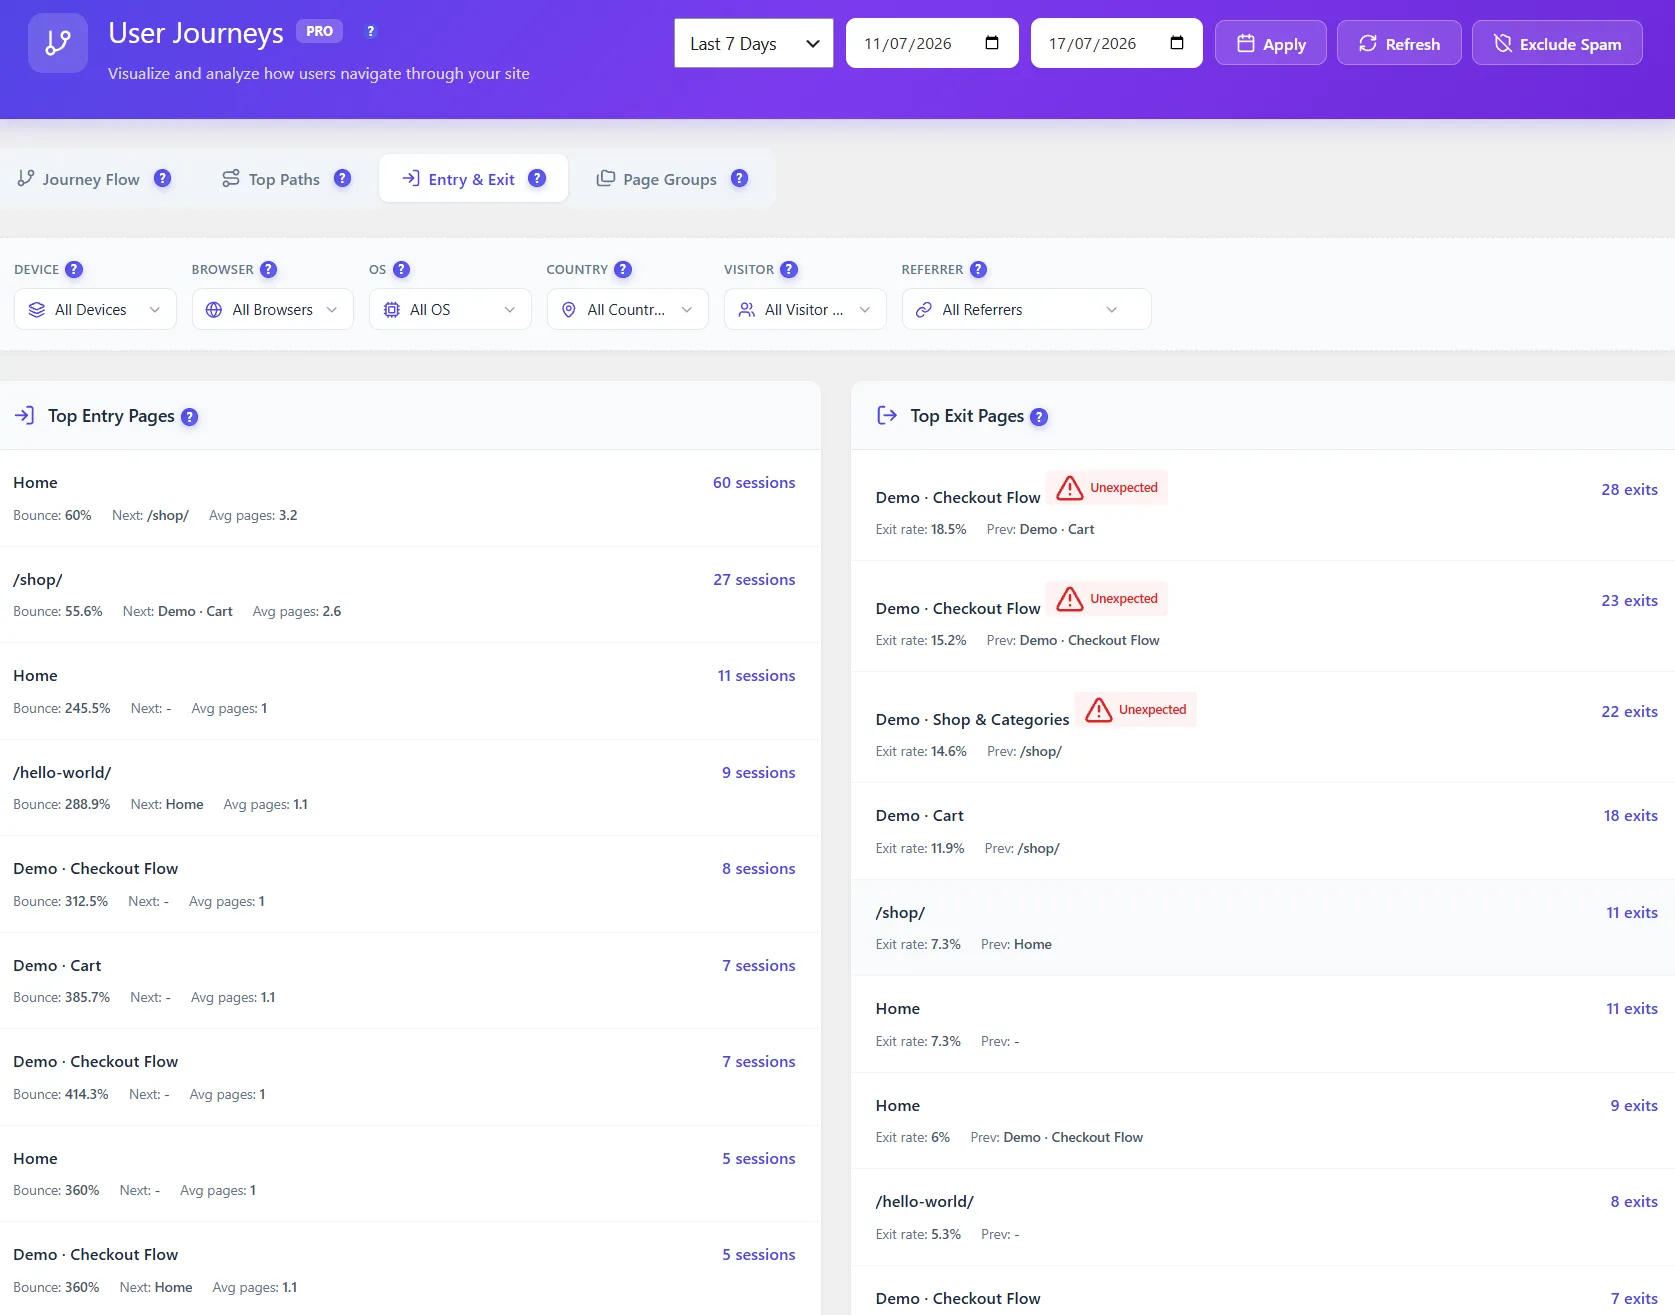
Entry & Exit page analysis — bounce rates, avg pages visited, and next destination per entry page
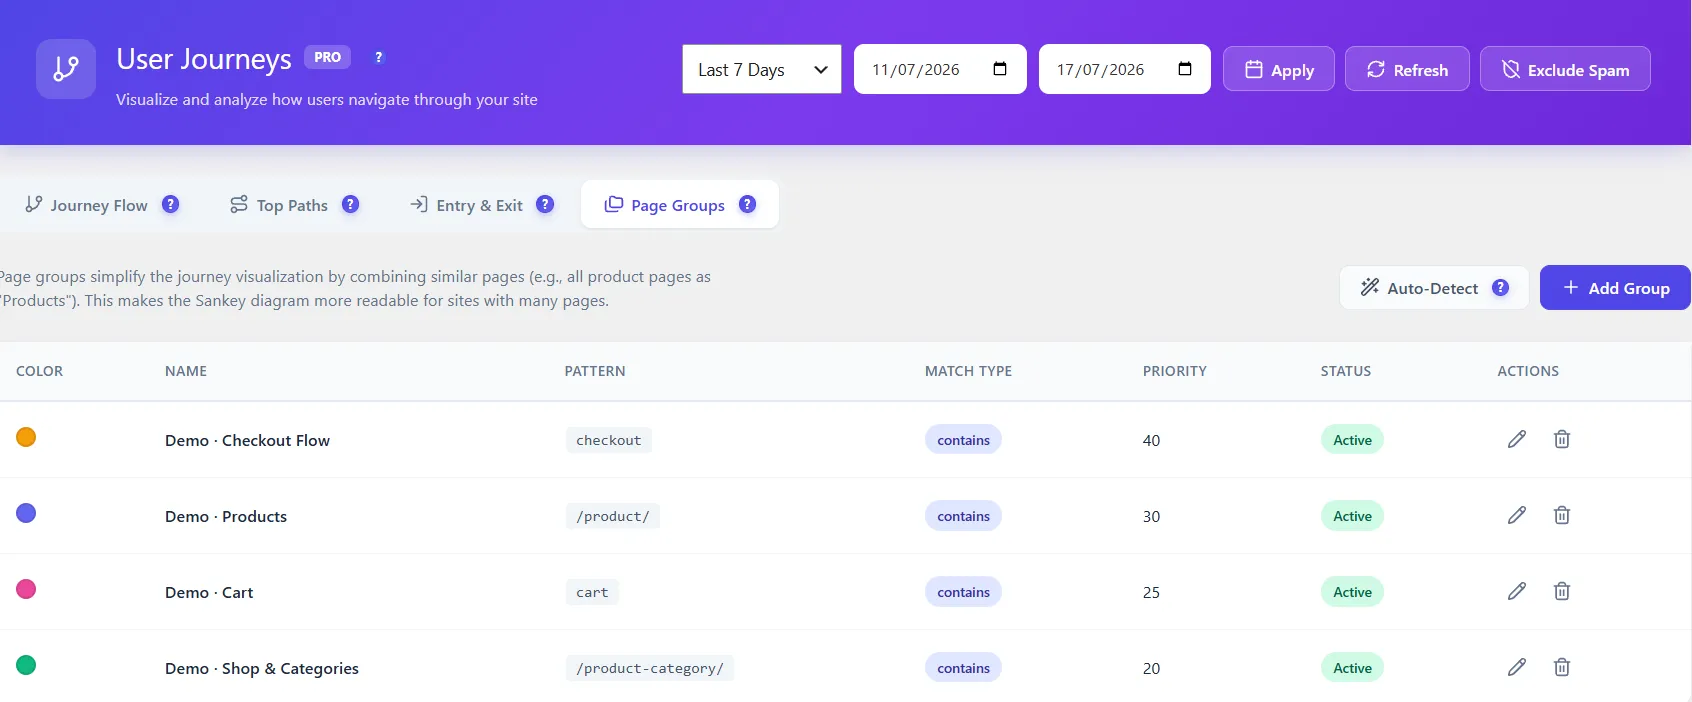
Page Groups — combine similar URLs into named groups to simplify the Sankey diagram
Auto-detect page groups — Opti-Behavior suggests logical groupings based on your URL structure
JOURNEY FLOW TAB Sankey diagram
Total matching sessions Avg. pages per session Flow completion rate % Top drop-off page
4 KPI cards always visible above the Sankey diagram. The drop-off page is automatically highlighted — focus your optimization there first.
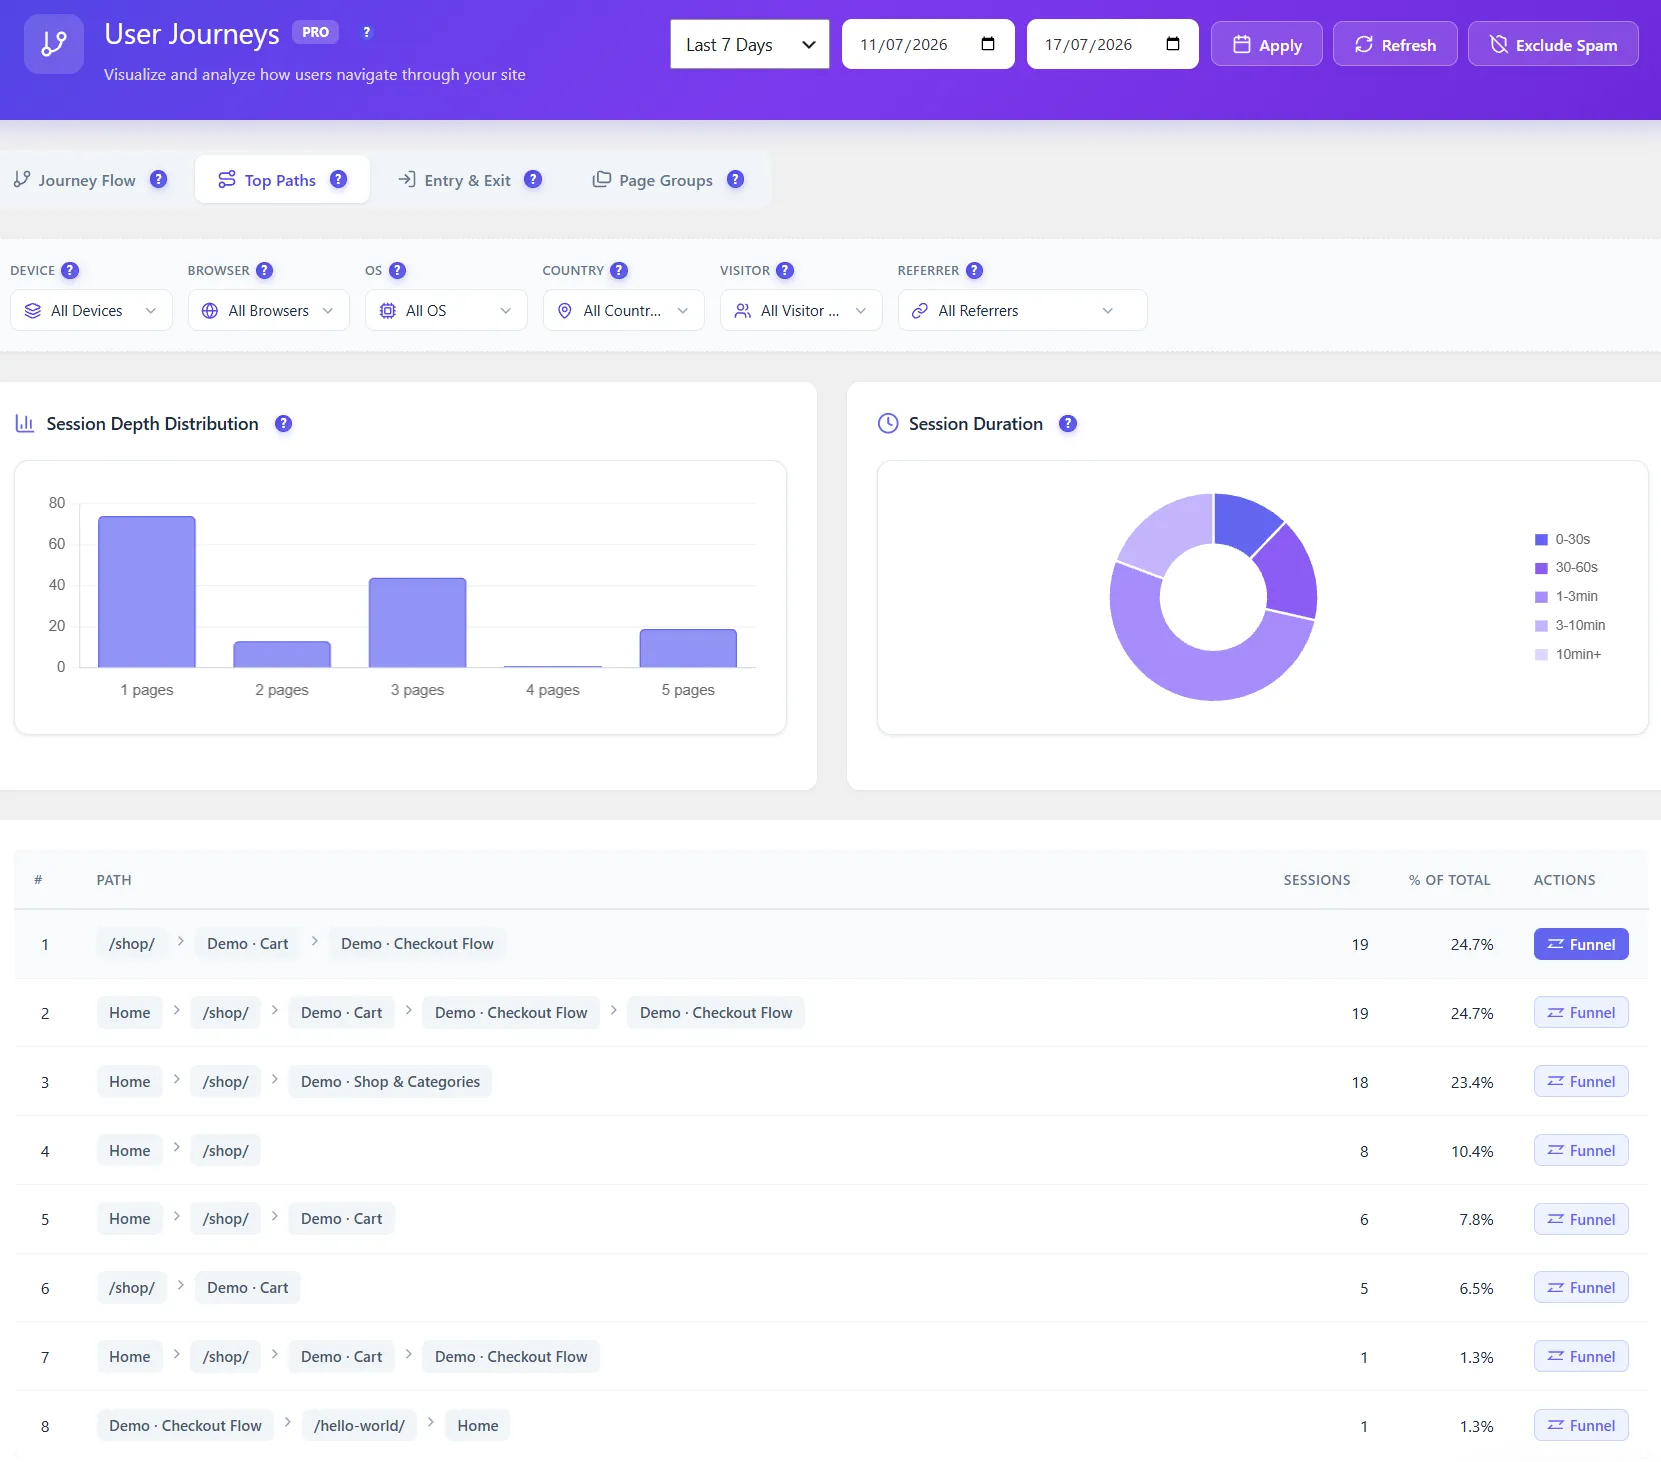
TOP PATHS TAB Path discovery
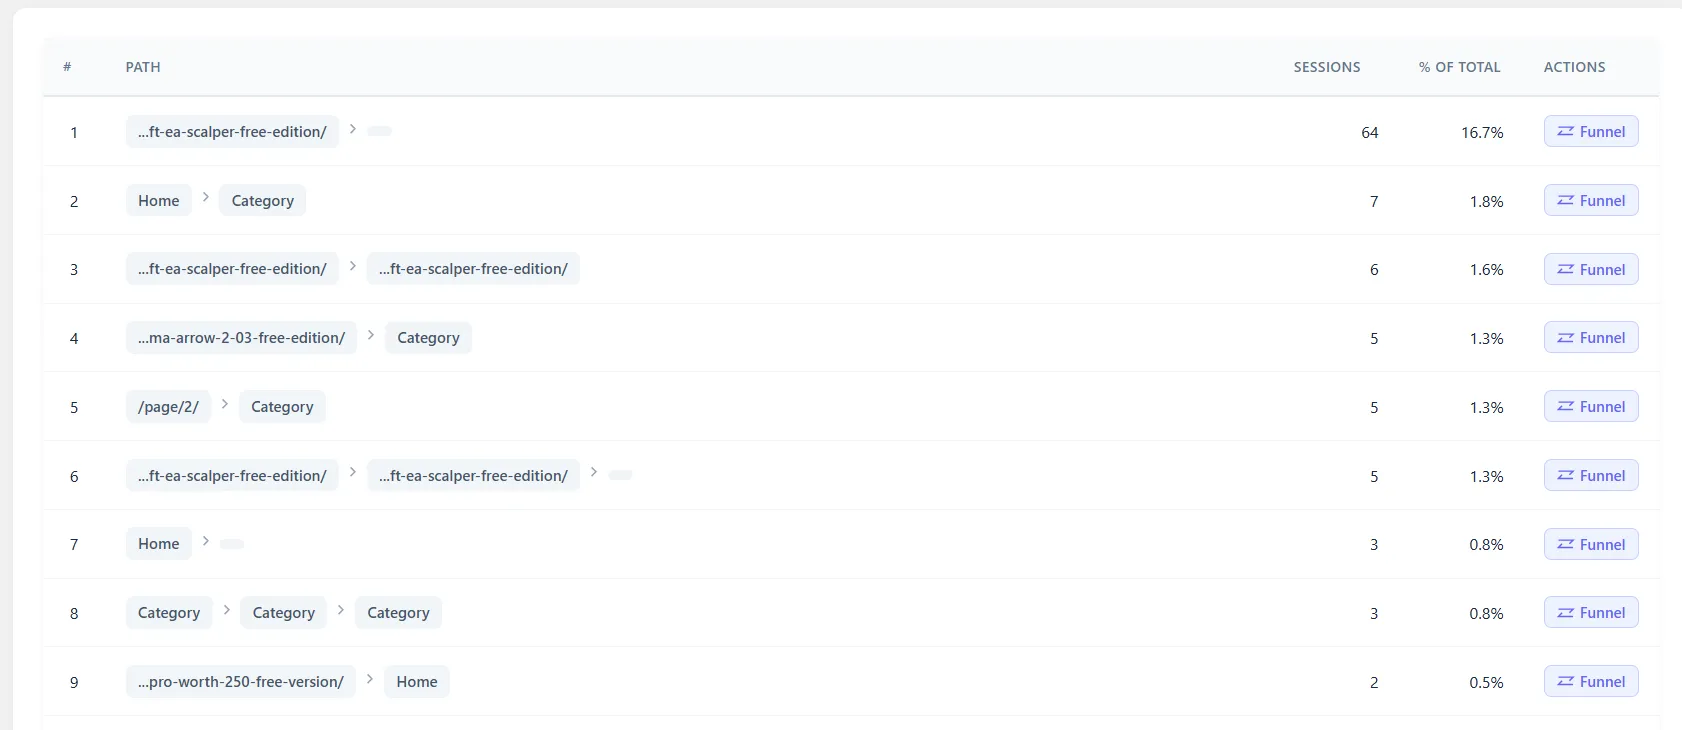
Session depth histogram Session duration histogram Path — sessions count % of total traffic
Every discovered path shows session count, percentage of total traffic, and a direct button to convert it into a funnel — no manual setup needed.
ADVANCED FILTERS All tabs
Custom date range Entry page Exit page Steps count Device type Browser Operating system Country New vs returning Referrer source
Top Entry Pages Top Exit Pages Sessions per page Bounce rate % Avg. pages after entry Exit rate %
PAGE GROUPS TAB Auto-detect available
Combine similar pages into named groups to make the Sankey diagram readable for large sites. Each group has a color, name, URL pattern, match type, priority, and status.
Color labelGroup nameURL patternMatch typePriority orderActive / InactiveAuto-detect groups
Traffic triples at 4 pm. From where? By the time the daily report arrives, the wave is gone.
→
With Real-time Analytics
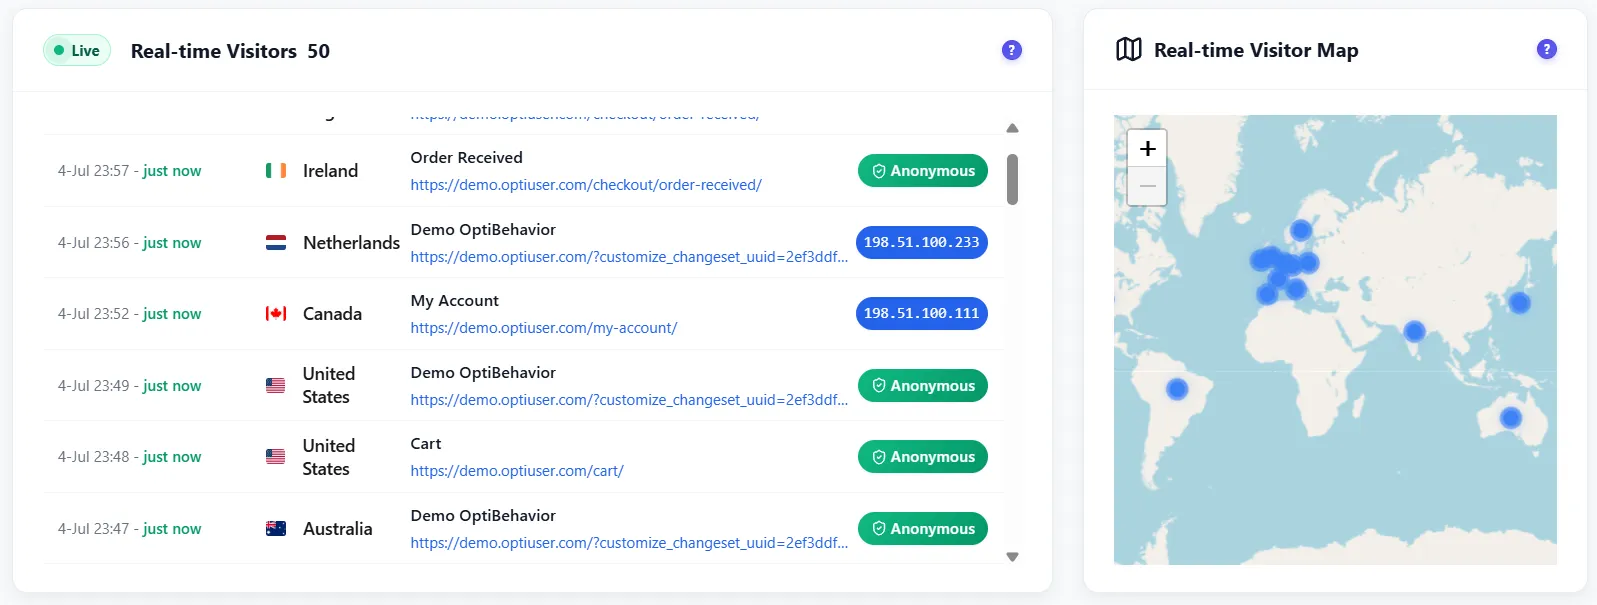
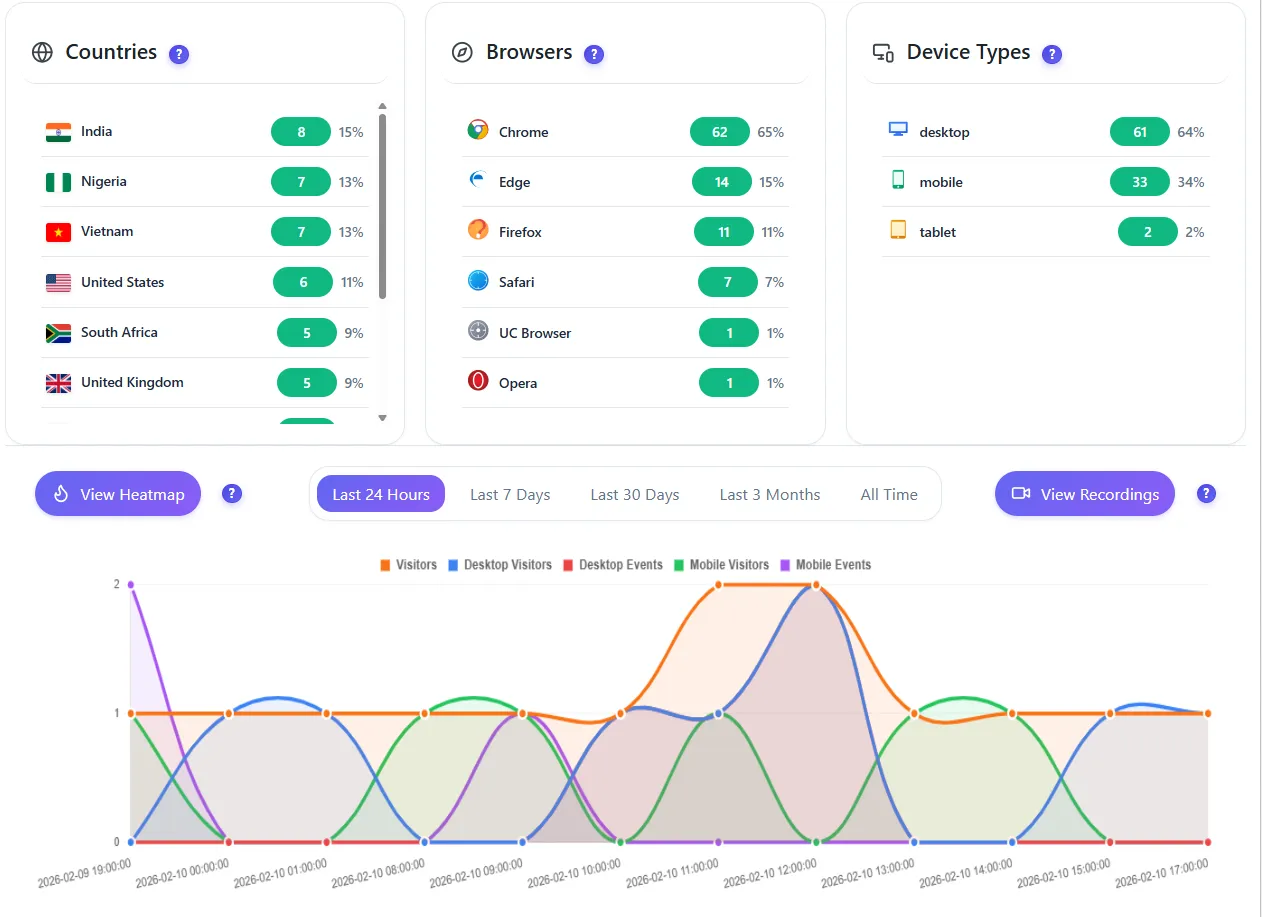
Live, on your serverVisitors, pages, sources and countries, updated as they happen.
Spam and bots removed15+ patterns filtered out, so a spike is a real spike.
Act while it lastsFix the landing page, add the missing CTA, catch the wave today.
FREE
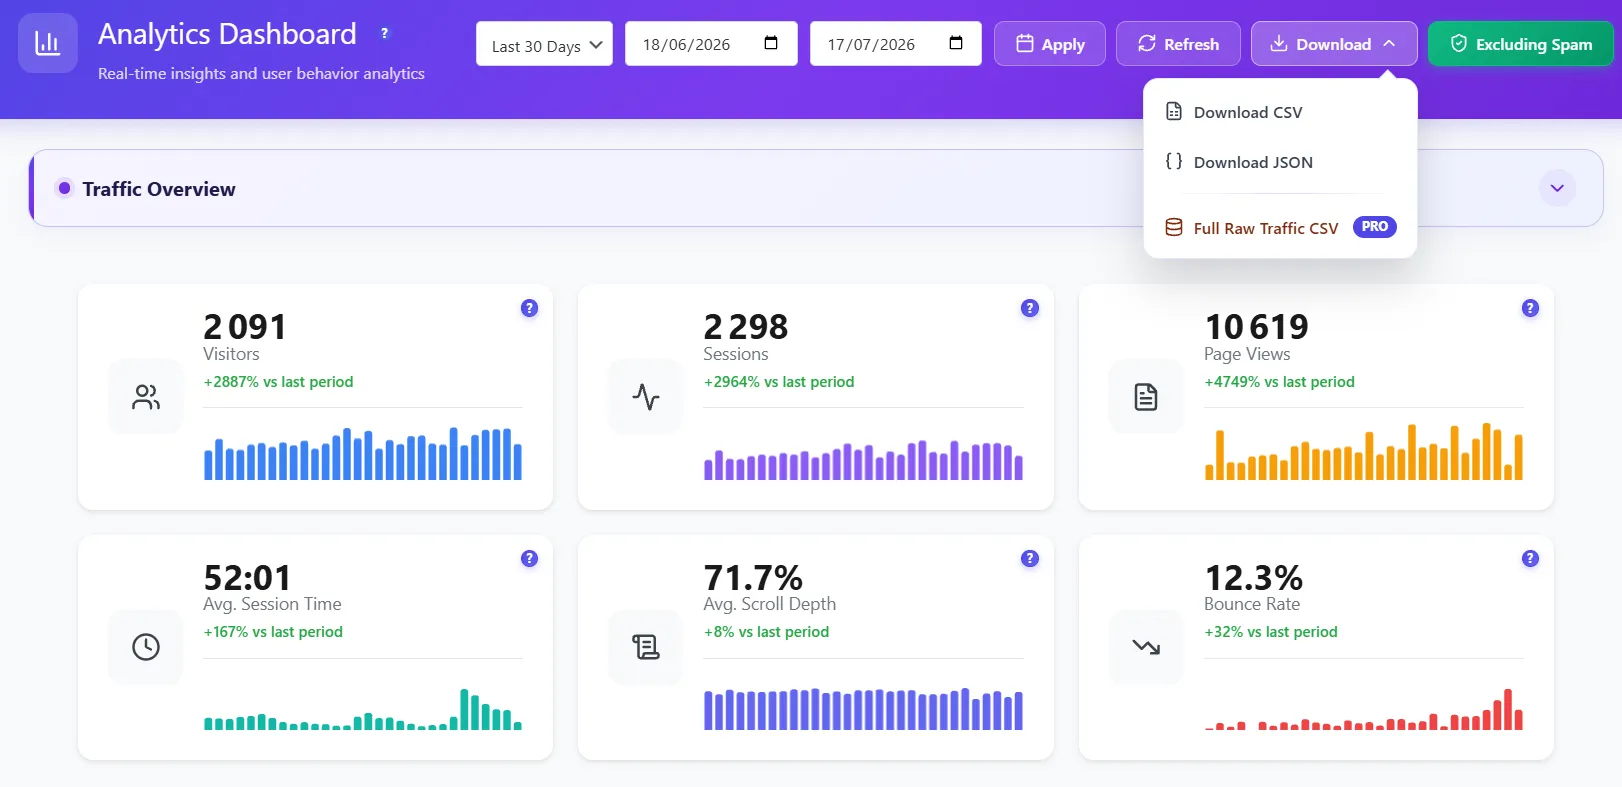
Real-Time Analytics Dashboard
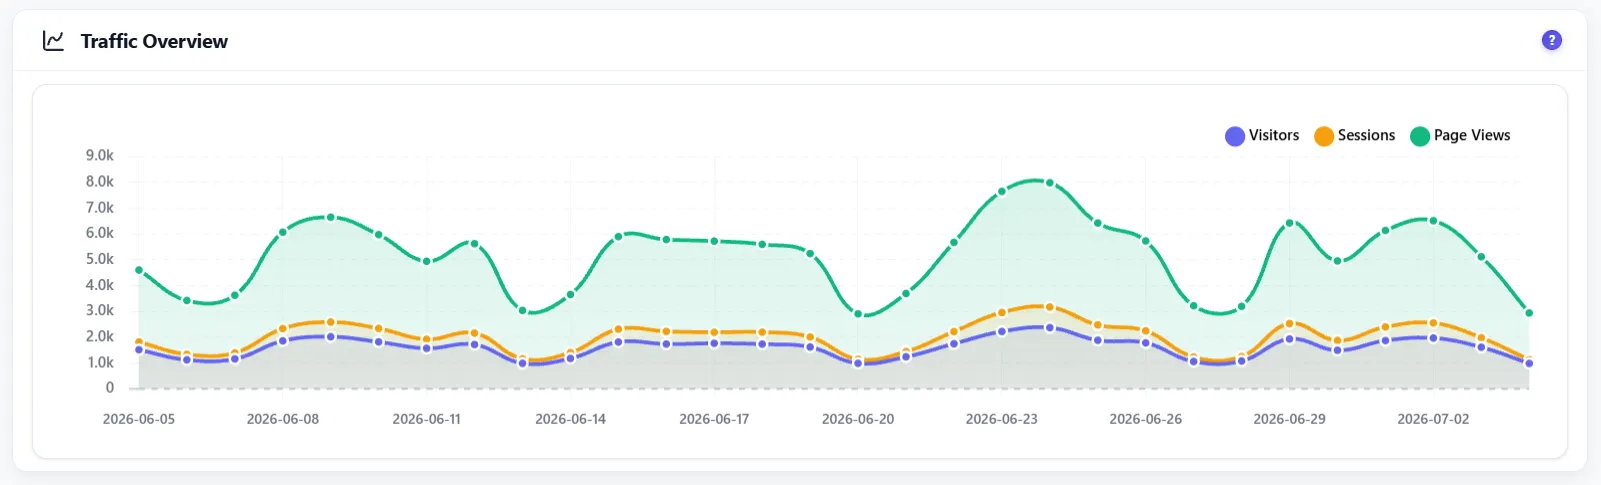
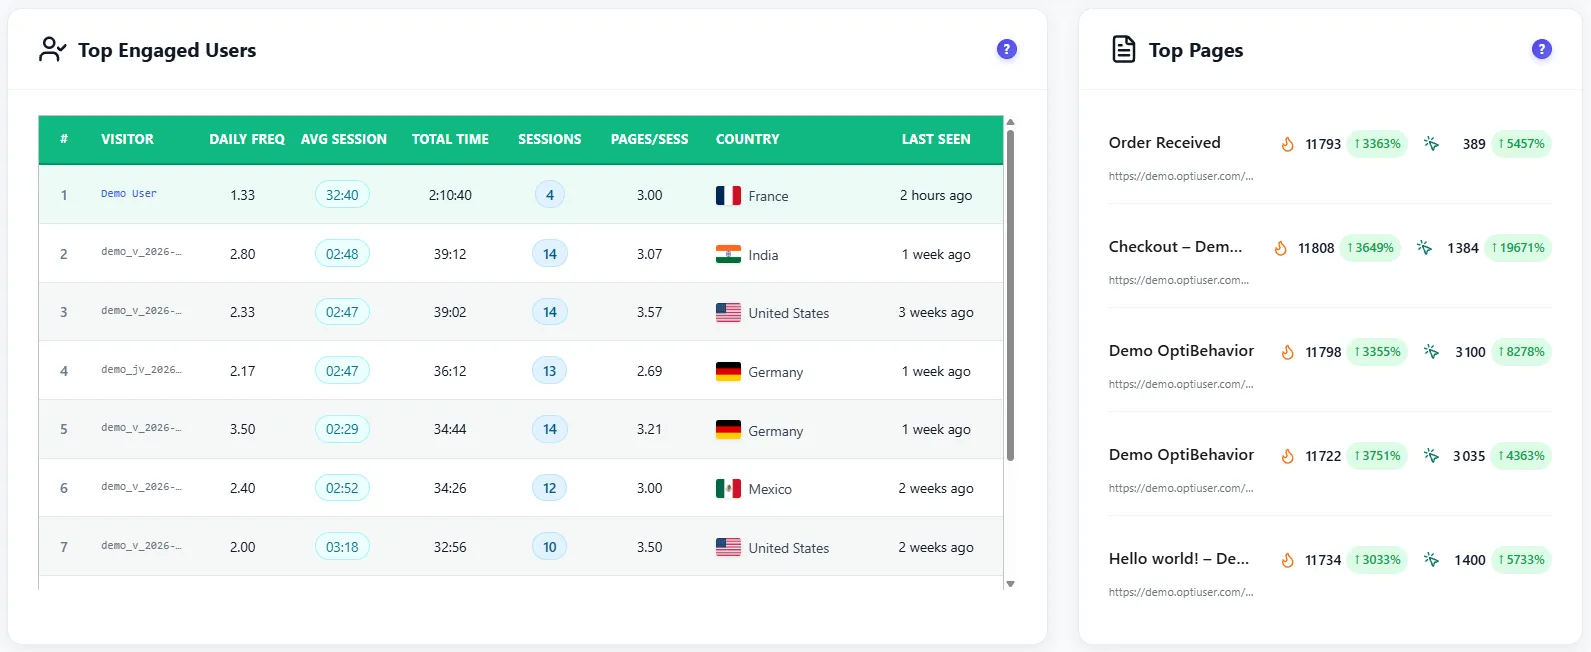
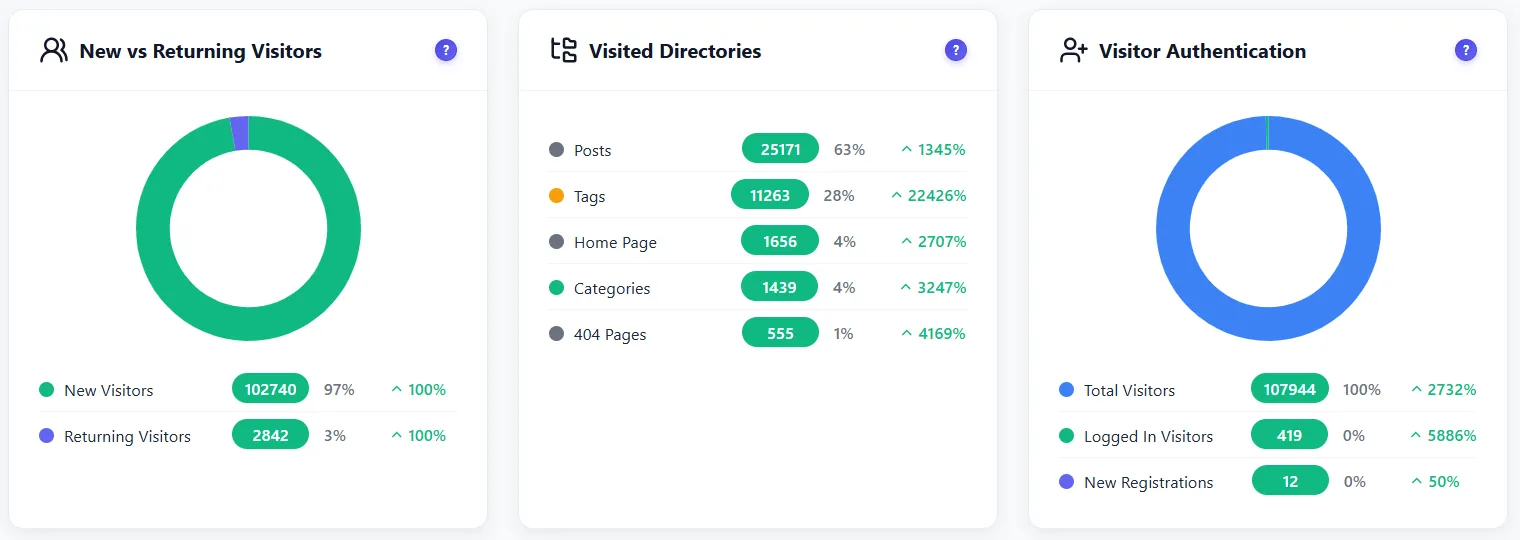
16 intelligent widgets — all updating live on YOUR server. Every visit, click, and session analyzed in real-time. Spam and bot traffic auto-excluded from every report. Visitor behavior data never leaves your server.
LIVE TRACKING
Real-time visitors + world map6 KPI cards with bar history
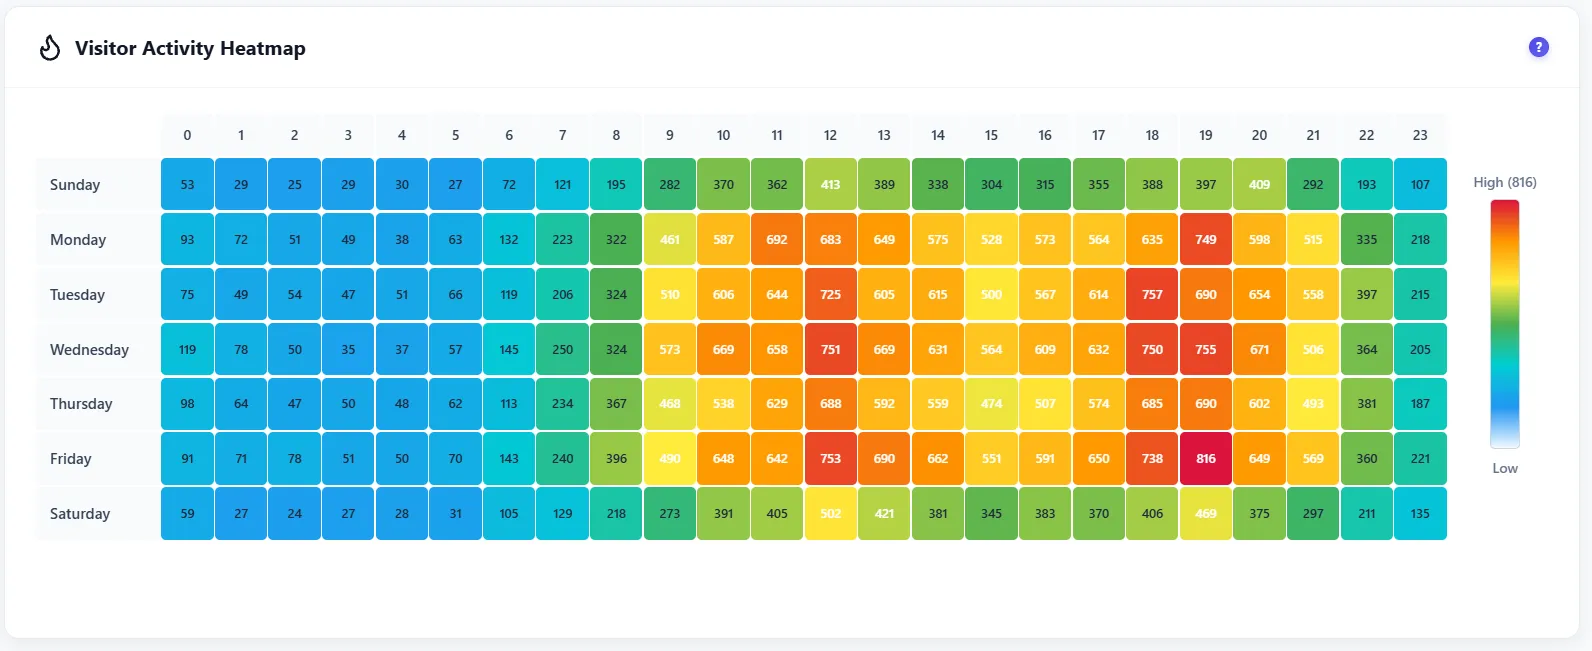
New vs returning carries the problemTime of day carries the problemDevice worth watching
Business impact
0 visitors lost vs your site average
Priority
0/100
Confidence High · Status New
Next action
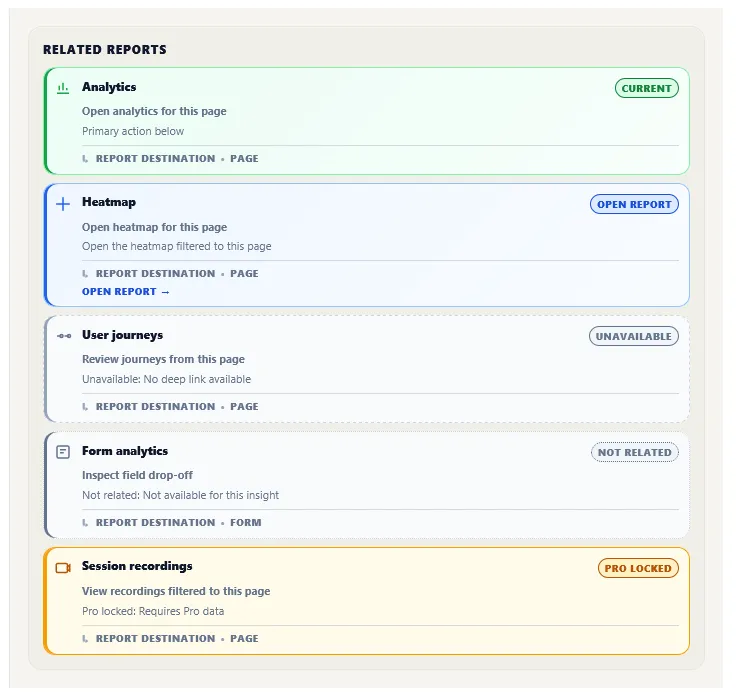
Open recordings filtered to this page and review the first failed interactions.
View recordings filtered to this page
EvidenceRecordings 6JourneysHeatmapErrors 39%
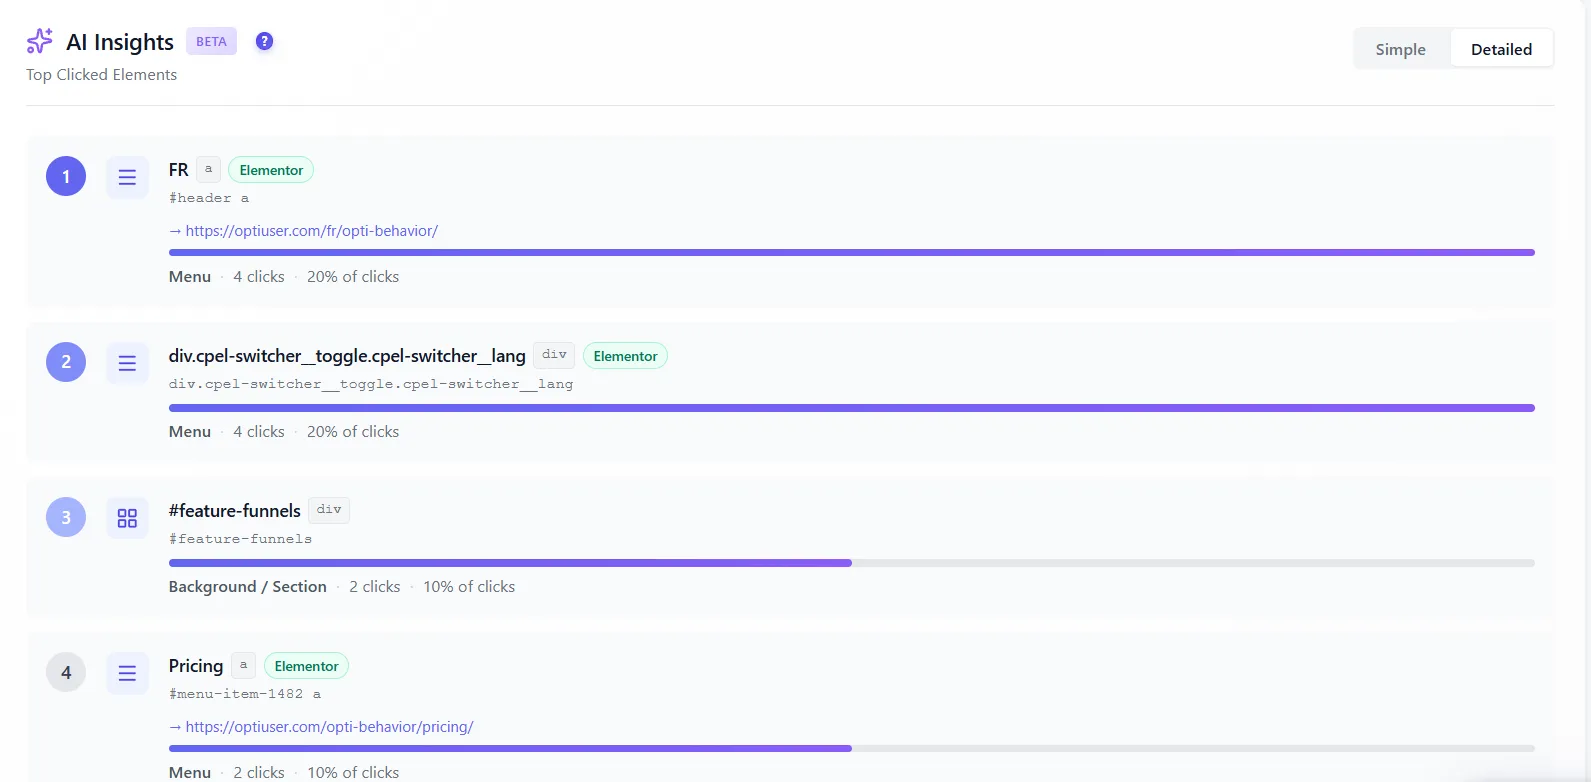
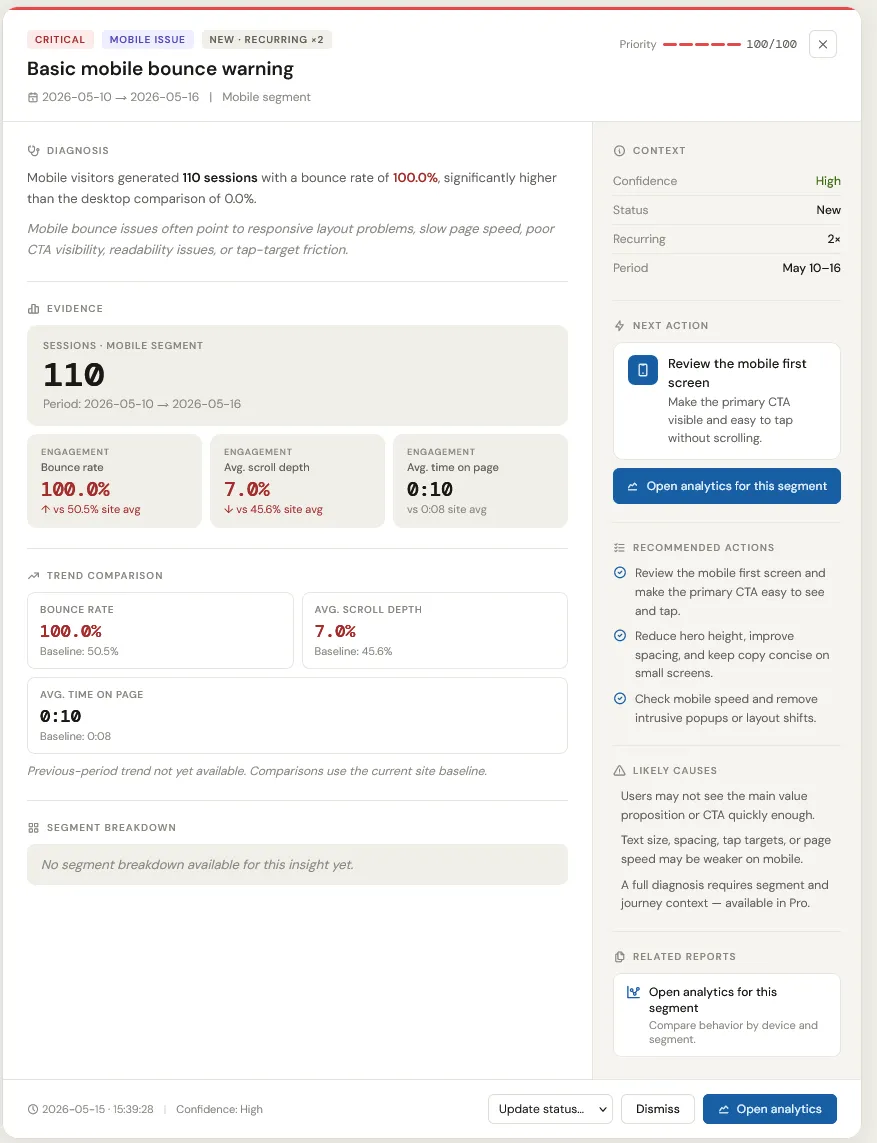
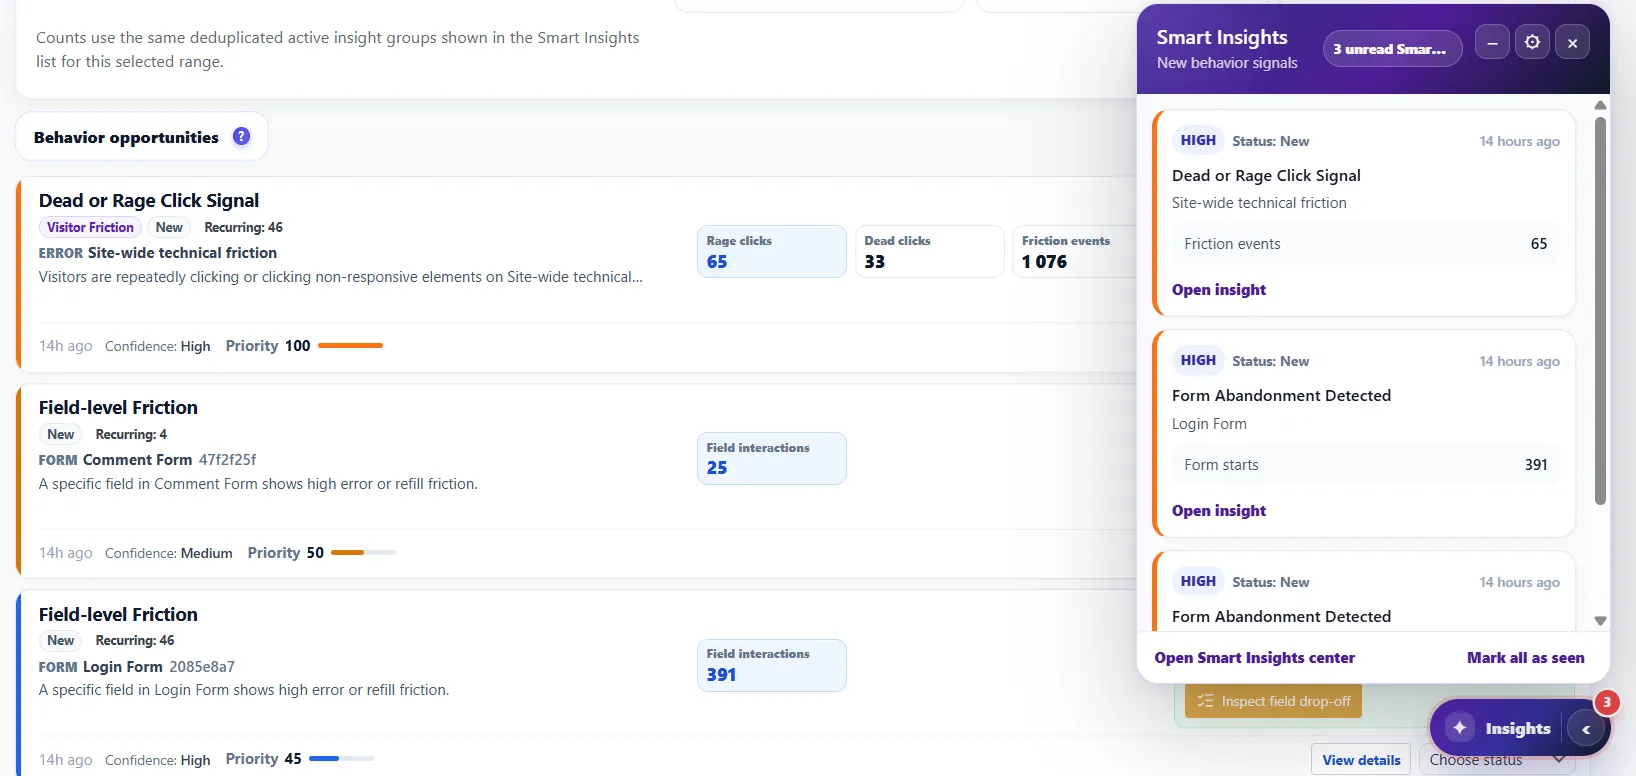
Not a list of twenty problems. One insight: what broke, for whom, what it costs, and the exact report to open next.
→
With Smart Insights
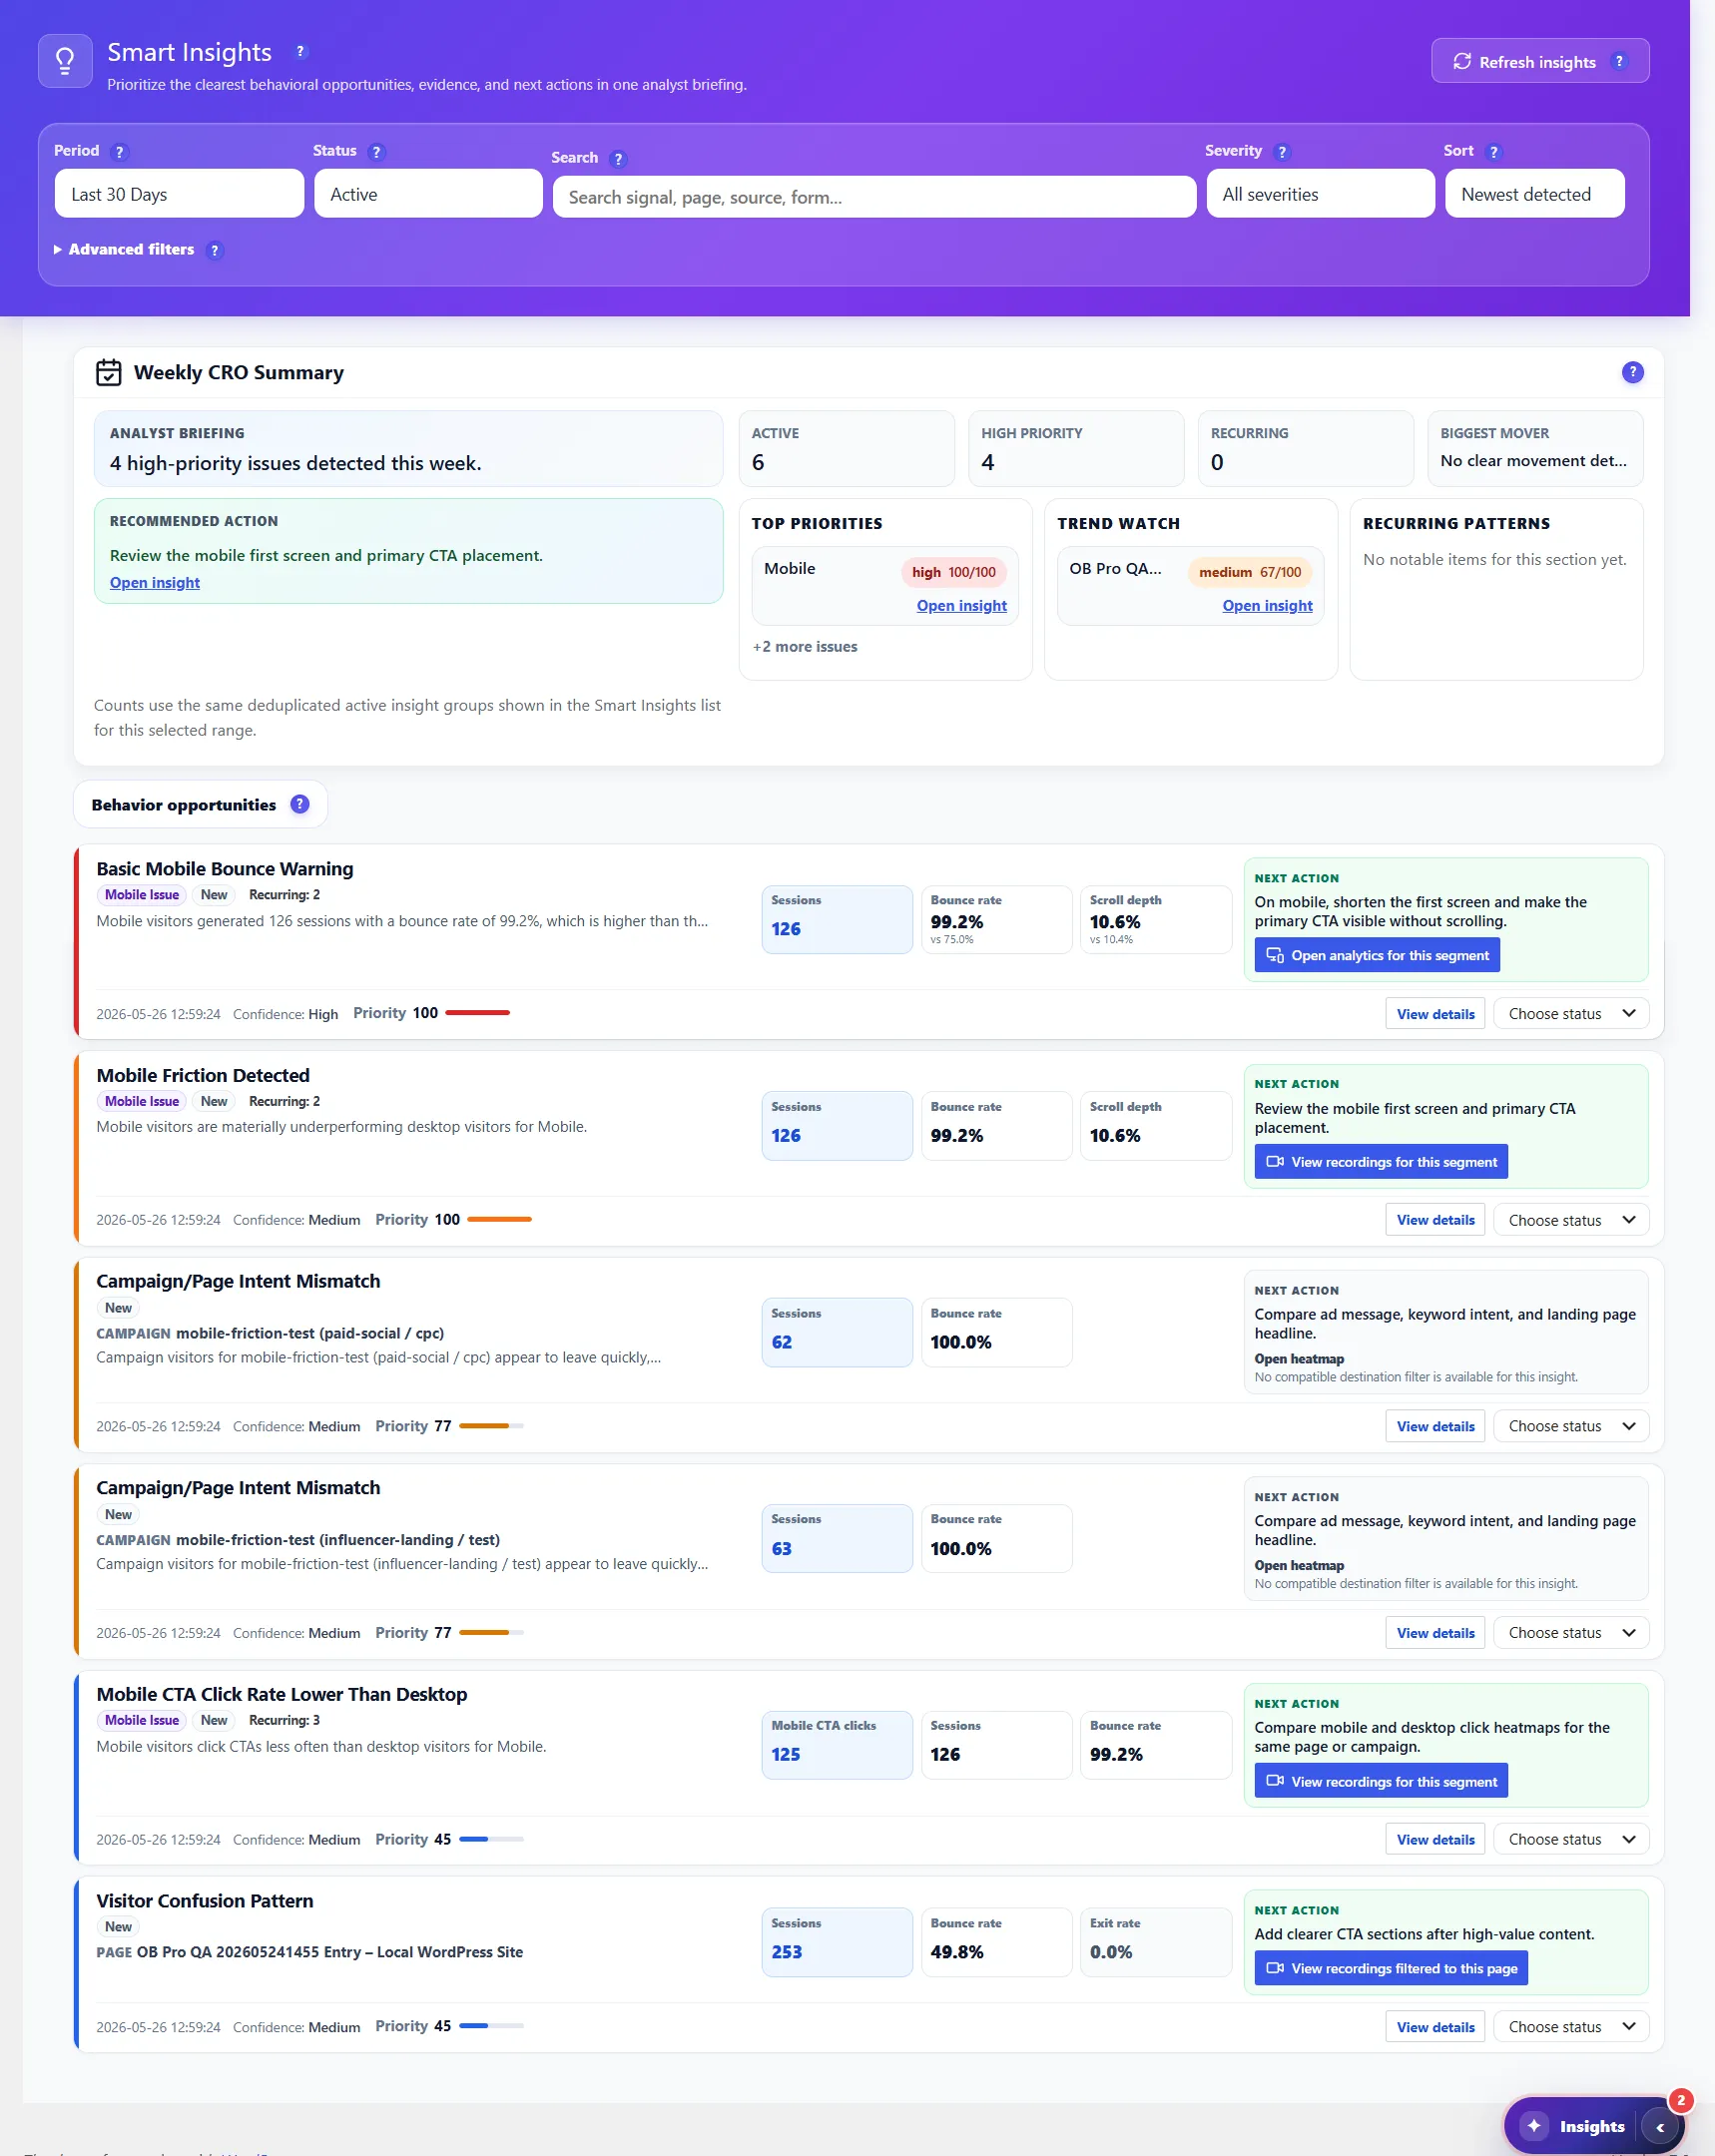
One signal, not twentyEvery anomaly is scored (priority 98/100, confidence High) and only the ones worth your week reach you.
Who, and what it costsThe visitors lost against your own average and, in Pro, the segments that carry the problem — new visitors, afternoon traffic, a country.
The next report to openEvidence is linked: the six recordings, the journeys, the heatmap, the errors. One click, and you are looking at the cause.
FREEPRO
Smart Insights Behavioral Recommendations
Turn self-hosted behavior data into a prioritized CRO briefing inside WordPress. Smart Insights reviews engagement, friction, funnels, forms, errors, recordings and experiments, then points your team toward the next action without exporting visitor data to a third-party analytics platform.
WEEKLY CRO BRIEFING Pro
Active opportunities with priority countsRecommended action for the weekTrend watch and recurring patterns
EVIDENCE-BACKED CARDS
Free core signalsengagement, exits, scroll, bounce and traffic changesPro-enriched evidencerecordings, journeys, forms, errors, funnels and A/B destinationsStatus workflowopen, reviewed and resolved recommendations
FILTERS & DESTINATIONS
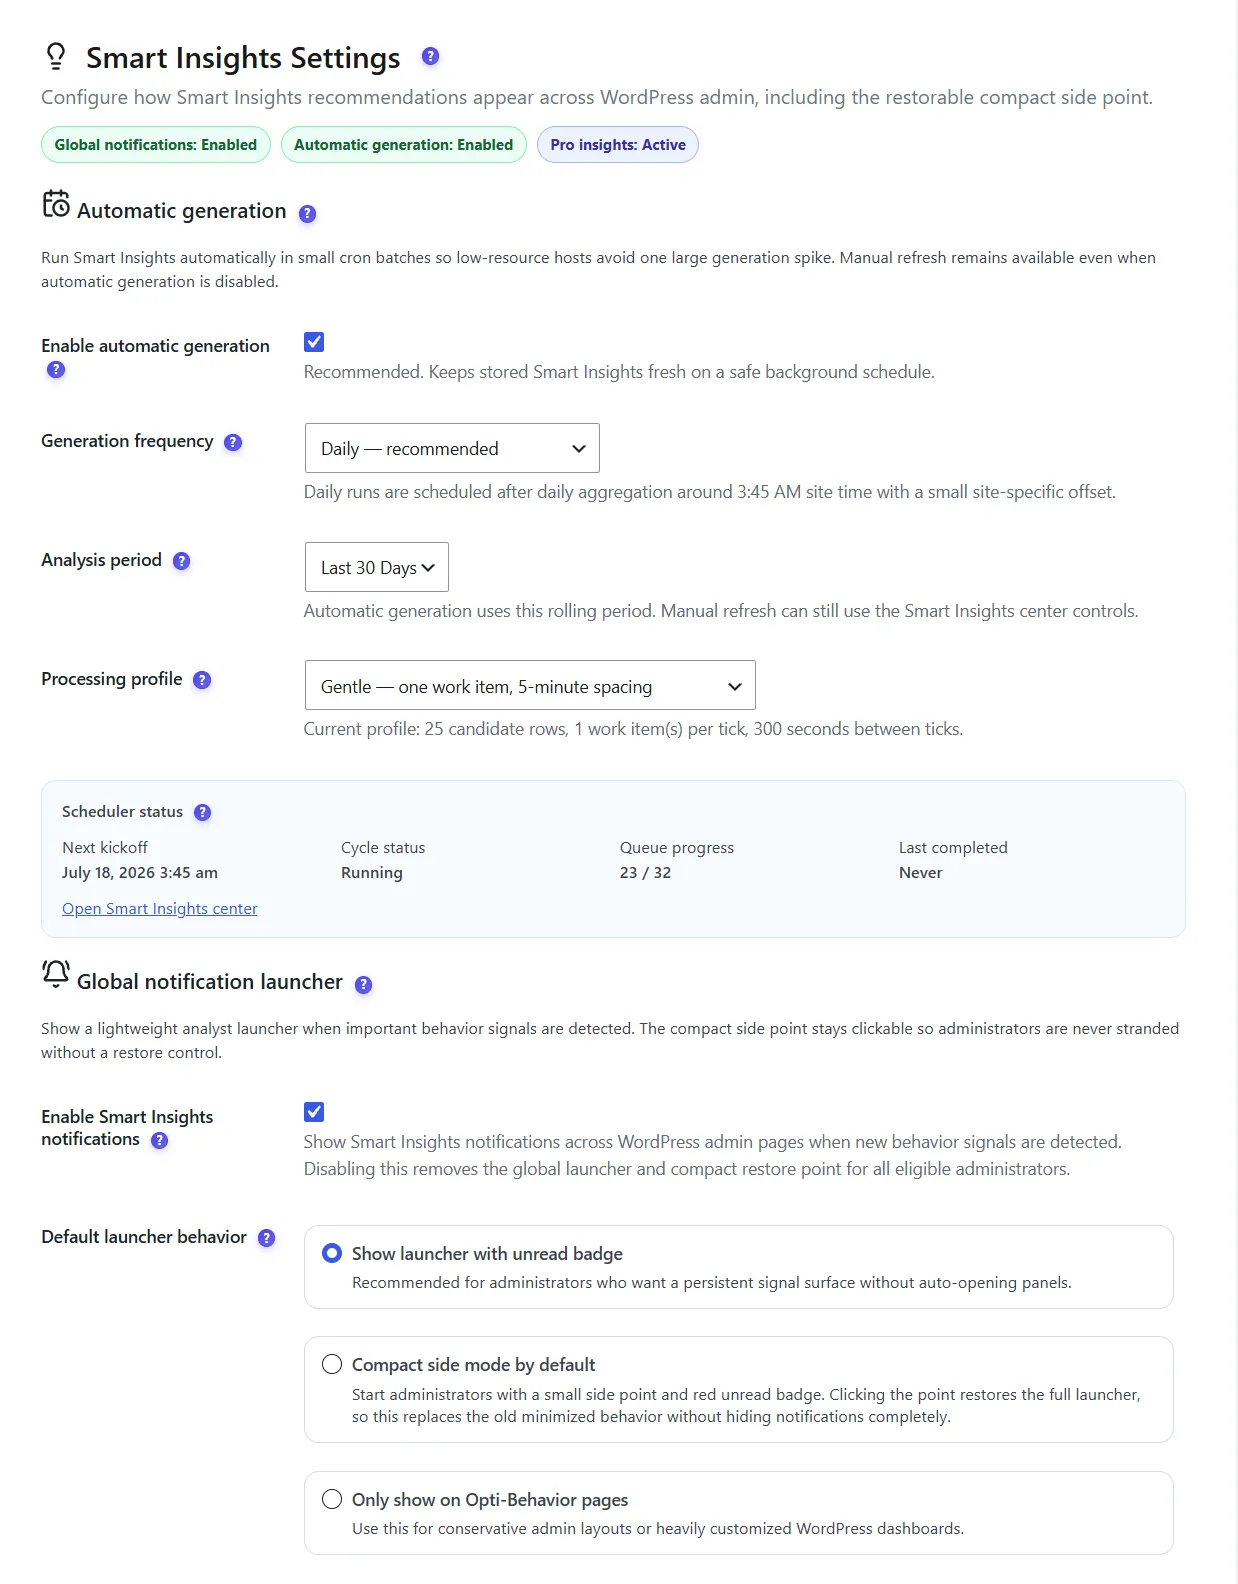
Period, severity and status filtersCategory, entity type and confidence filtersRelated reports and primary destination CTAsNotification launcher for high-priority issues
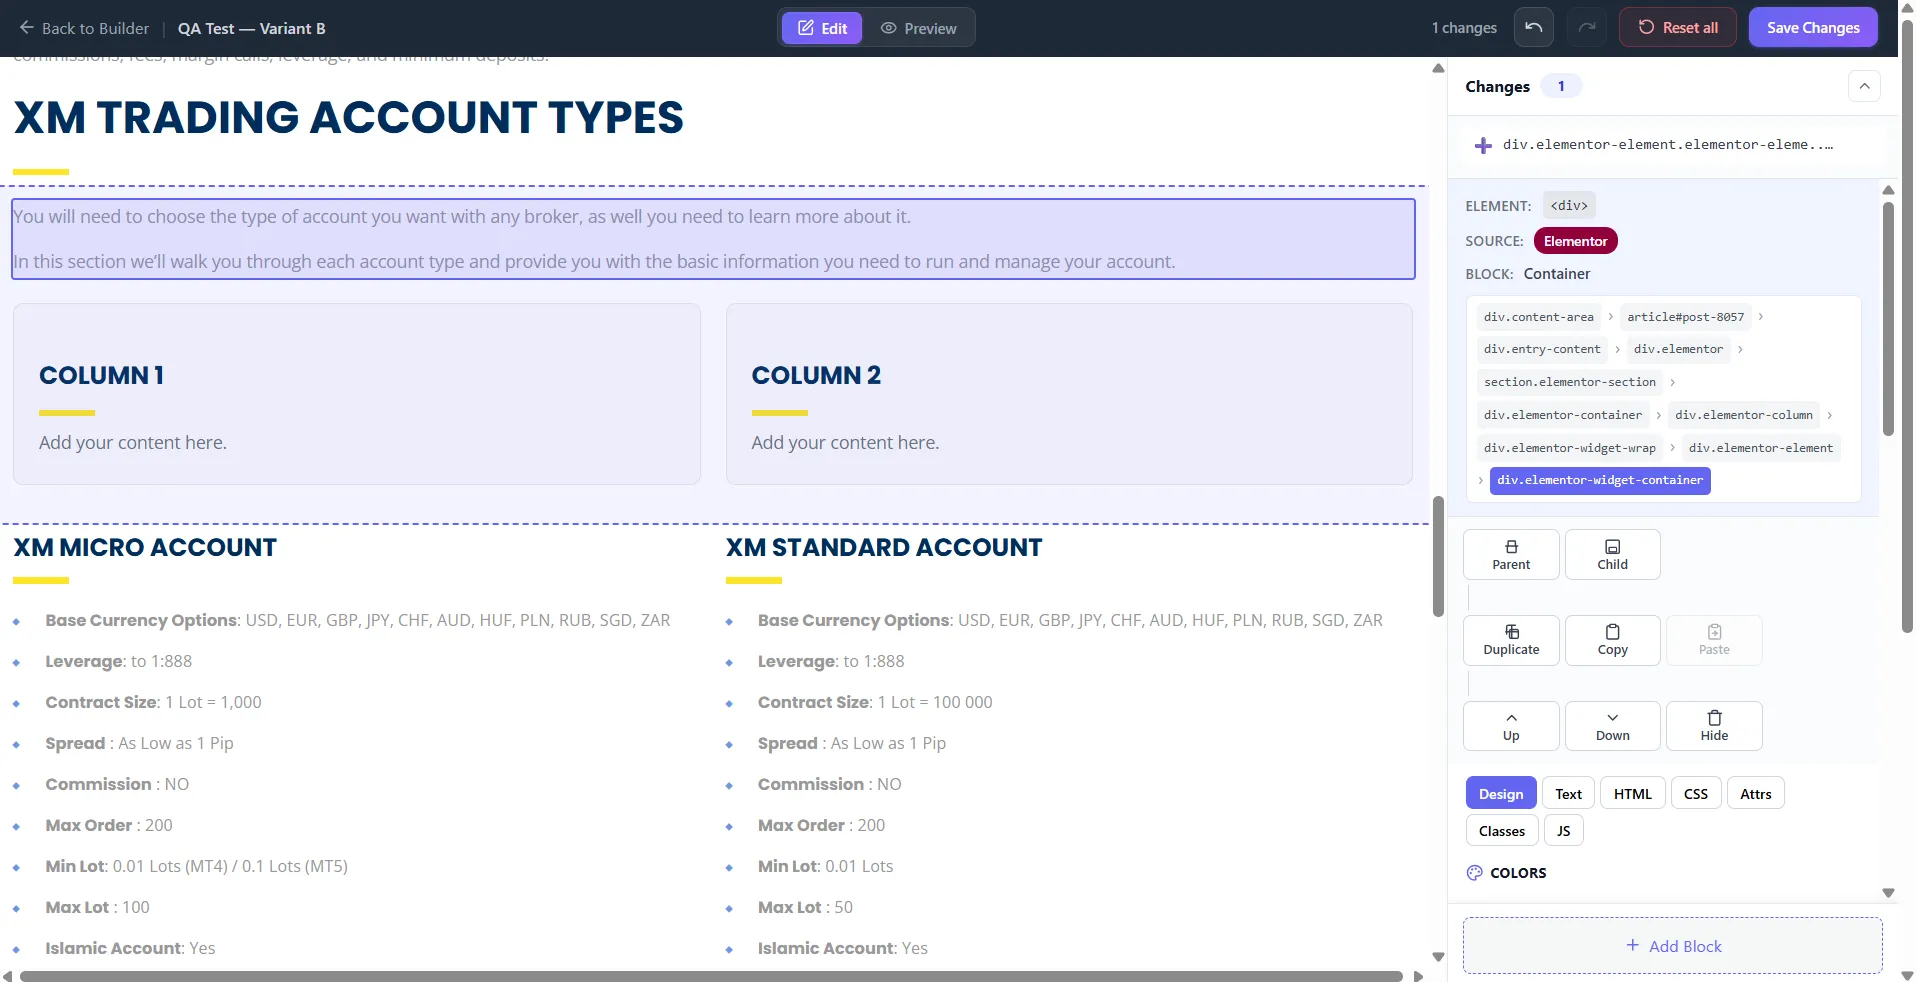
Same traffic, two pages. B adds a product image, real reviews and a button you don’t have to scroll to. The numbers decide, not the meeting.
→
With A/B Testing
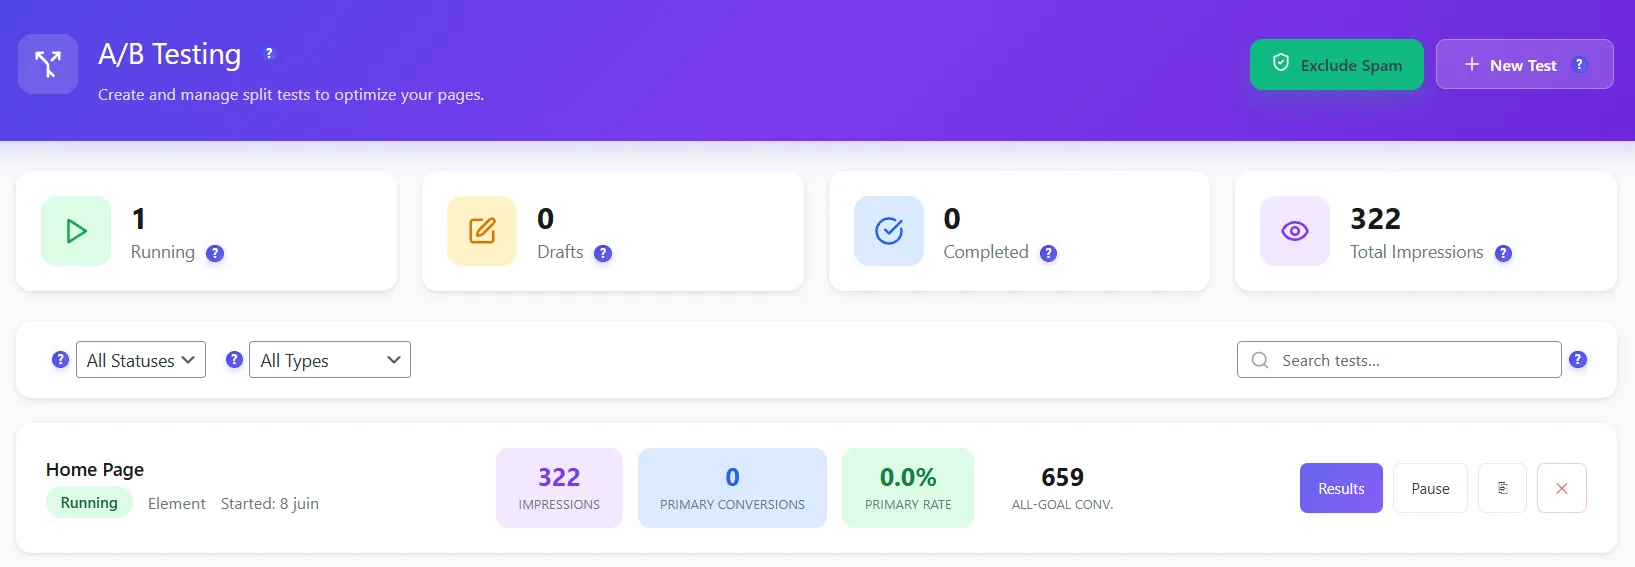
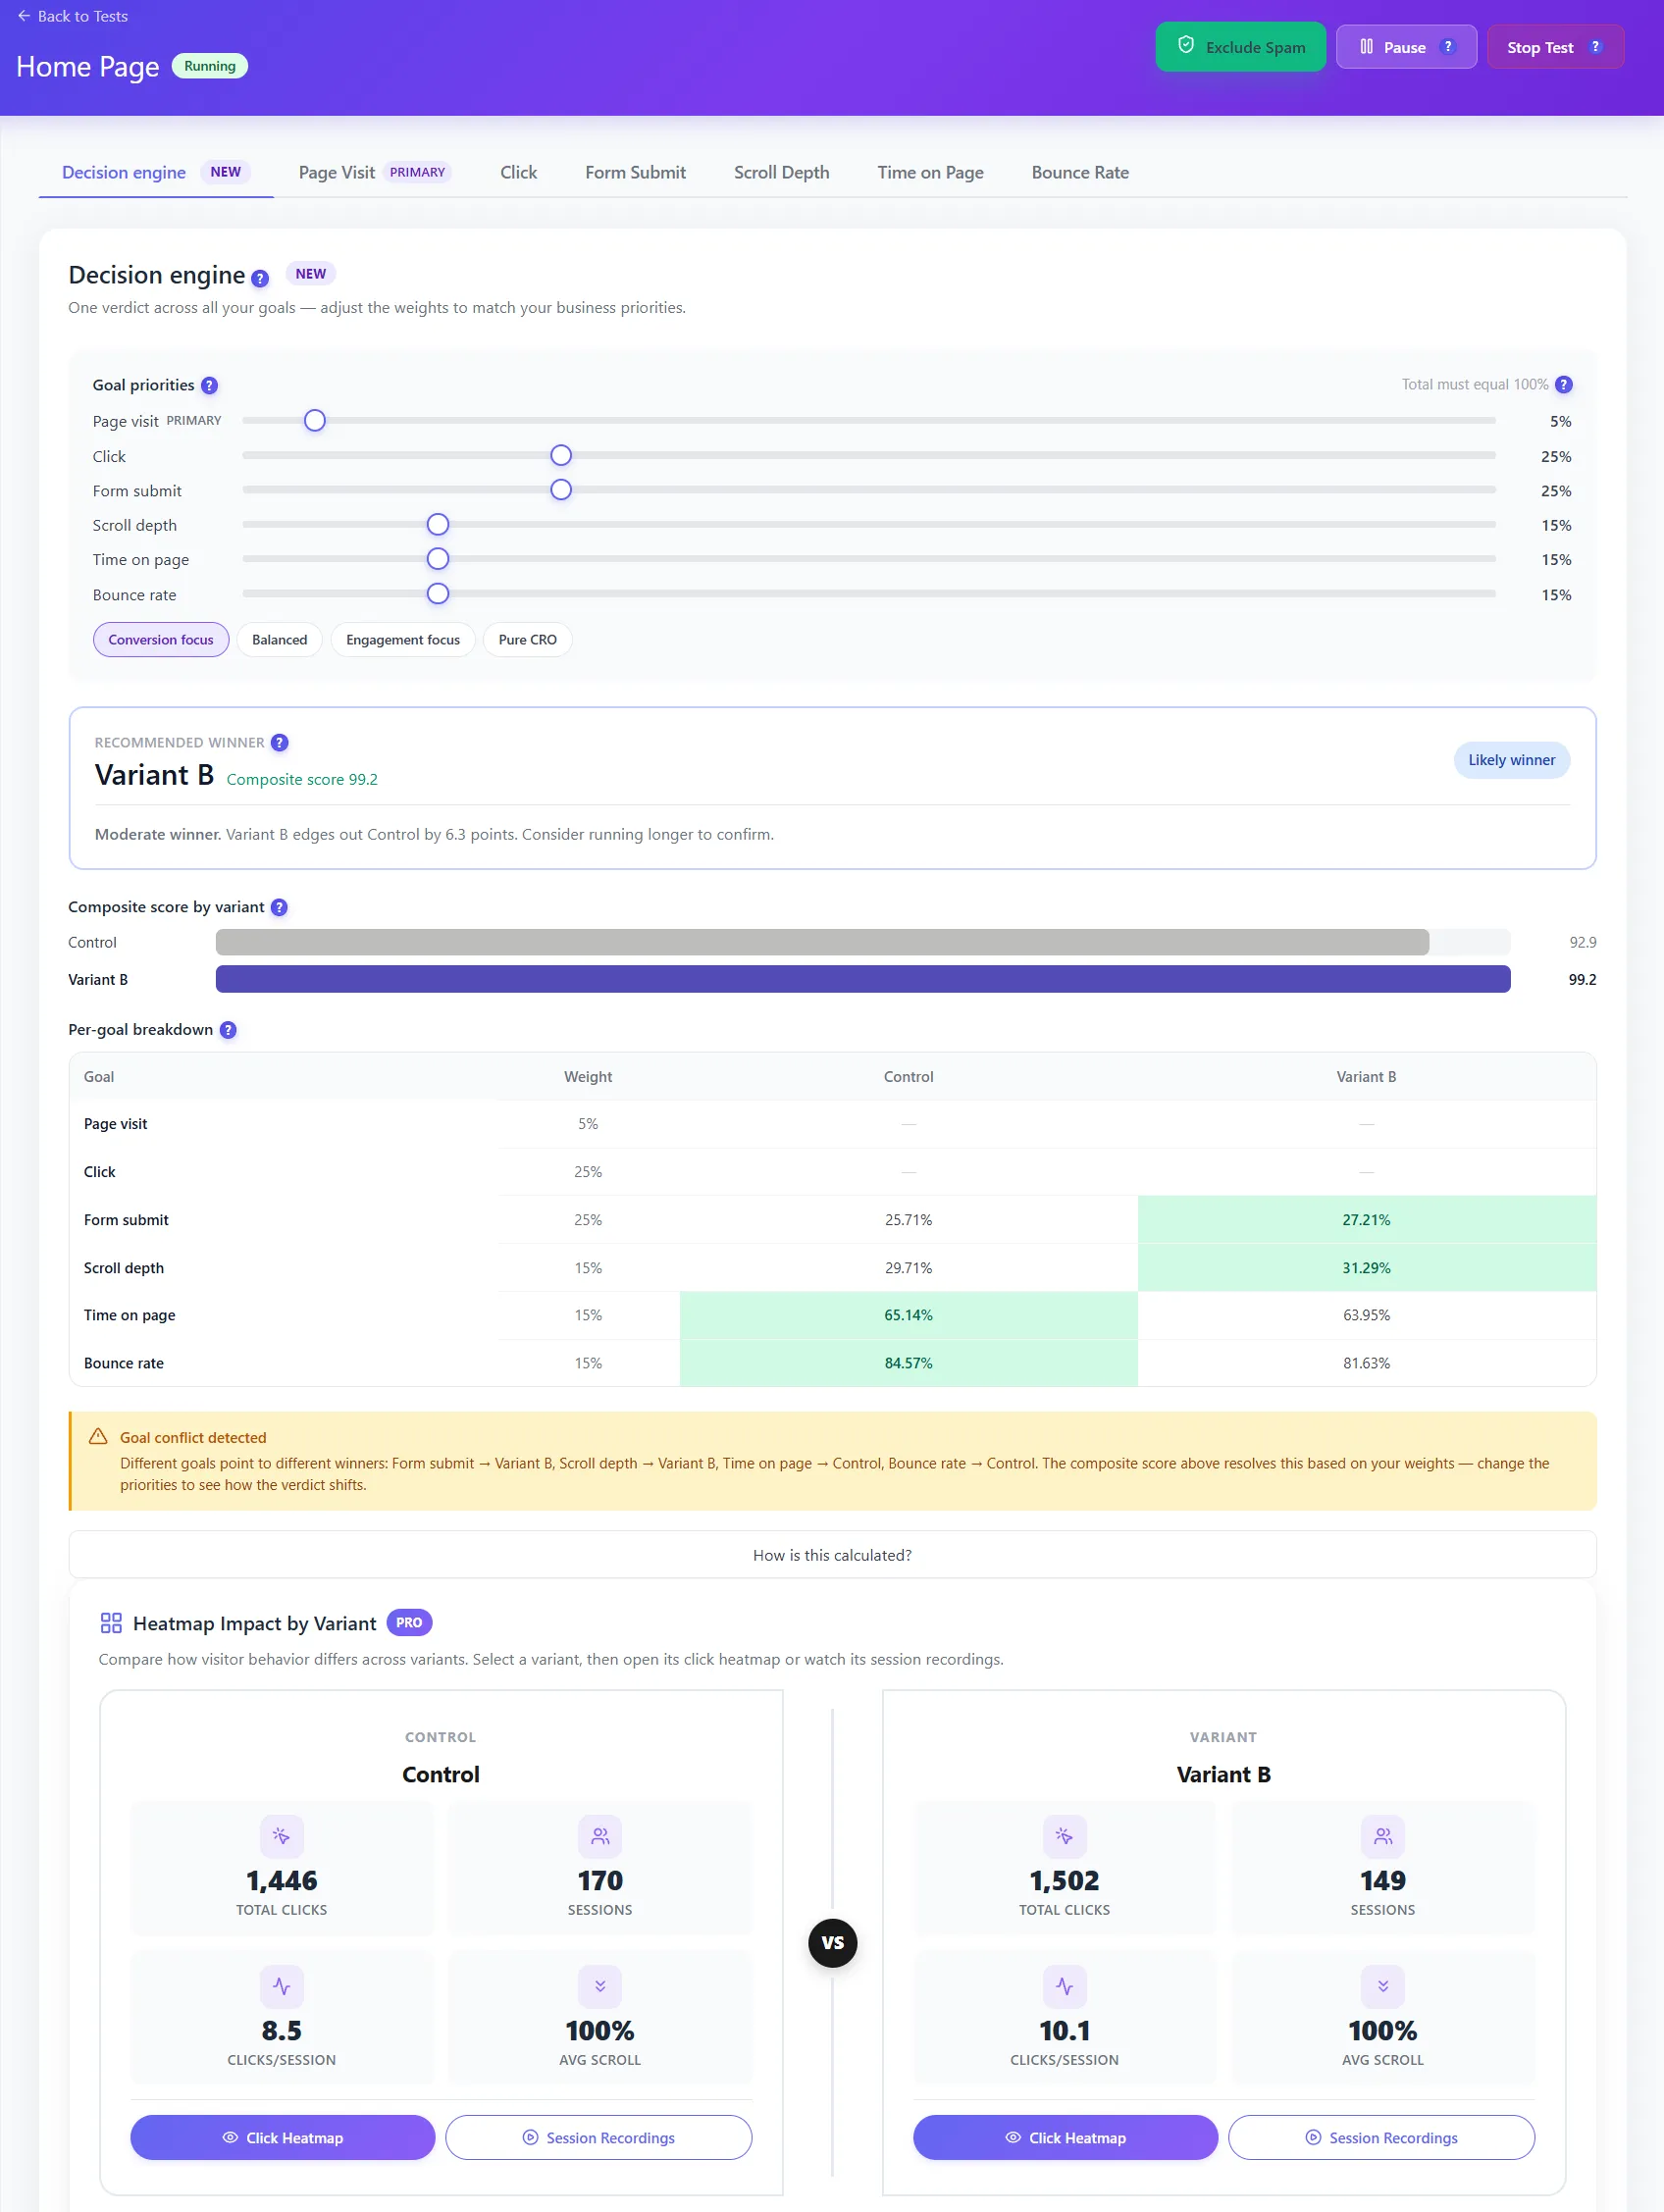
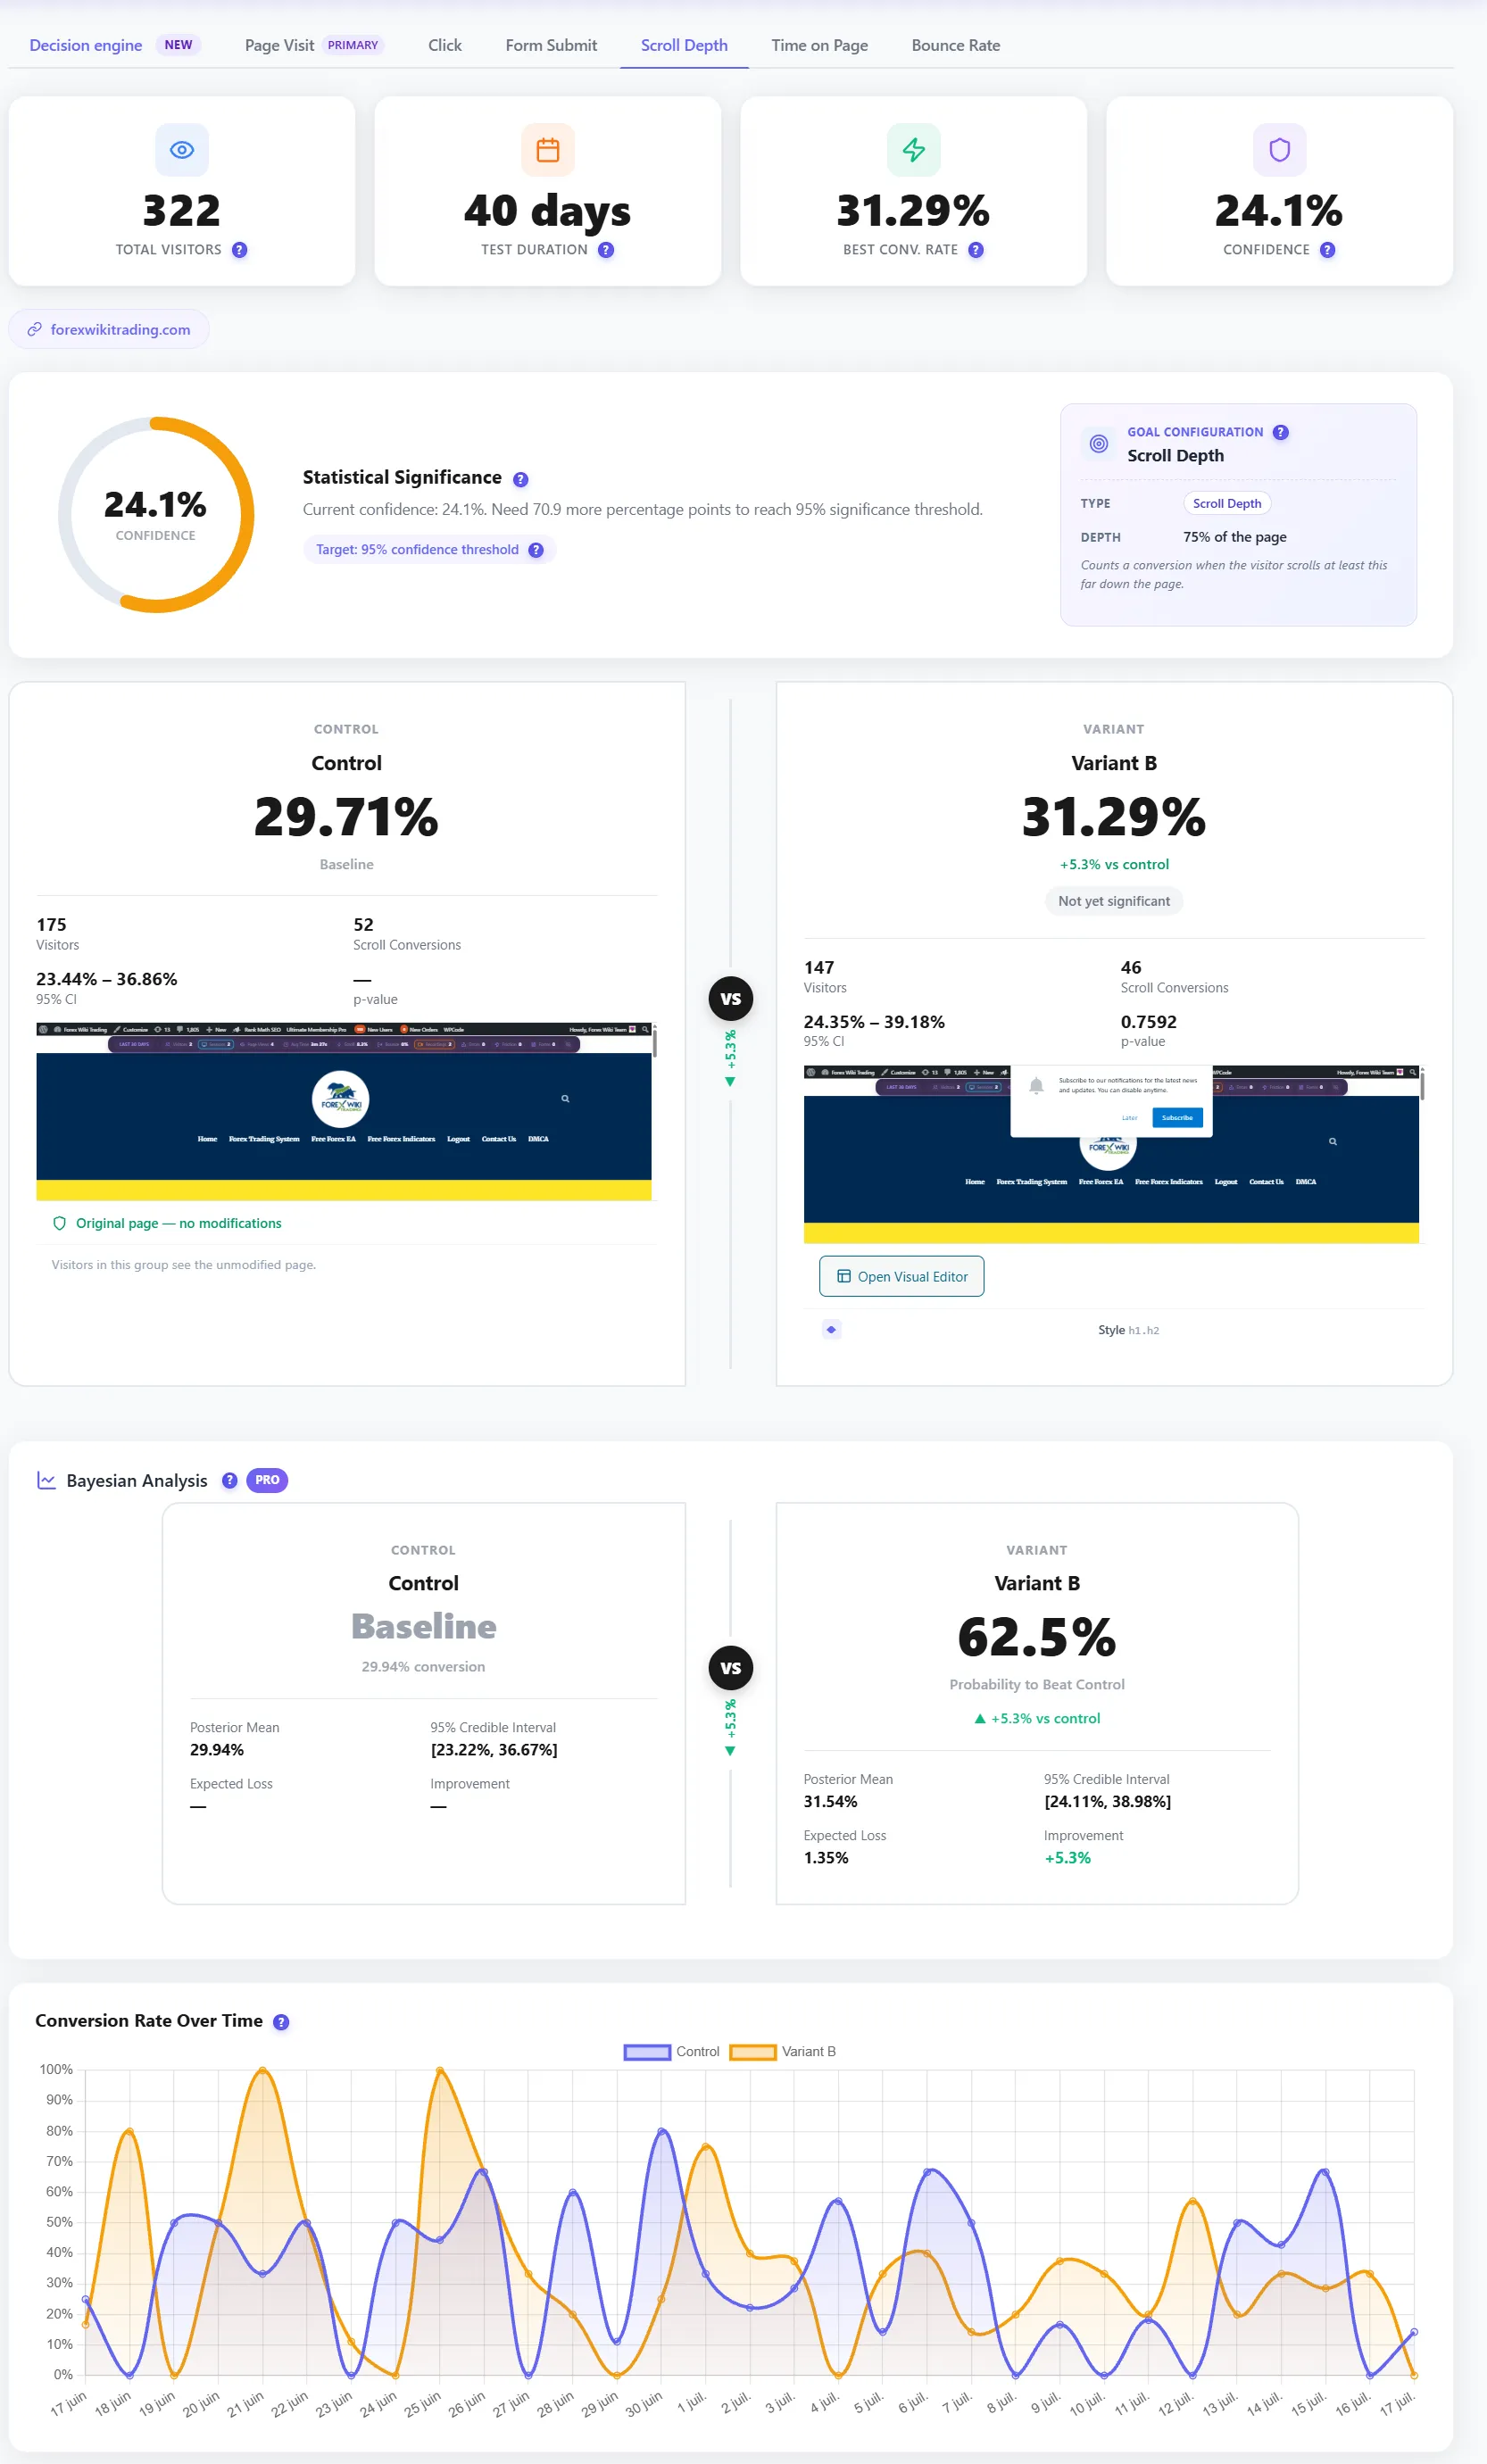
Test it, don’t argueTwo versions, same traffic, real visitors. The winner is a number, not an opinion.
Goals that matterClick, form, page, scroll, time — or WooCommerce revenue per visitor.
Ship the winner safelyApply the winning variant with one click. Rollback is one click too.
LIVE NOWFREEPRO
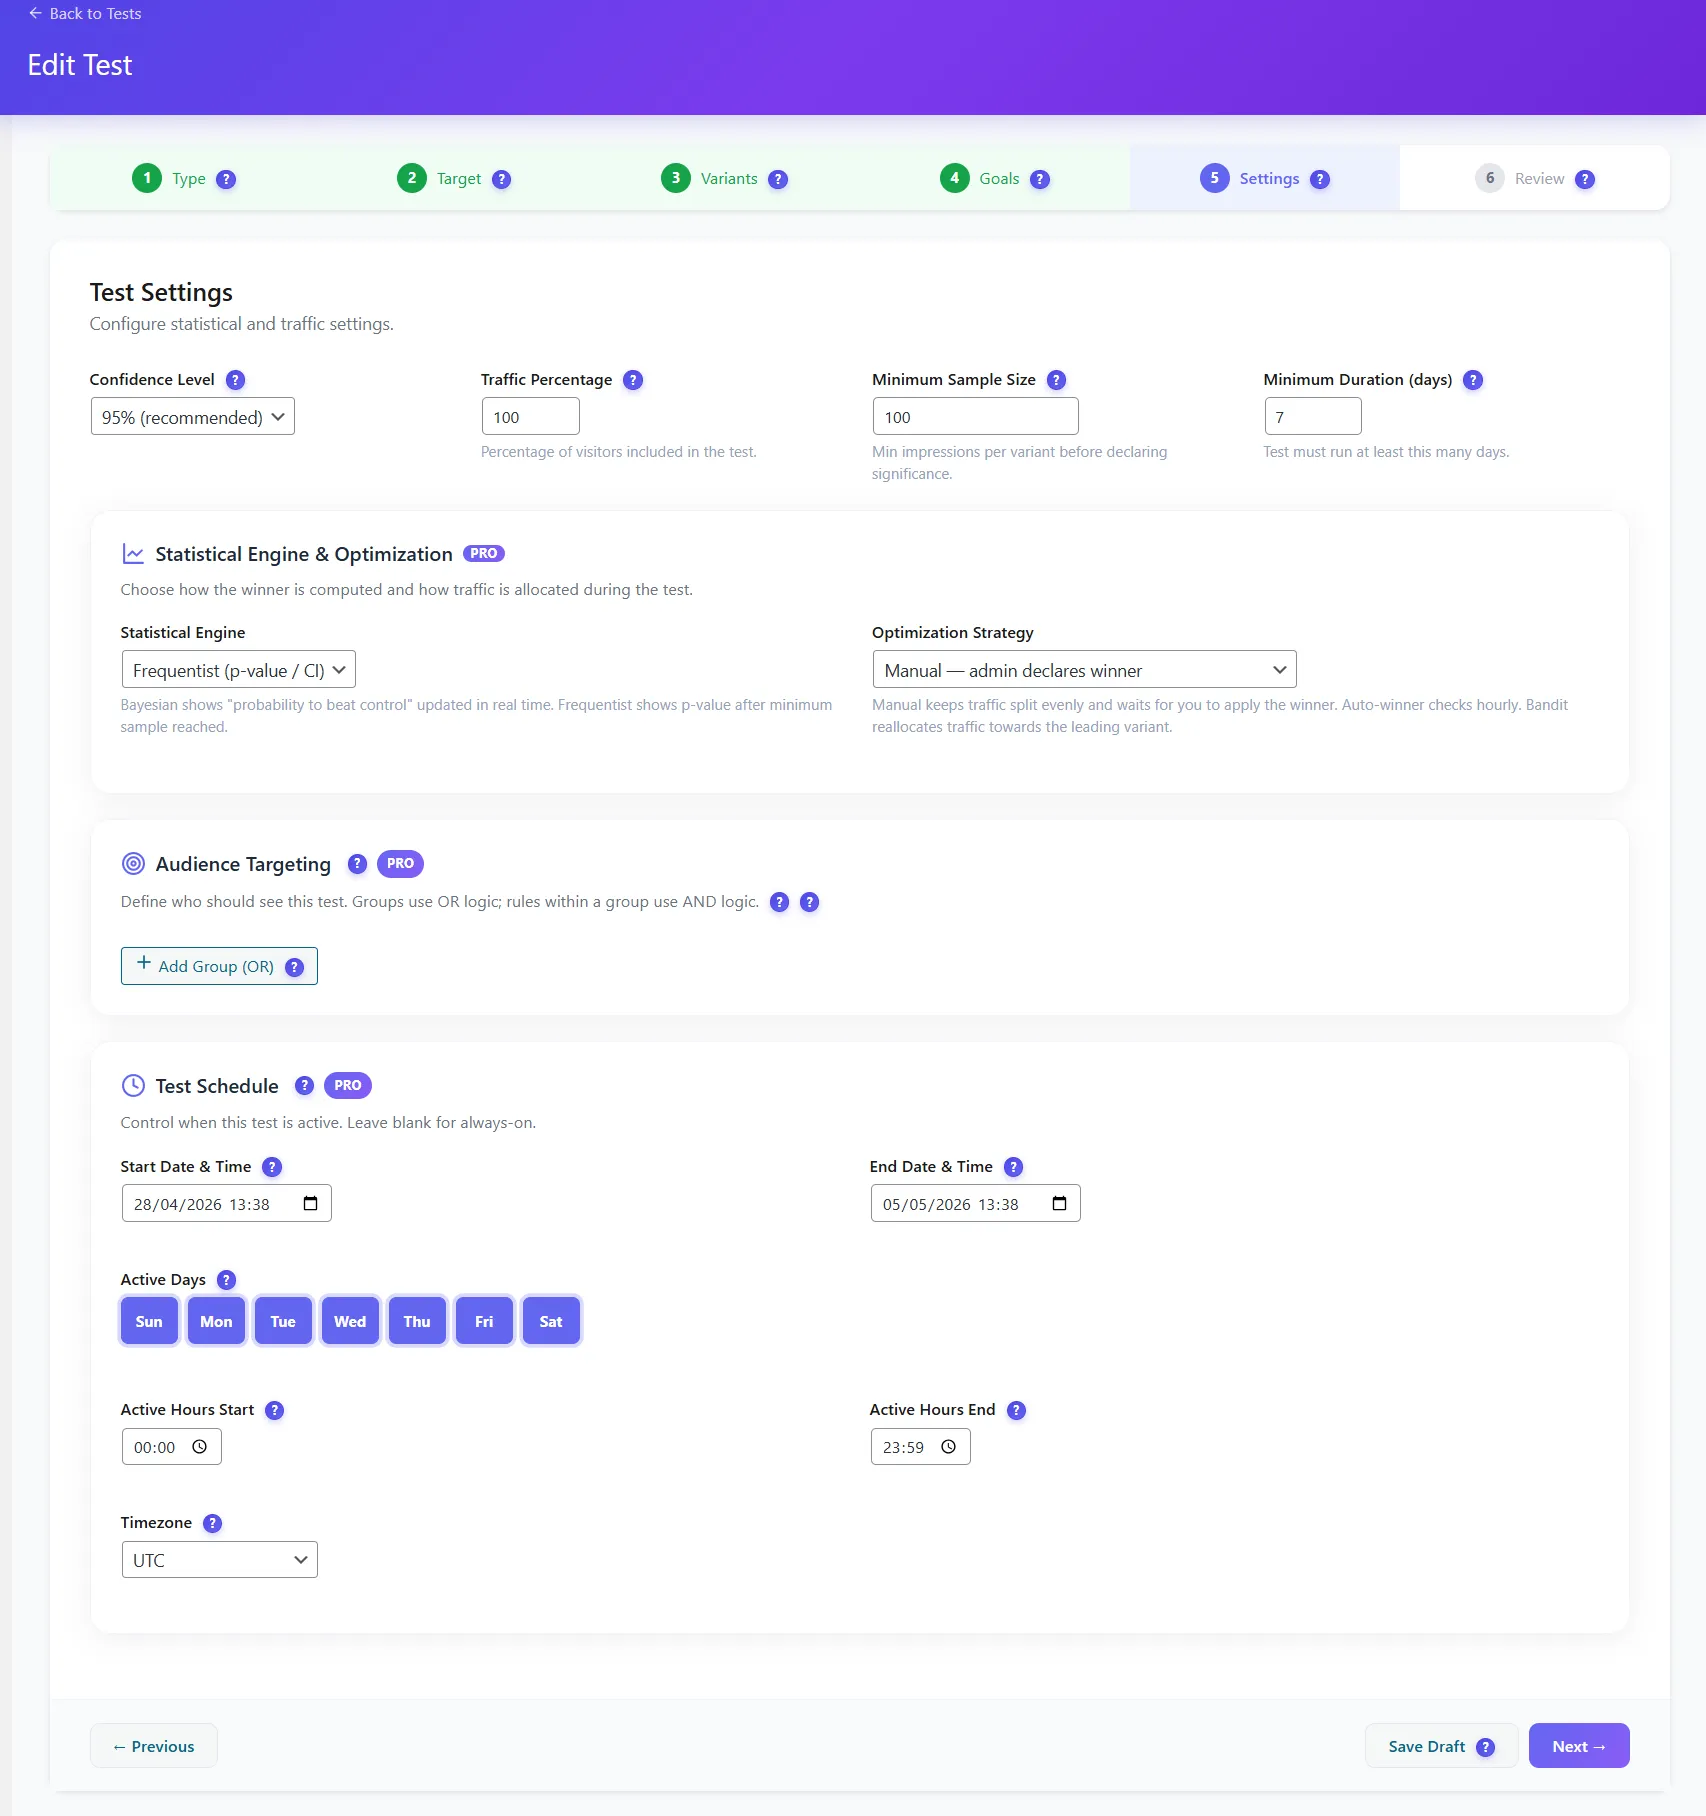
A/B Testing
Launch self-hosted WordPress experiments without external A/B testing SaaS. Test page variants, visual edits, conversion goals and WooCommerce revenue while every visitor assignment and conversion stays on your server.
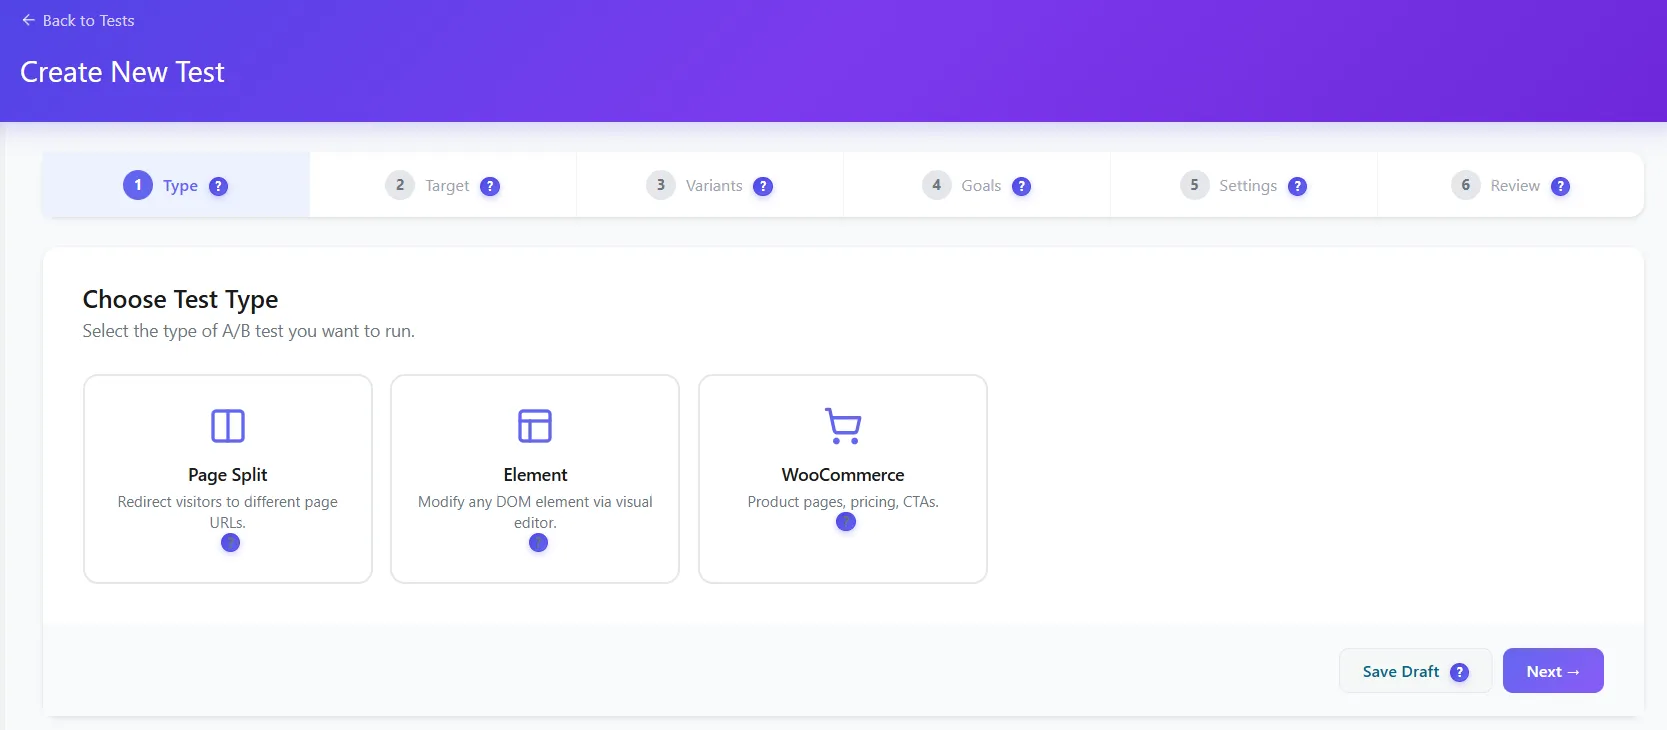
TEST TYPES
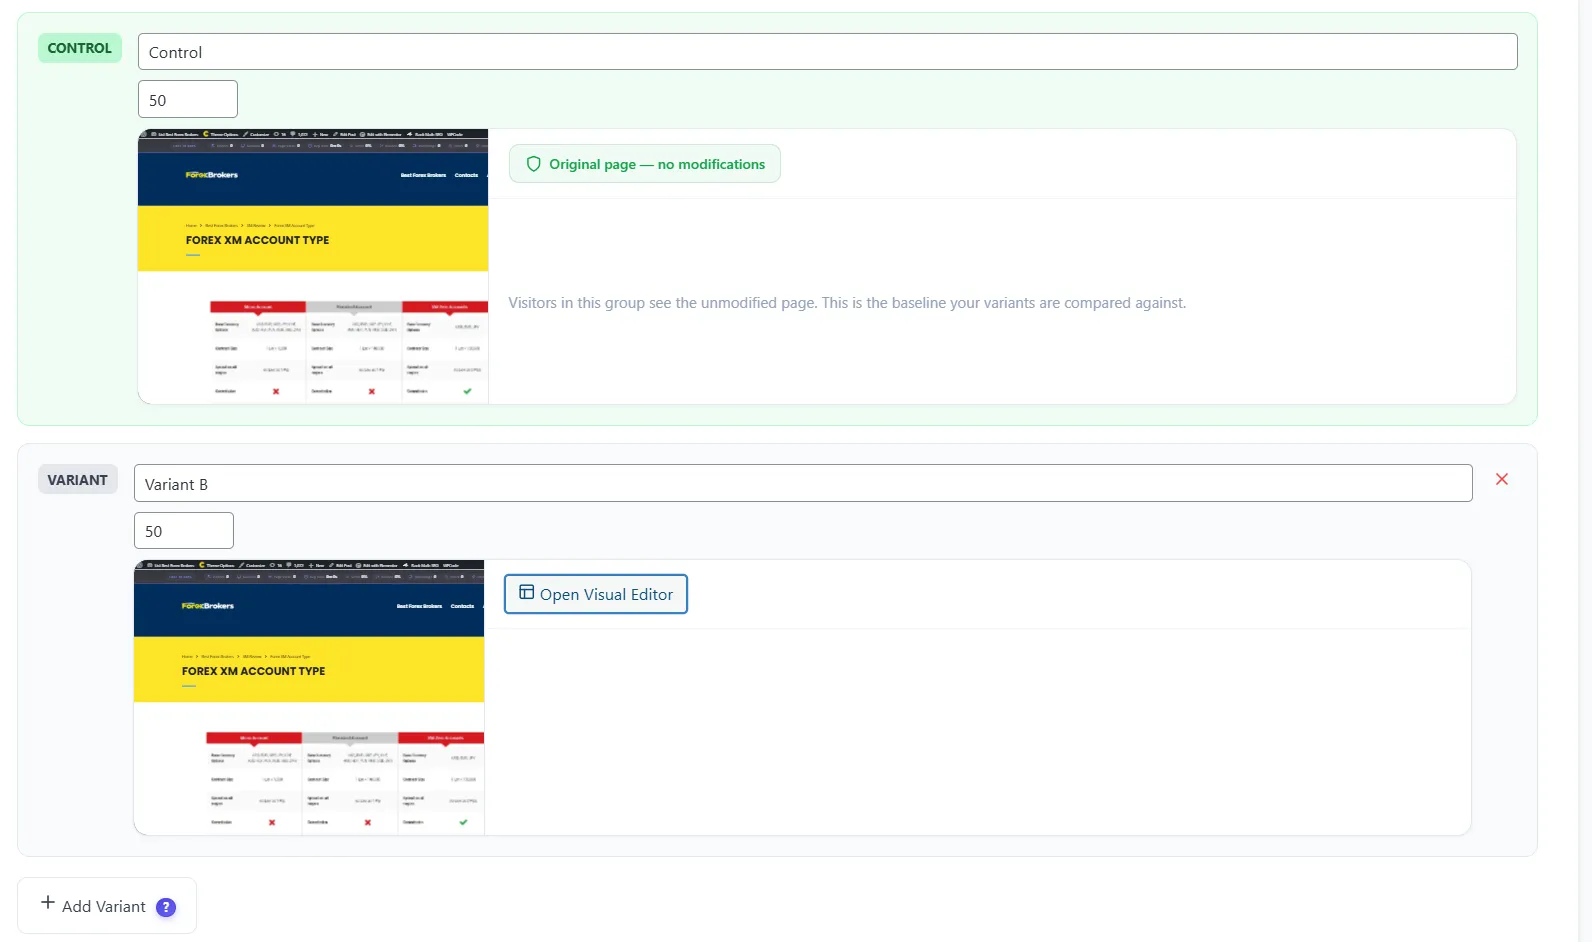
Page SplitRedirect visitors to different page URLsElement TestEdit page blocks visuallyWooCommerceProduct pages, pricing, images, CTAs
6-STEP EXPERIMENT BUILDER
Type Target Variants Goals Settings Review
A guided workflow helps marketers create clean experiments without touching code: choose the test type, select the target page or product, define variants, attach conversion goals, configure statistical settings and review before launch.
CONVERSION GOALS
Click goalPage visitForm submitScroll depthTime on pageRevenueBounce behavior
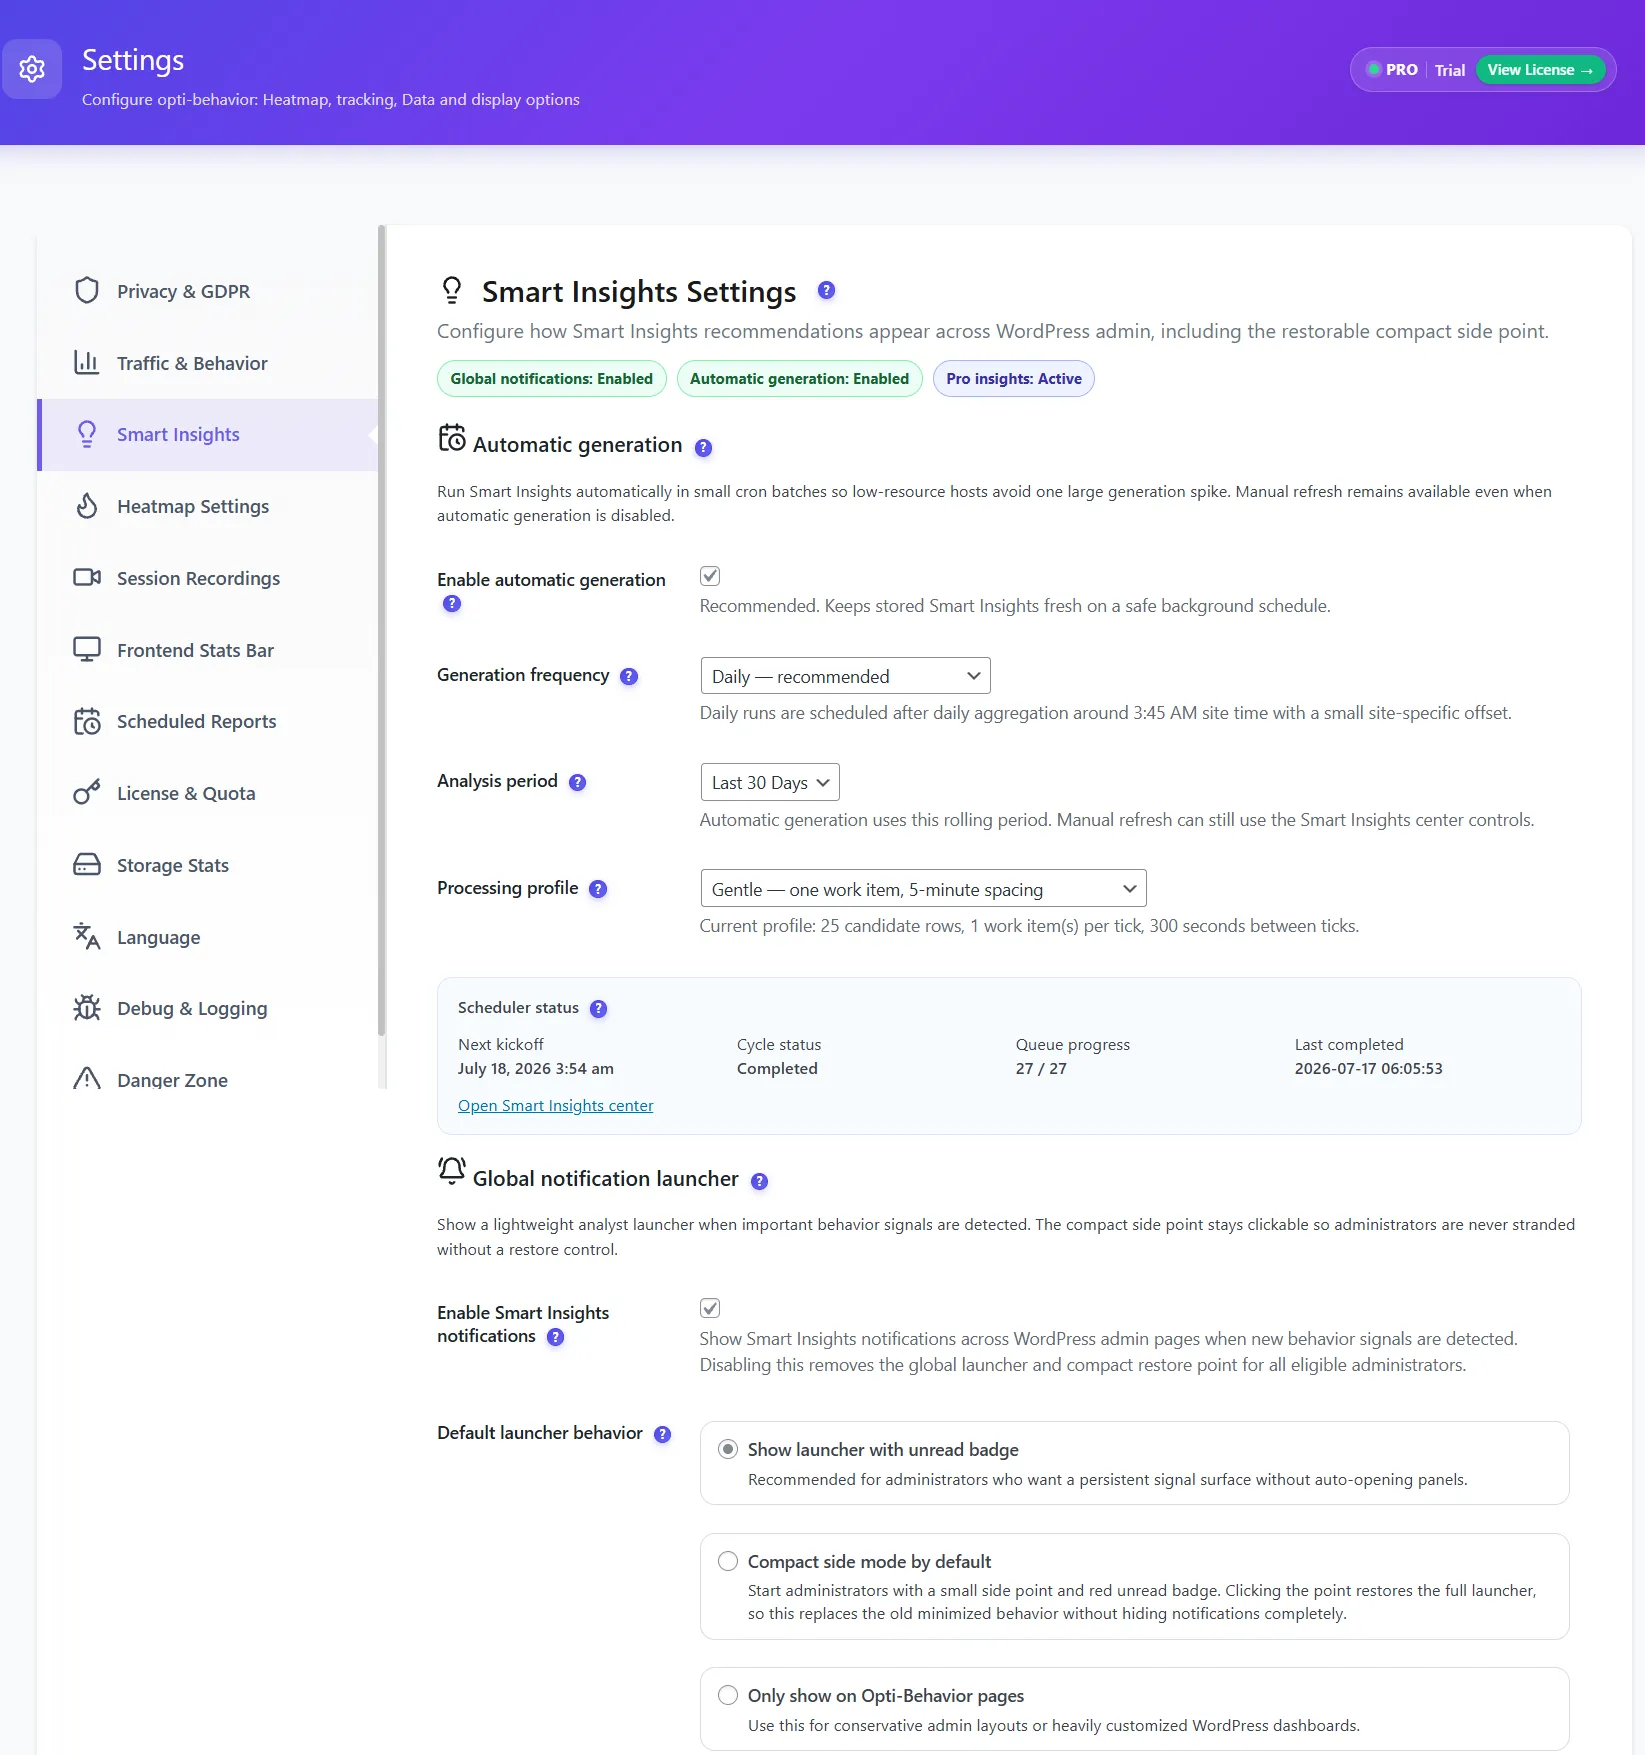
Thresholds, retention, reports, storage, cleanup, every module — one screen. Change a number, hit save. No code, no ticket, no SaaS support chat.
→
With Settings
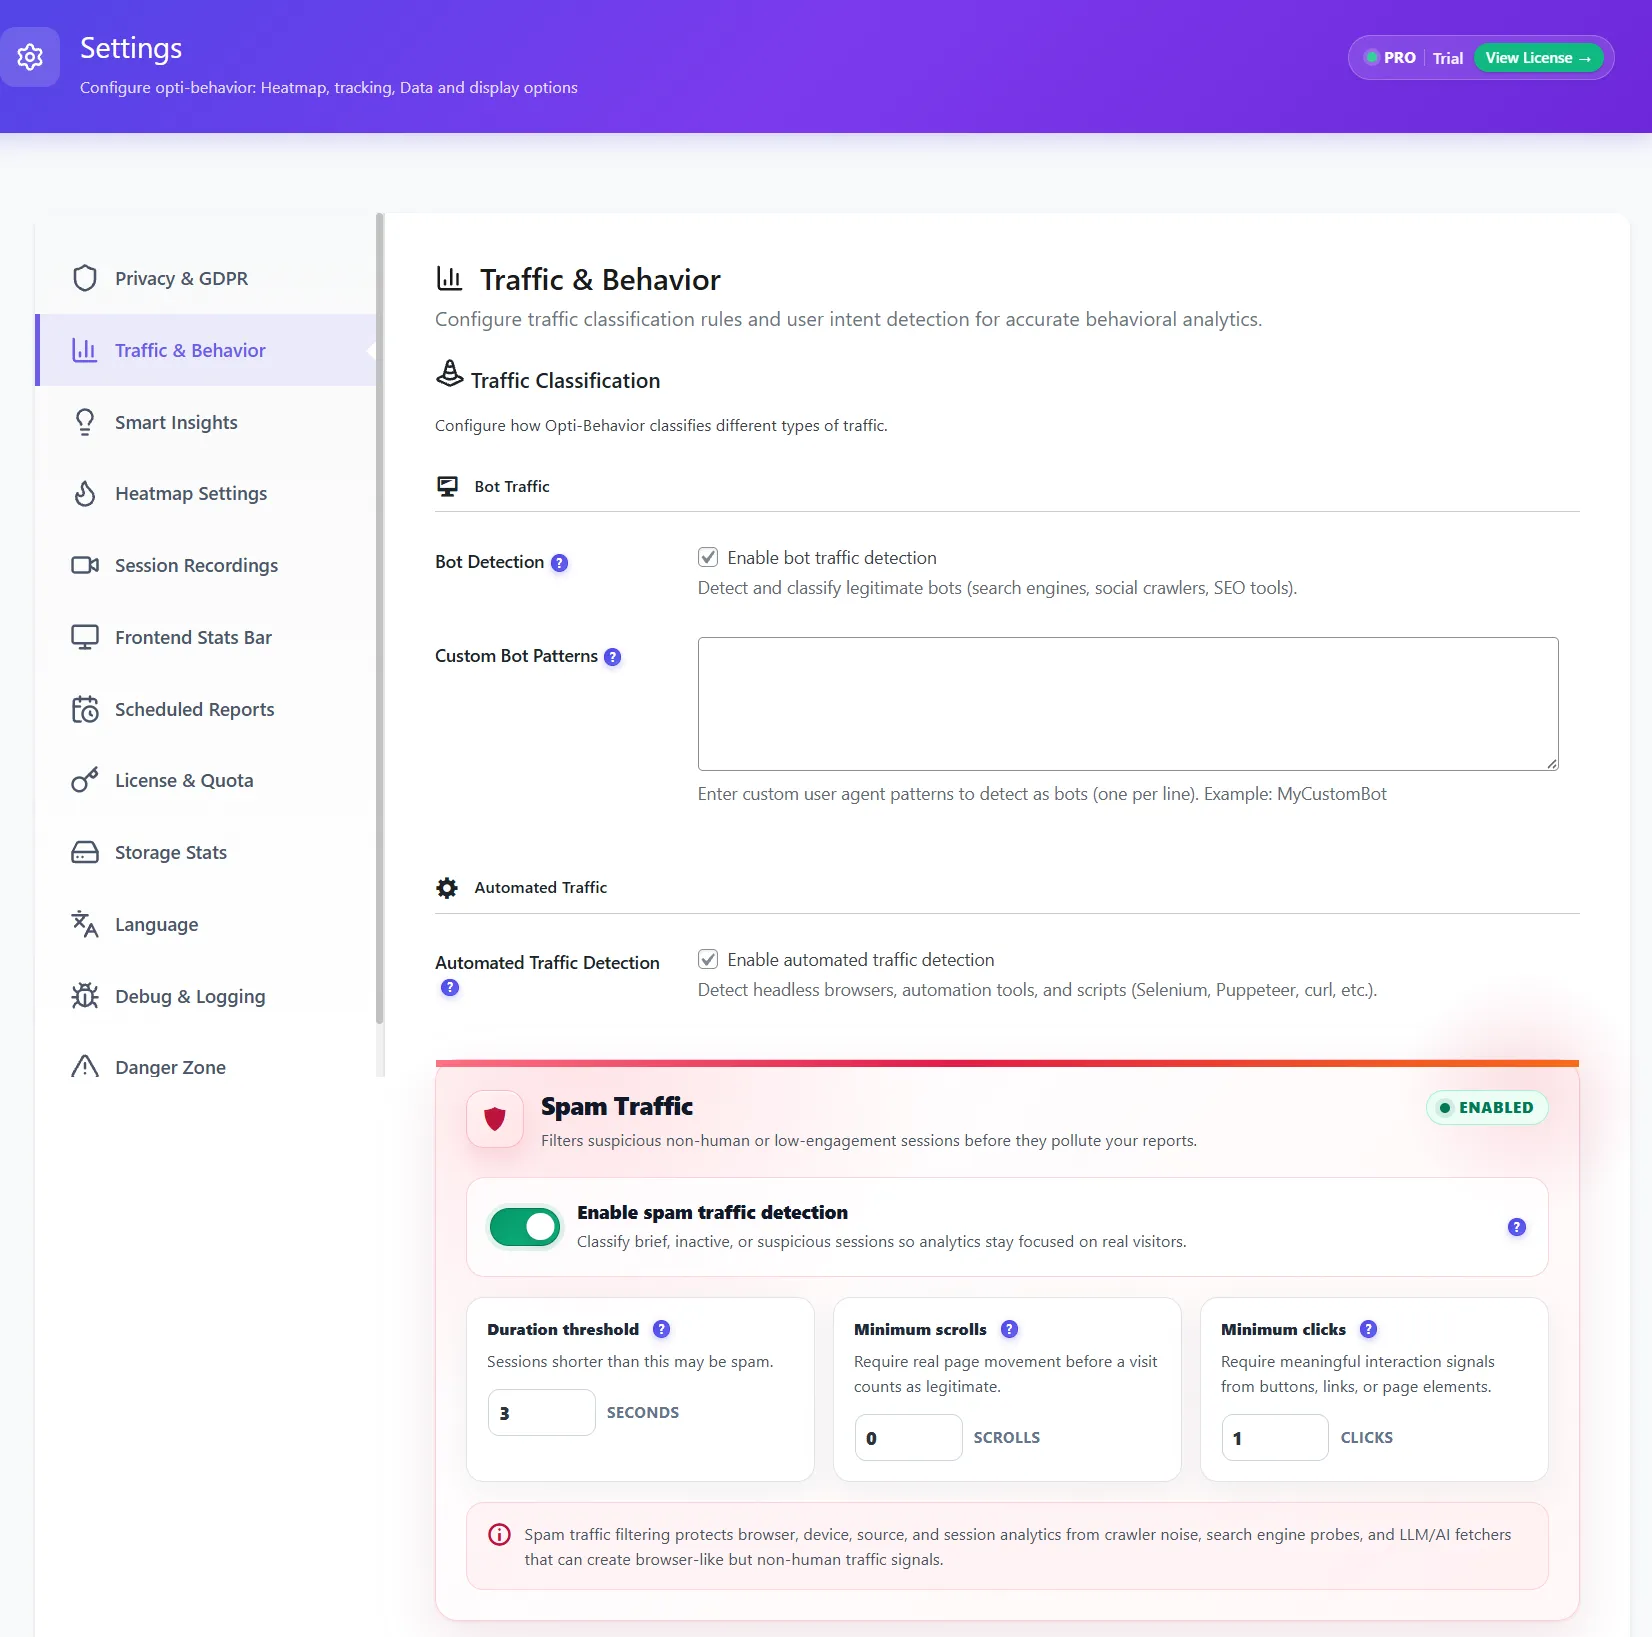
Every feature, one screenTurn modules on or off, set what counts as a rage click, choose which pages and roles are tracked.
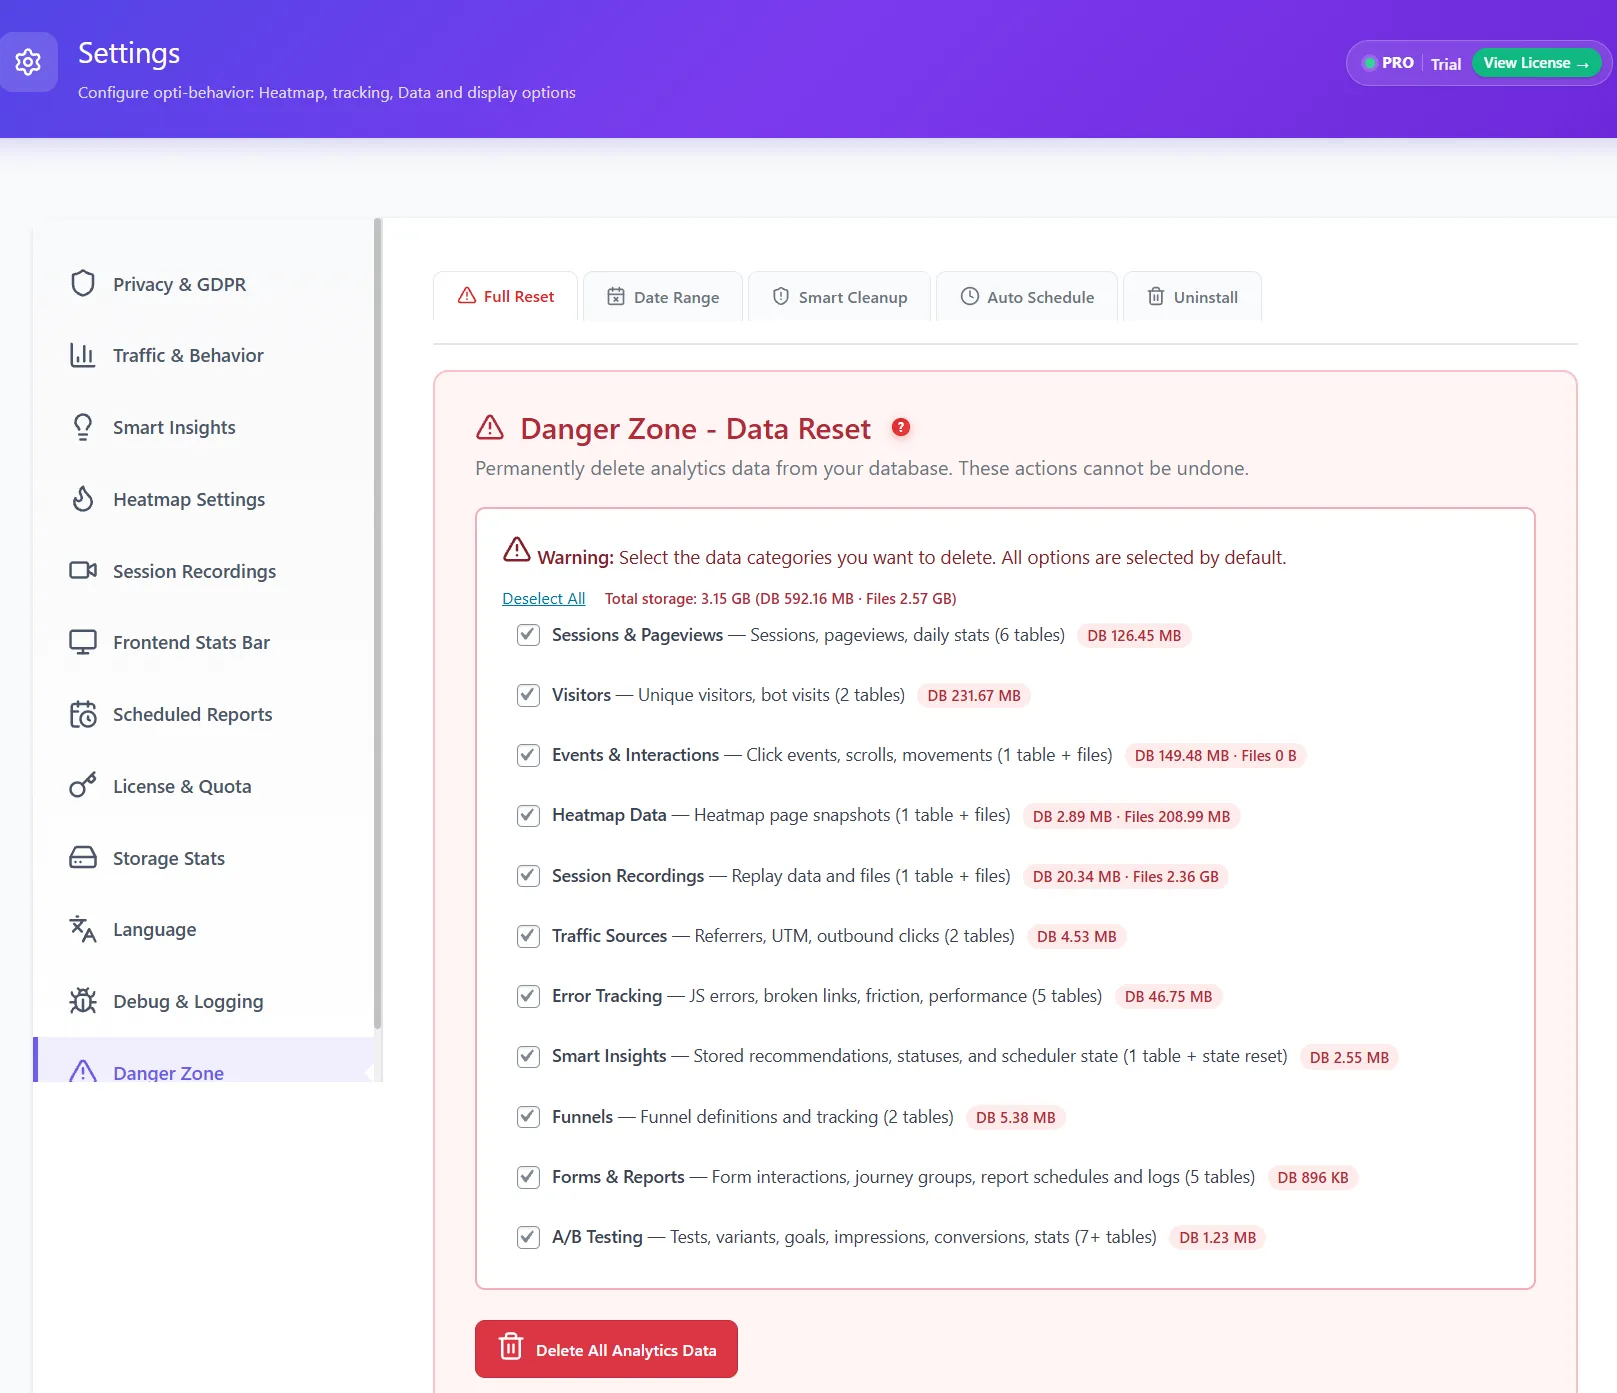
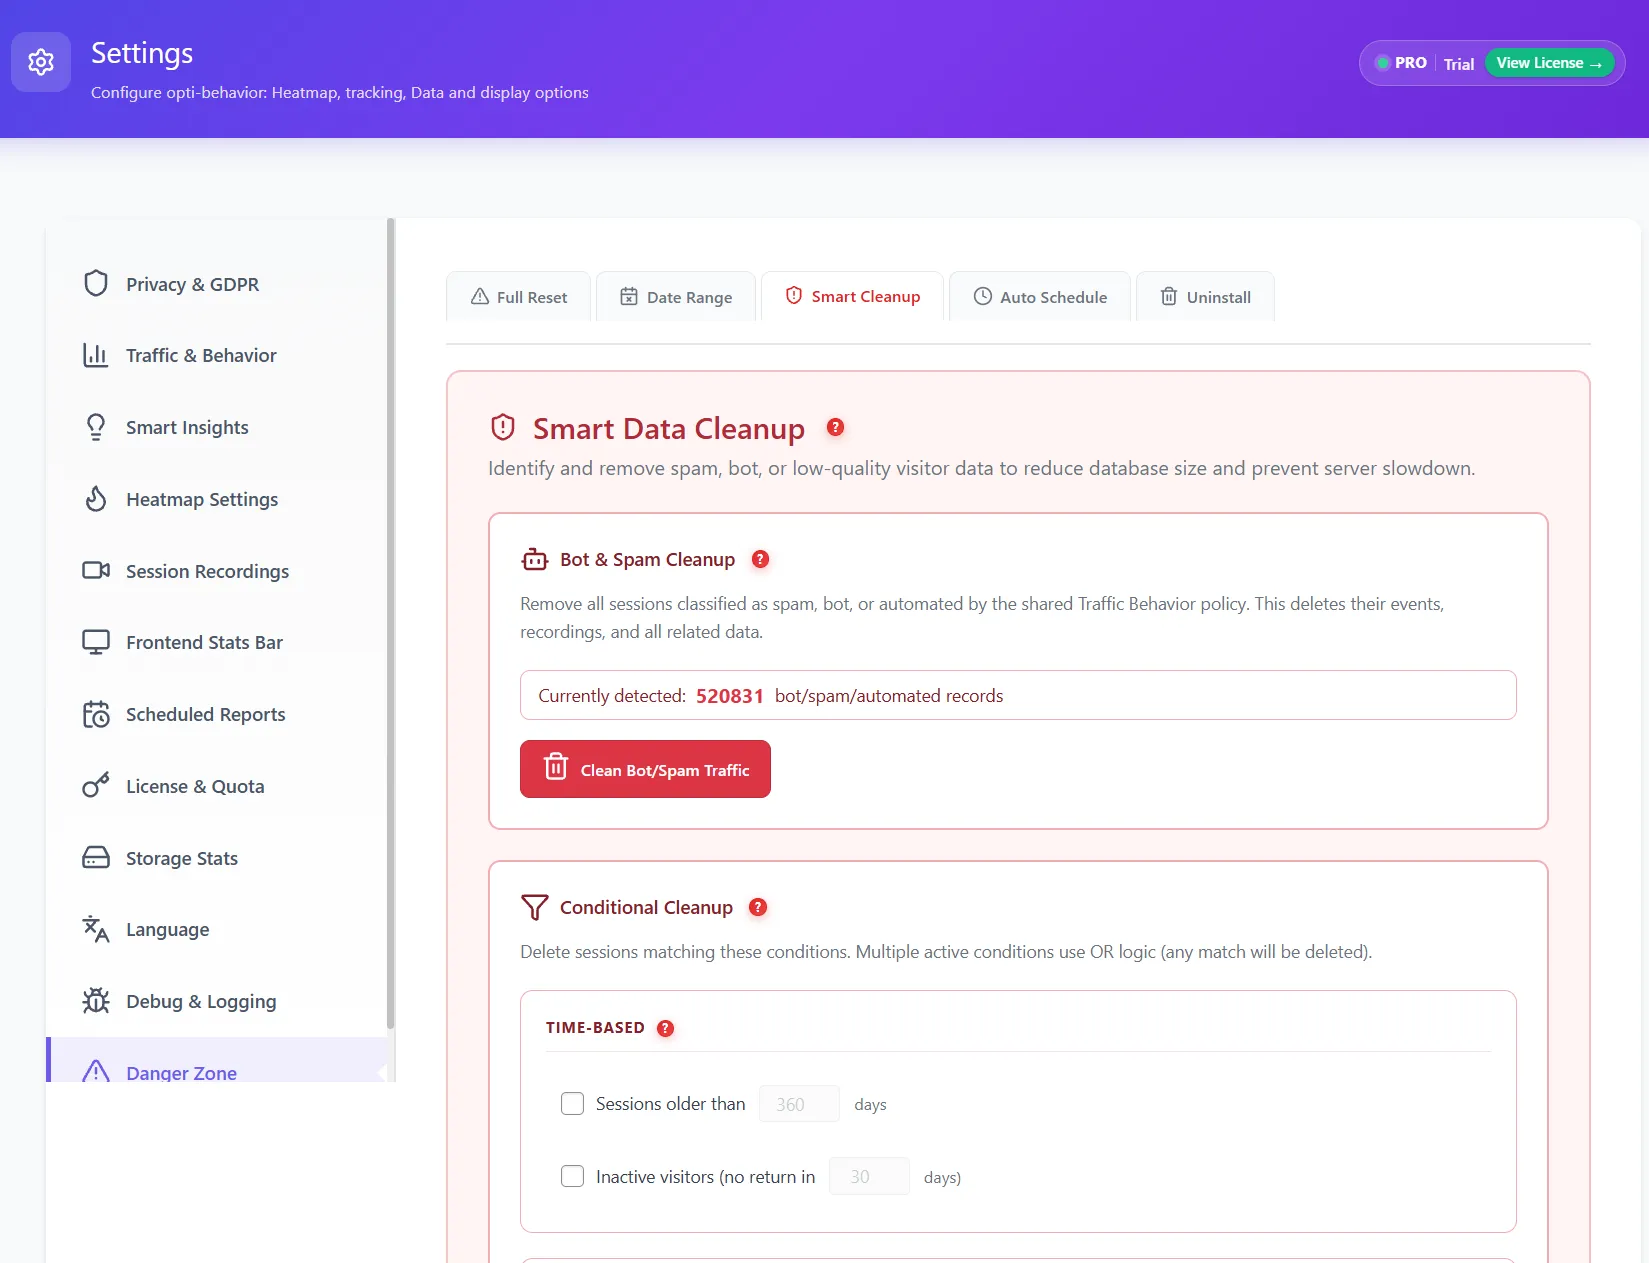
Storage you controlRetention per module, tiered auto-cleanup with a safety valve, exports — your footprint has a ceiling you set.
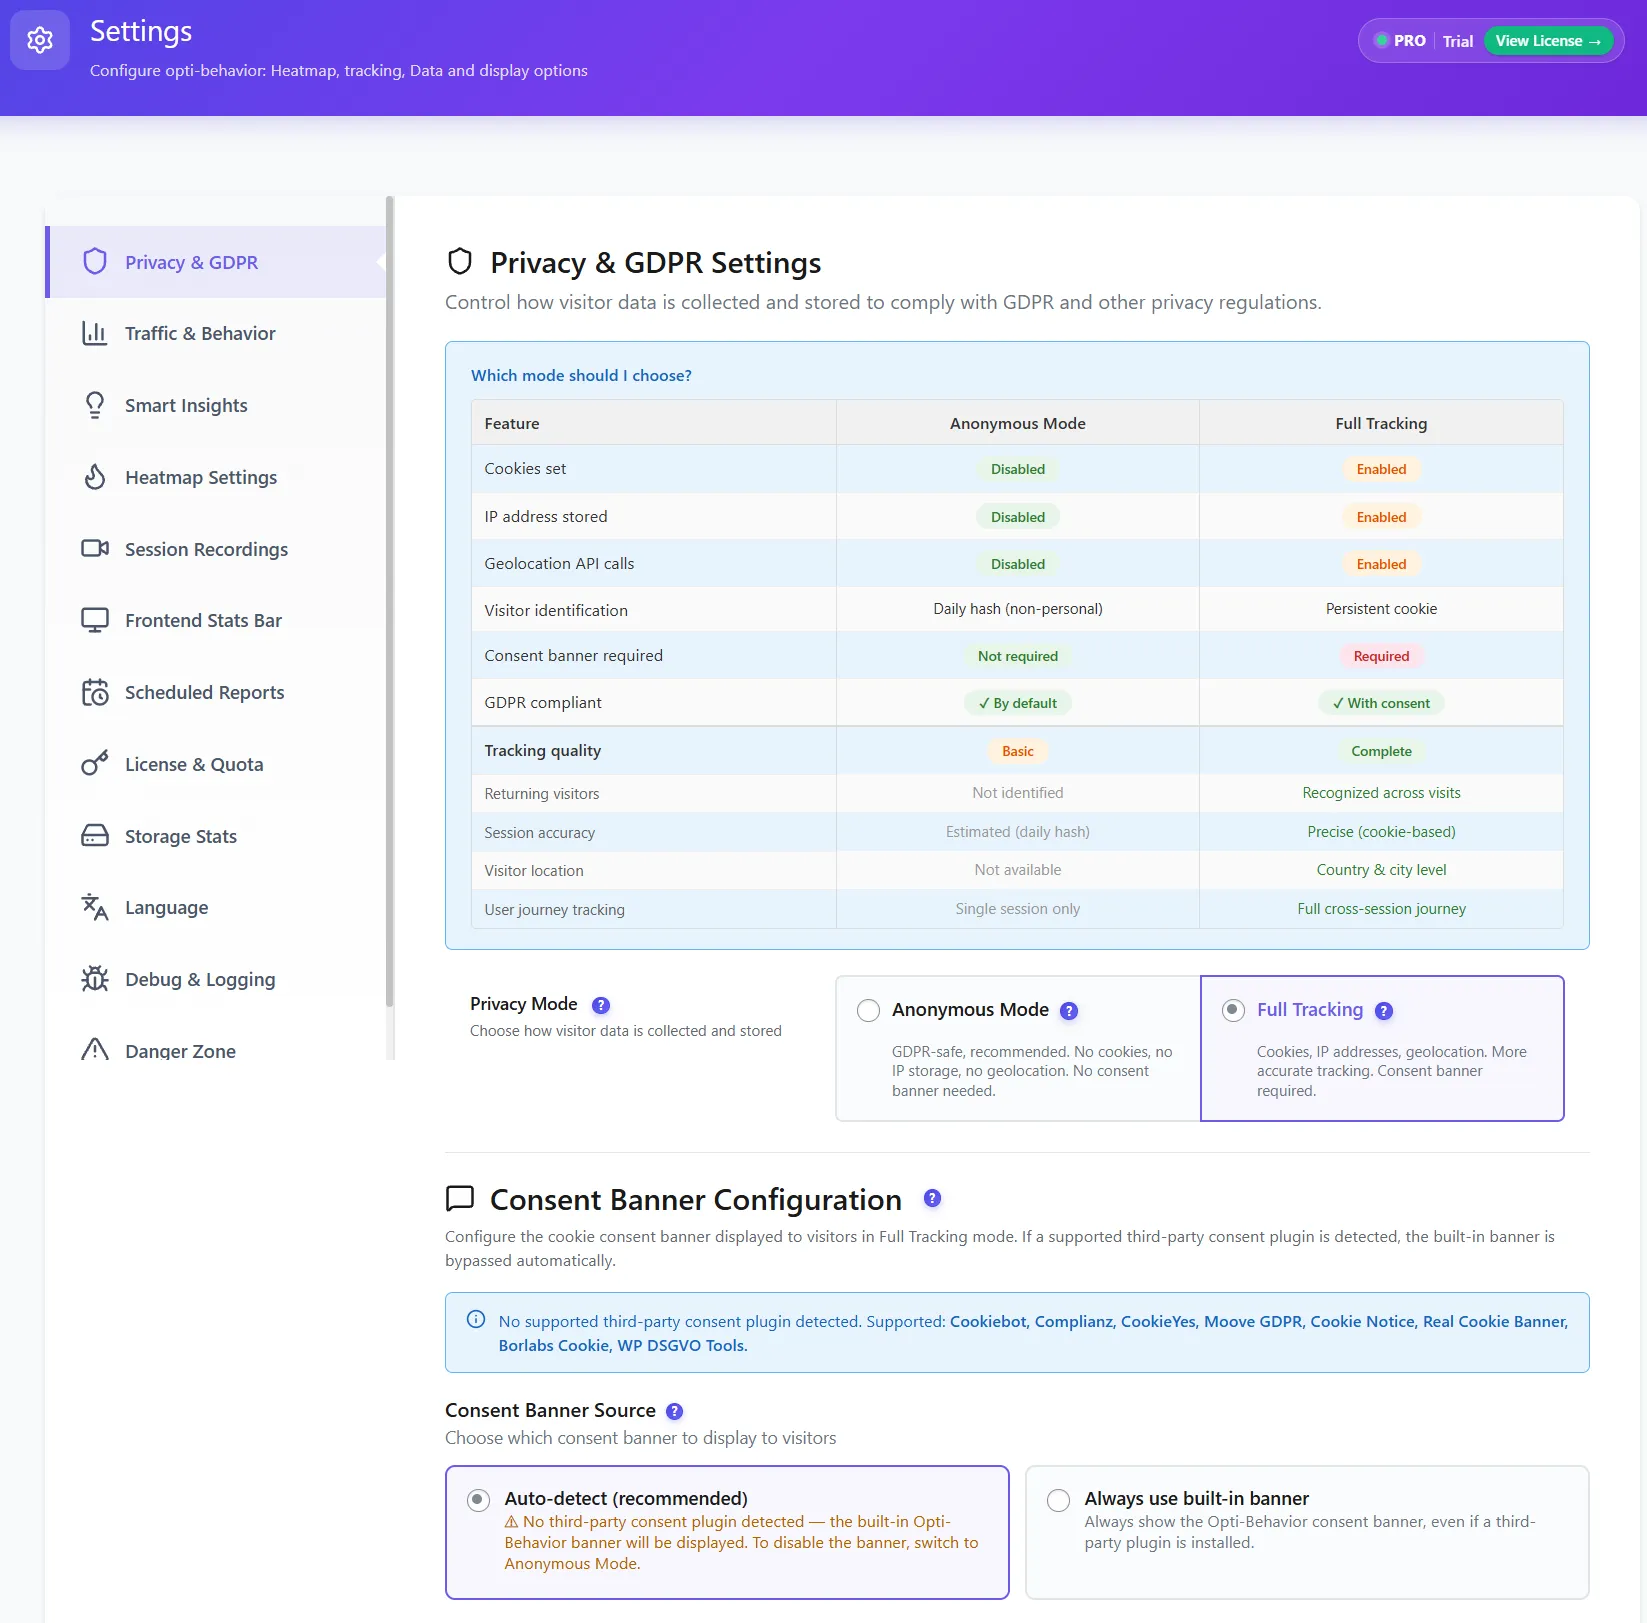
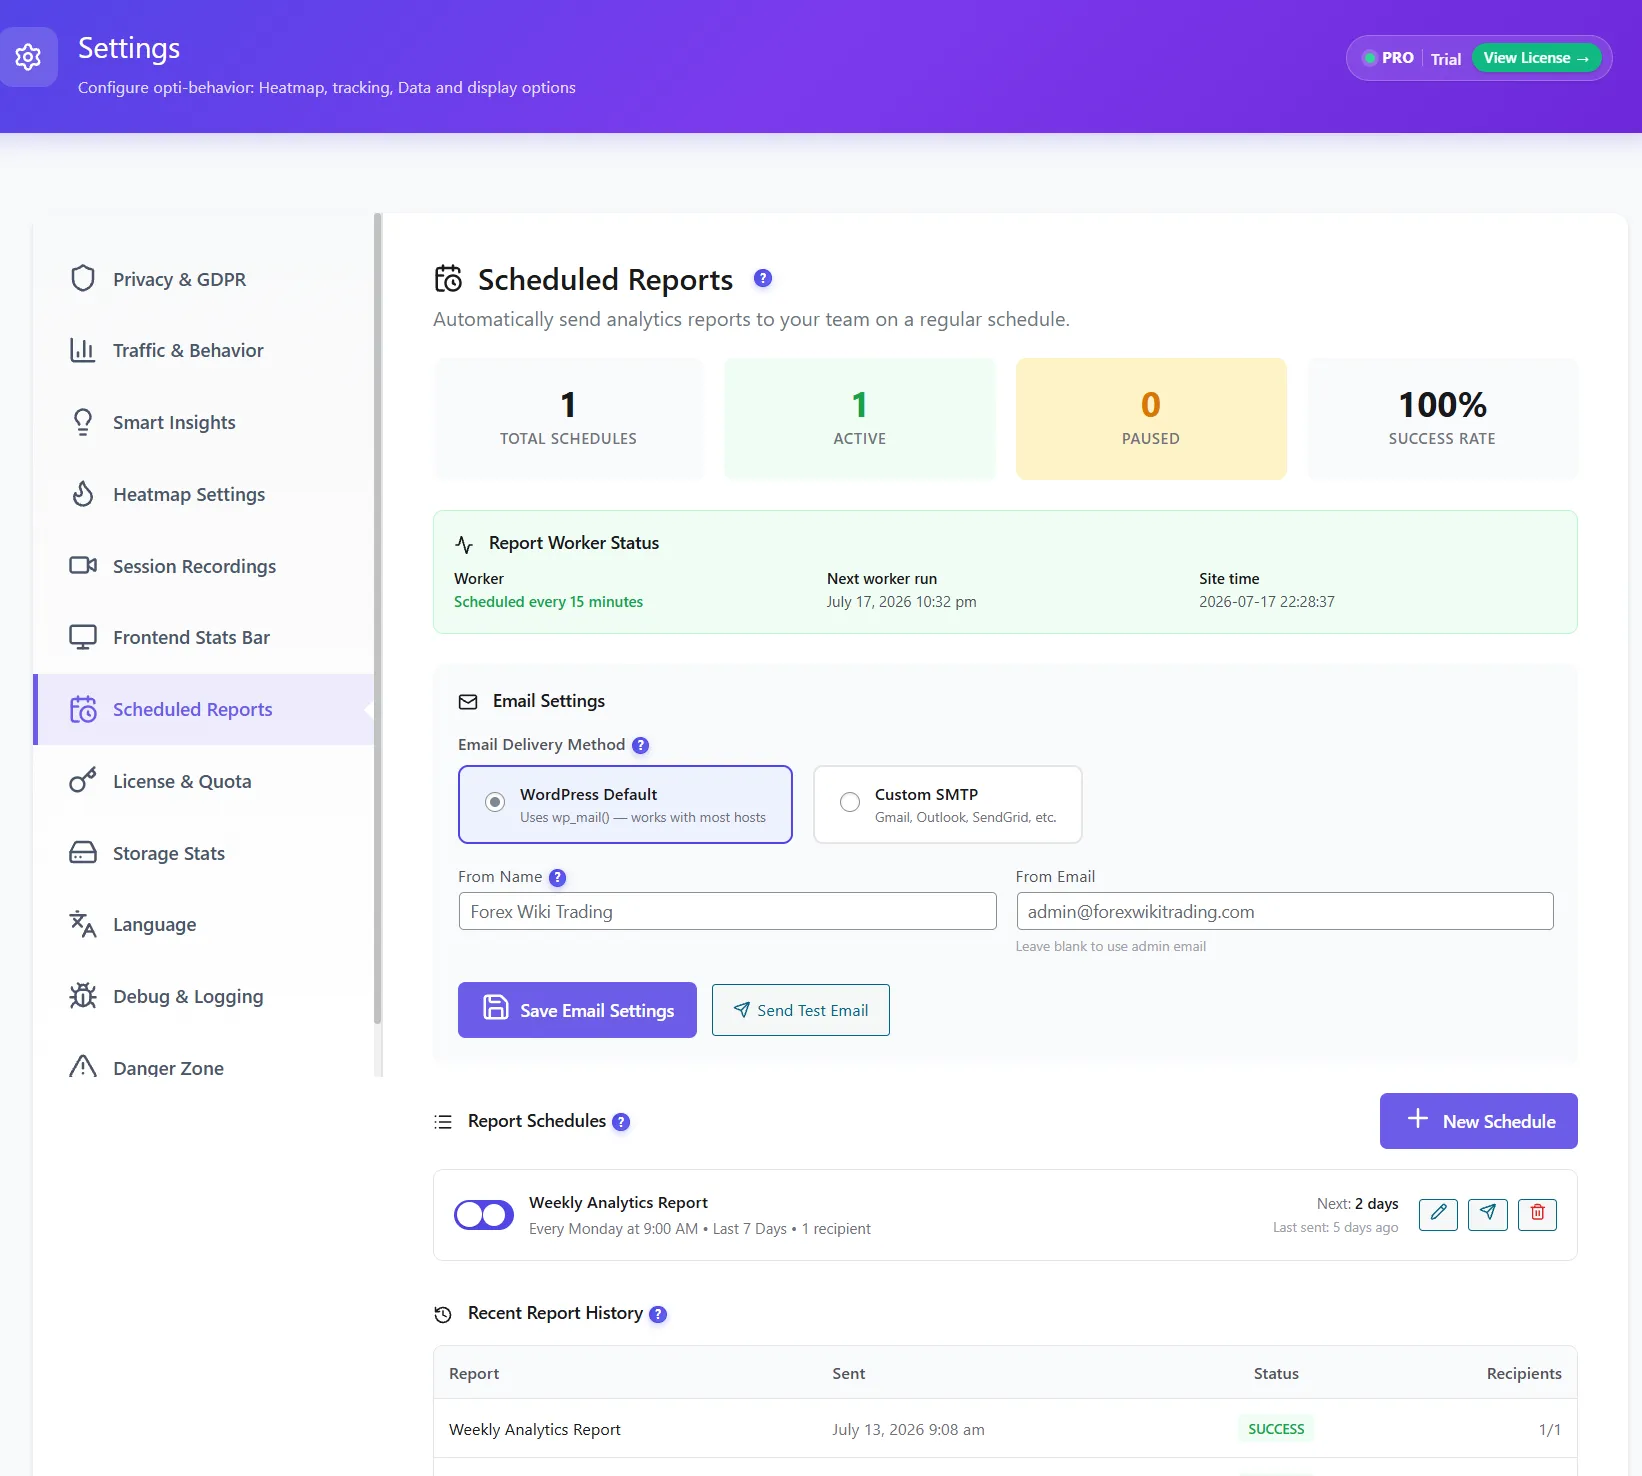
Reports and privacy, built inScheduled email reports (daily, weekly or monthly), consent-banner detection, cookieless mode, IP anonymization. Defaults are safe; everything is adjustable.
FREE
Complete Settings & Control
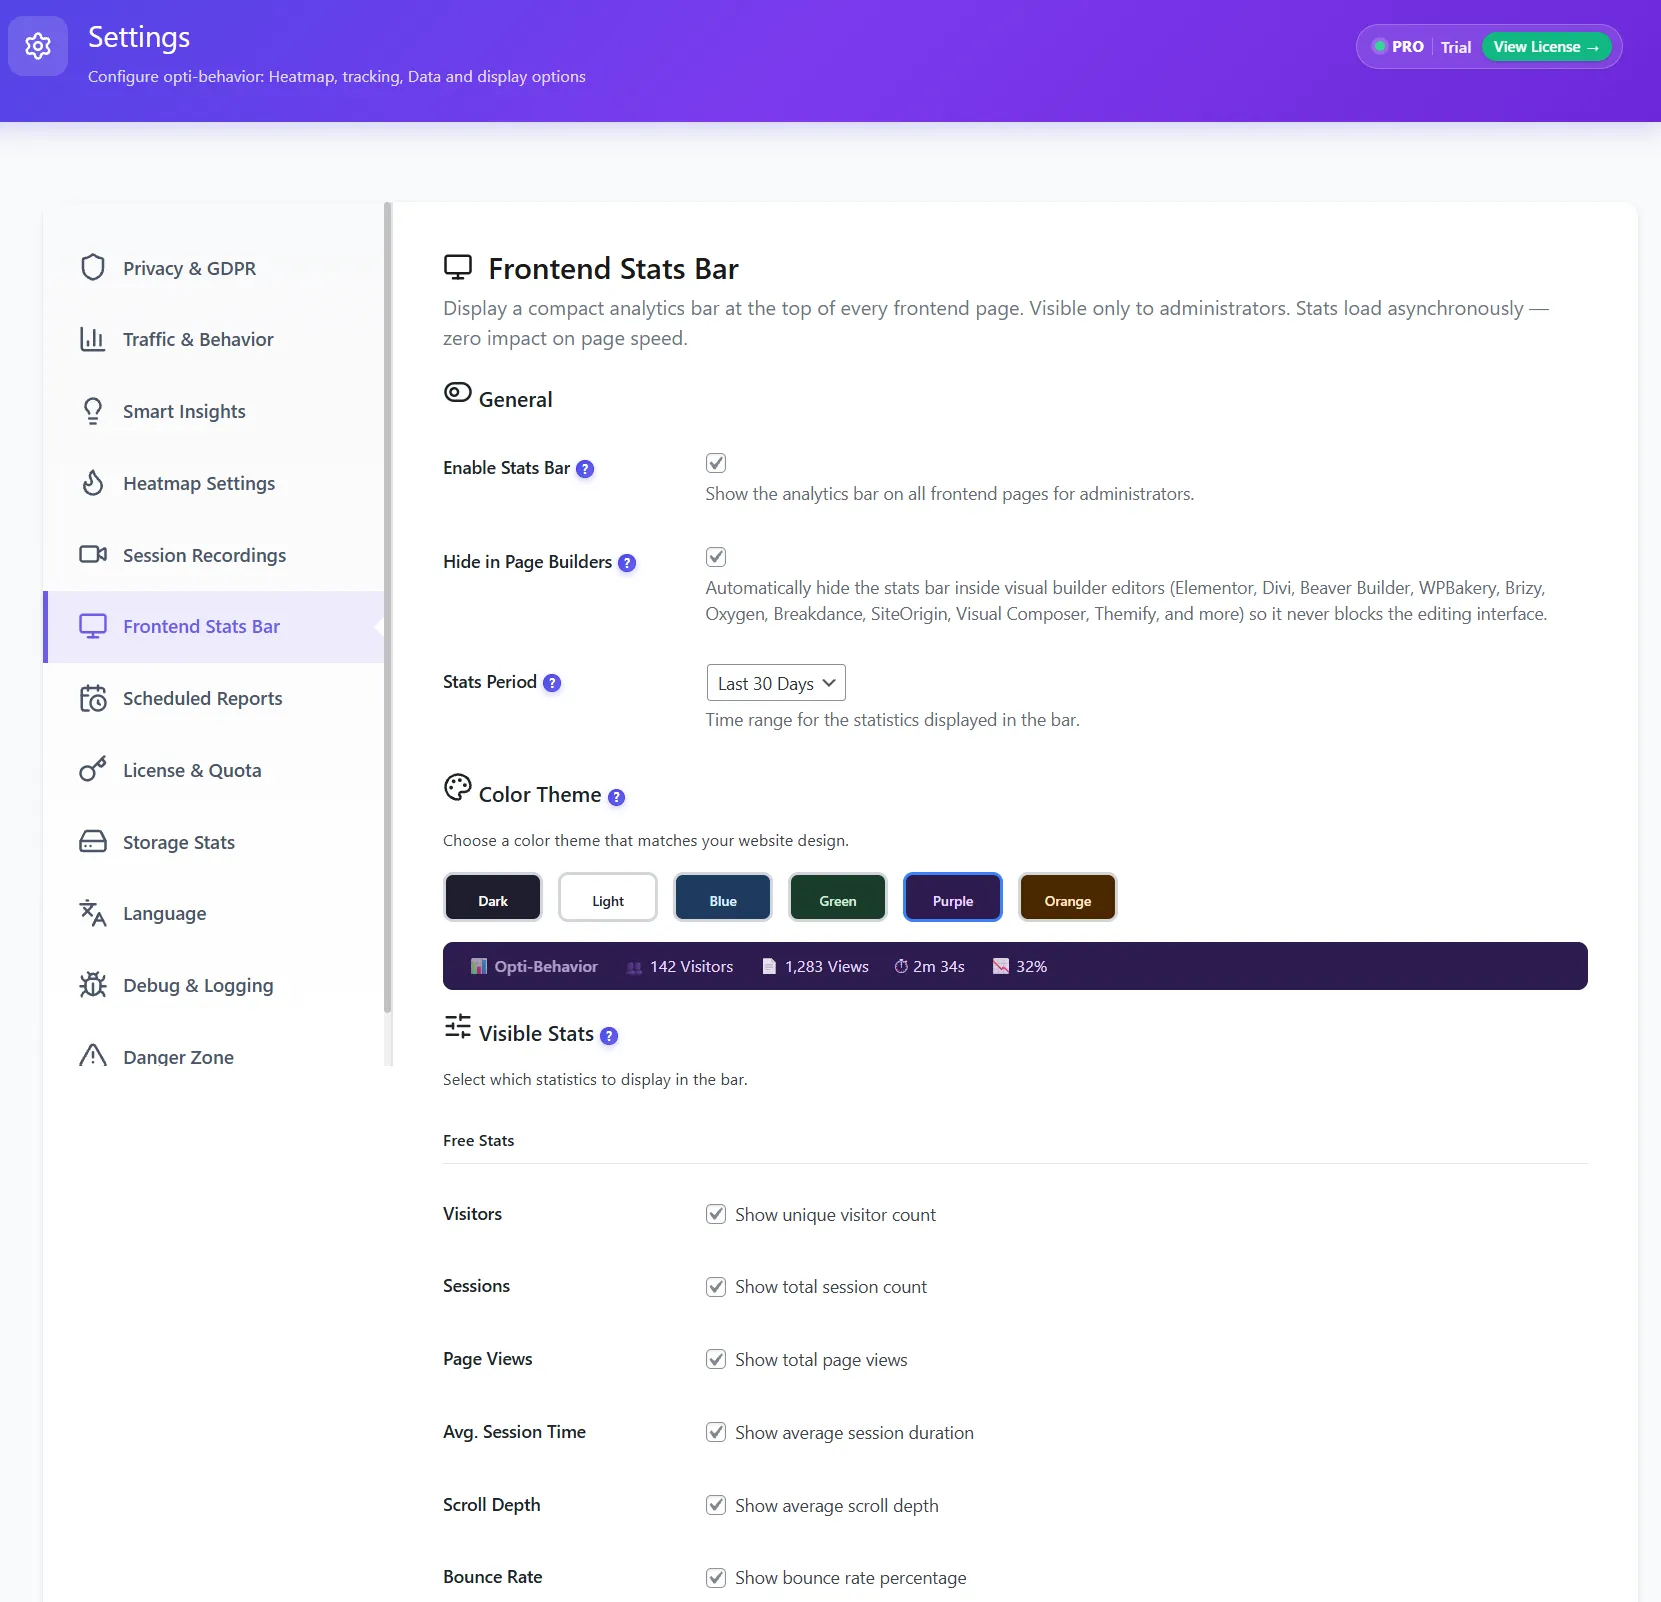
10 dedicated settings pages — fine-tune every aspect of your analytics, privacy, storage, scheduling, and data management. Full control, always on your server.
Privacy settings — Anonymous mode or full tracking. Consent detection for the cookie plugins listed below
A compact analytics overlay displayed at the top of every frontend page — visible only to logged-in administrators. Stats load asynchronously so your visitors never see it and your page speed is never affected.
Every plan includes unlimited sessions, unlimited heatmaps, unlimited funnels, and self-hosted Smart Insights.
One flat price. No per-session tiers, no sampling, no seat fees. Powered by our Hybrid Storage engine.
Founding 5 · First 5 agencies get a 1h founder onboarding call & early access to upcoming agency features
Free trial (6 months), then a refund window of up to 30 days
The 30 days count from the first Pro activation on your site, trial days included.
No trial used? You have 30 days after payment.
Full rules in the Refund Policy.
Growing on WordPress.org
Live public plugin-directory proof. Real installs, real reviews, no fake social proof.
ACTIVE INSTALLS
1000+
Public WordPress.org install count
WORDPRESS.ORG RATING
5/5
5 verified 5-star reviews
LATEST FREE RELEASE
1.10.1
Latest Free Core changelog release · 2026-10-20
M
mariamilanoVerified — WordPress.org★★★★★
“Honestly didn’t expect much when I installed this.
There are so many analytics plugins that promise everything and deliver nothing.Been using it for 3 days now. The thing that actually surprised me was the form analytics. I’ve never seen a WordPress plugin that shows you exactly how people interact with each field, how long they stay on it, where they stop and leave. Found a real issue on my contact form in like 20 minutes. One field was killing my submissions and I had no idea.Everything runs on my own server which was important to me. Not a fan of sending my visitors’ data to Microsoft or whoever.Still waiting for the WooCommerce features they mentioned. That’s the main reason I’ll be sticking around. If that works half as well as the form analytics, it’ll be worth it.”
“I got to test the Pro plan for free and honestly… I’m blown away!
😄Opti Behavior is a real all-in-one beast for understanding your website traffic. It shows you exactly how people are moving around your site and, most importantly, what you actually need to optimize to make things better.”
“I installed Opti-Behavior on one of my WordPress sites because I wanted to understand why people were leaving a page that I thought was clear.
After checking the heatmap and scroll data, I noticed that visitors were not really reaching the section I expected them to see, and some clicks were happening in places I didn’t expect.The setup was not complicated, and I liked that I could see everything directly inside WordPress instead of opening another platform. For me, the most useful part is that it shows behavior in a visual way, not just numbers. It helped me make a few small changes to the layout and move an important button higher on the page.I’m still testing it, but so far it feels practical and useful, especially for improving pages based on real visitor behavior instead of just guessing.”
“I’ve tested many analytics plugins, and Opti-Behavior is one of the most impressive.
It brings a clean, native WordPress analytics experience without unnecessary complexity.The developer is also amazing & very responsive, open to feedback, and genuinely cares about users. I suggested a few features for the free version, and some of them were actually added. That level of support is rare.Highly recommended.”
“J’ai installé opti-behavior depuis 3 mois et j’ai vraiment changé mon avis à propos de la notion d’analytics classique…
…par rapport aux visites et au comportement des utilisateurs.Je suis surpris, pendant cette période, par certains comportements étranges de mes visiteurs sur la page de Opt-in . Avec les heatmaps, j’ai compris que le formulaire était complexe et que je perdais beaucoup de personnes.J’ai aussi profité du module A/B testing et j’arrive à optimiser mon CRO et à collecter beaucoup de leads pour ma liste marketing.Mon site collecte environ 30K visiteurs par mois pour le moment et je n’ai pas constaté d’impact sur mon hosting.Jusqu’à là, le produit est solide. À voir après 1 an d’utilisation.”
“Early versions (before 1.9.1) focused on adding features – *lots* of them.
Impressive as that was, they dented Lighthouse performance a *little*. After a brief word with the (very helpful) team, they soon fixed that. Providing such rich, privacy-focused analytics data within the admin area, yet with *zero* significant impact on site speed and no connections to external services, is impressive. Definitely worth trying if you’re serious about optimising your site.”
“I’ve been using Opti-Behavior since its early days and have had the chance to try many new features along the way.
The developer is incredibly responsive, takes feedback seriously, and delivers updates impressively fast.
The feature set is huge and could replace several plugins we’ve paid significantly more for. The focus on data privacy is another big plus for us.
A fantastic plugin with genuinely outstanding support. Highly recommended, and a big thank you to the developer!”
It’s designed not to. The tracking script loads 100% asynchronously and never blocks rendering. The Hybrid Storage engine writes events to optimized files instead of your database, and daily stats are pre-aggregated. Real-world performance depends on your hosting and traffic — you can measure it yourself with Lighthouse before and after install.
Where is visitor data stored?
On your own WordPress server, and no cookies are required. Whether your site needs a consent banner depends on everything else it runs, so check with your legal adviser.
How is the free version really free?
Open source and community-driven. We fund development through Pro features. The free version is GPL and has no artificial limits.
Is Smart Insights included in Free?
Yes. Free includes self-hosted Smart Insights core recommendations from your Opti-Behavior signals. The Weekly CRO Summary and the per-audience segment breakdown are Pro features (Free shows a locked preview). Pro also enriches each recommendation with evidence and links into recordings, forms, errors, journeys, funnels, and A/B tests so teams can jump directly to the supporting report.
Does this work with my caching plugin?
Yes. Fully compatible with WP Rocket, W3 Total Cache, LiteSpeed Cache, and all major caching plugins.
Show all questionsDoes this work with WooCommerce?
Yes. Track checkout funnels, product page heatmaps, cart abandonment analytics, and form submissions across your entire store.
What form plugins are supported?
Contact Form 7, WPForms, Forminator, Ninja Forms, Everest Forms, SureForms, and any standard HTML form.
Are there any session or pageview limits?
No. Track unlimited sessions, pageviews, and heatmaps. No artificial caps, no throttling, no surprise fees.
Does this work on multisite?
Yes. Full WordPress Multisite compatibility with network-wide analytics support.
What data does the plugin collect?
Depending on your settings: page views, clicks, scrolls, form interactions, JavaScript errors, and performance metrics. IP addresses can be fully anonymized (Anonymous Mode stores no personal data at all), form field values and passwords are never captured.
Can I delete all data when uninstalling?
Yes. The complete uninstall option removes all database tables, stored files, and plugin settings. Clean removal guaranteed.
Ready to Own Your Analytics?
Join WordPress site owners who stopped paying monthly fees, stopped sharing their data, and started making better decisions.
Free plugin · Pro Trial: 6 months FREE · Paid plans from €0.24/day · Refund window: 30 days from first Pro activation, trial included · Works with any theme


 WordPress
 WooCommerce
 WP Rocket
 LiteSpeed Cache
 W3 Total Cache
 WP Super Cache
 Autoptimize
 SG Optimizer
 Perfmatters
 WP-Optimize
 Jetpack Boost
 Breeze
 WP Fastest Cache
 Hummingbird
 NitroPack
 FlyingPress
 Cache Enabler
 Swift Performance
 Asset CleanUp
 Elementor
 Divi
Divi Beaver Builder
 WPBakery
 Gutenberg
 Oxygen
 Brizy
Brizy Breakdance
 SiteOrigin
 Astra
Astra GeneratePress
 Kadence
 Themify
 MotoPress
 Live Composer
 OceanWP
 Blocksy
 Neve
Neve Cookiebot
 Complianz
 CookieYes
 Moove GDPR
 Cookie Notice
 Real Cookie Banner
 Borlabs Cookie
 WP DSGVO Tools