
What full behavioral analytics actually costs in storage — measured on a live WordPress site running Opti-Behavior.
Opti-Behavior’s database grew about 6.3 MB per day at 1,725 sessions per day, or roughly 1.45 KB per page view, with heatmaps, session recordings, funnels, A/B tests, user journeys, form analytics and error tracking all enabled.
Every WordPress analytics plugin promises it is “lightweight.” Almost none of them publish numbers. This article publishes numbers, then explains the architecture behind them, so you can check the claim against your own site instead of trusting a marketing page.
Click around a real dashboard before you install anything
A live WordPress site with real traffic, real heatmaps and real recordings. No signup, no credit card, no email.
Open the live demo →The short version
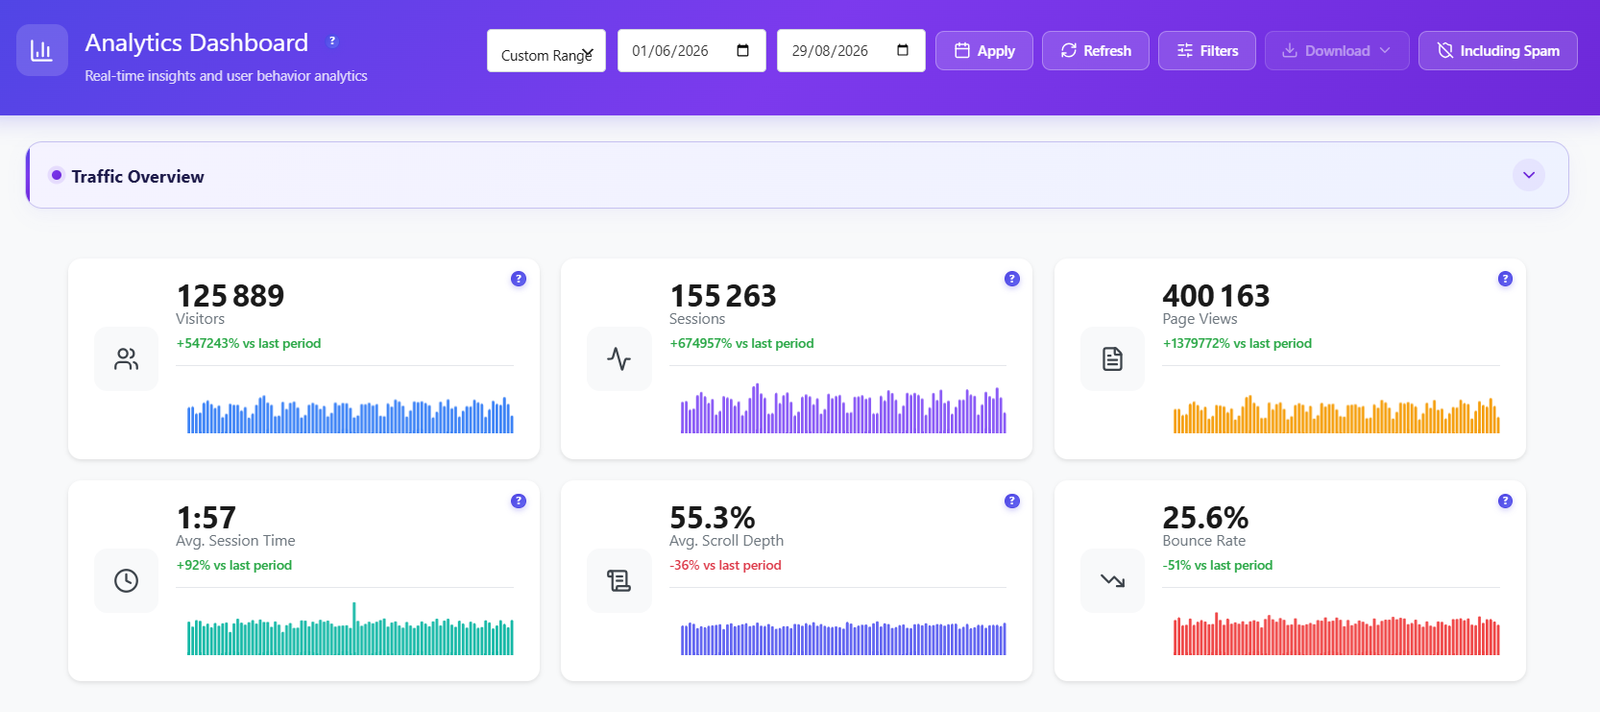
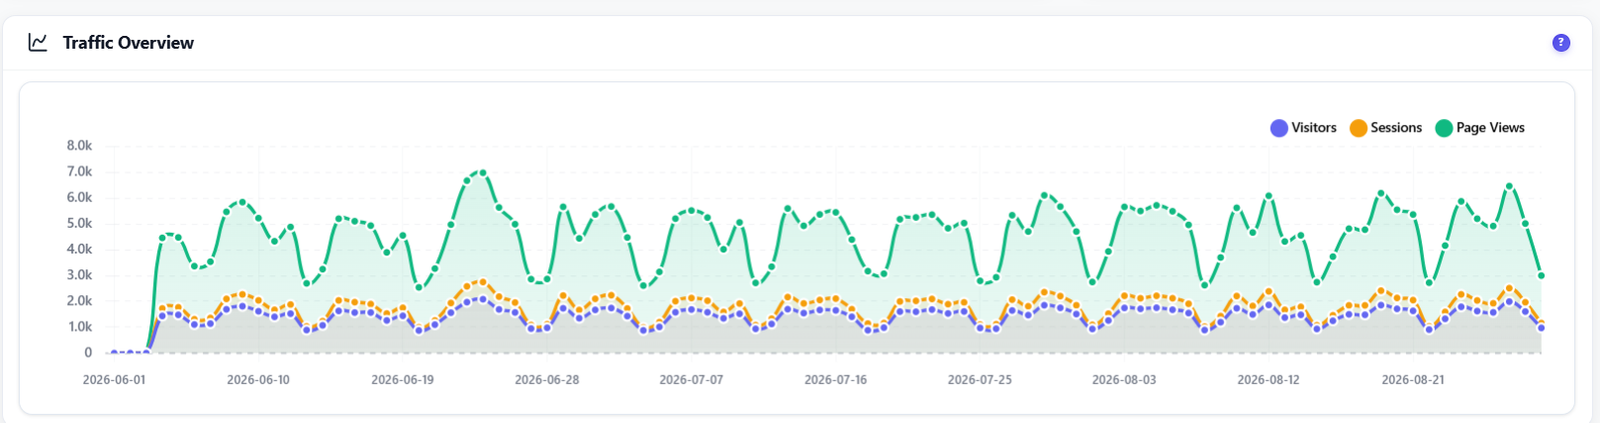
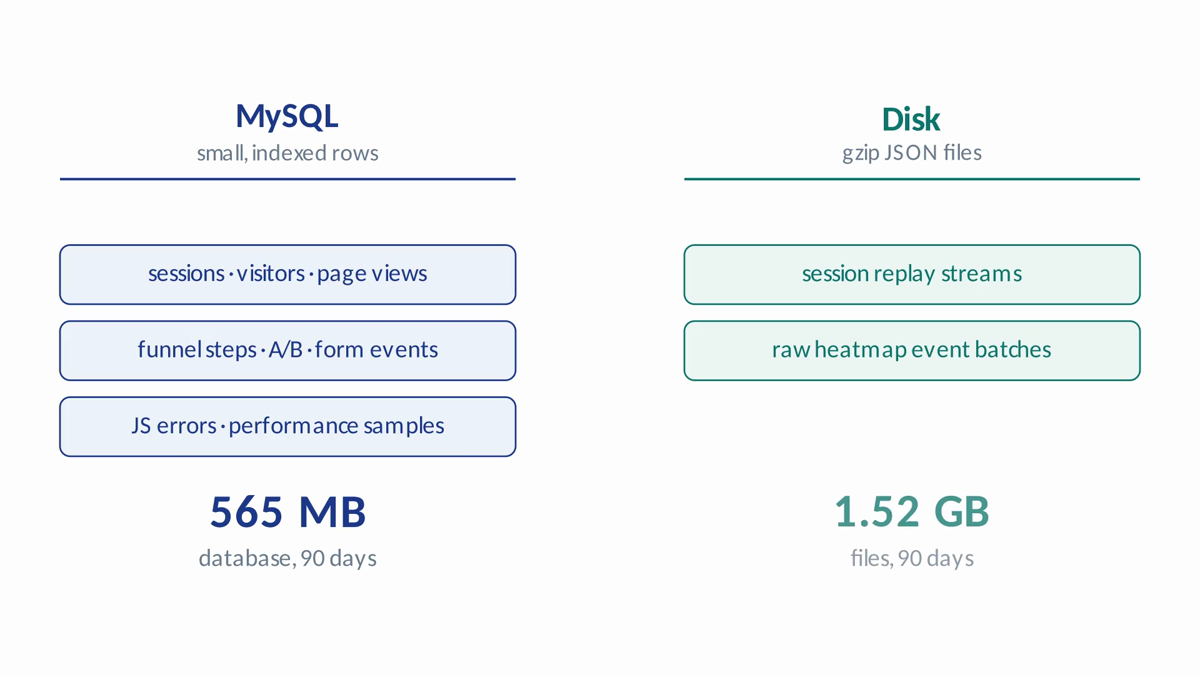
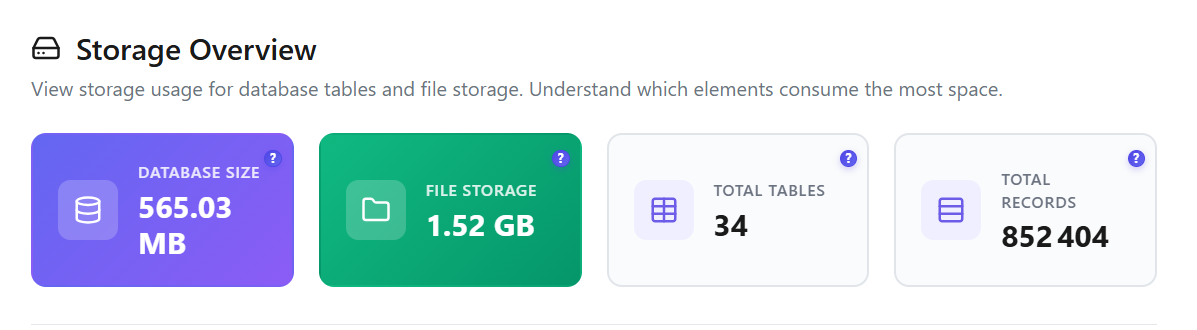
Opti-Behavior is a self-hosted WordPress analytics plugin that stores small, indexed metadata in MySQL and pushes heavy payloads — session recordings and raw heatmap event streams — into gzip-compressed JSON files on disk. On a live site running every module for 90 days, Opti-Behavior used 565 MB of database and 1.52 GB of file storage to track 400,163 page views:
| Metric | Value |
|---|---|
| Period measured | 1 June – 29 August 2026 (90 days) |
| Visitors | 125,889 |
| Sessions | 155,263 (≈1,725/day) |
| Page views | 400,163 (≈4,450/day) |
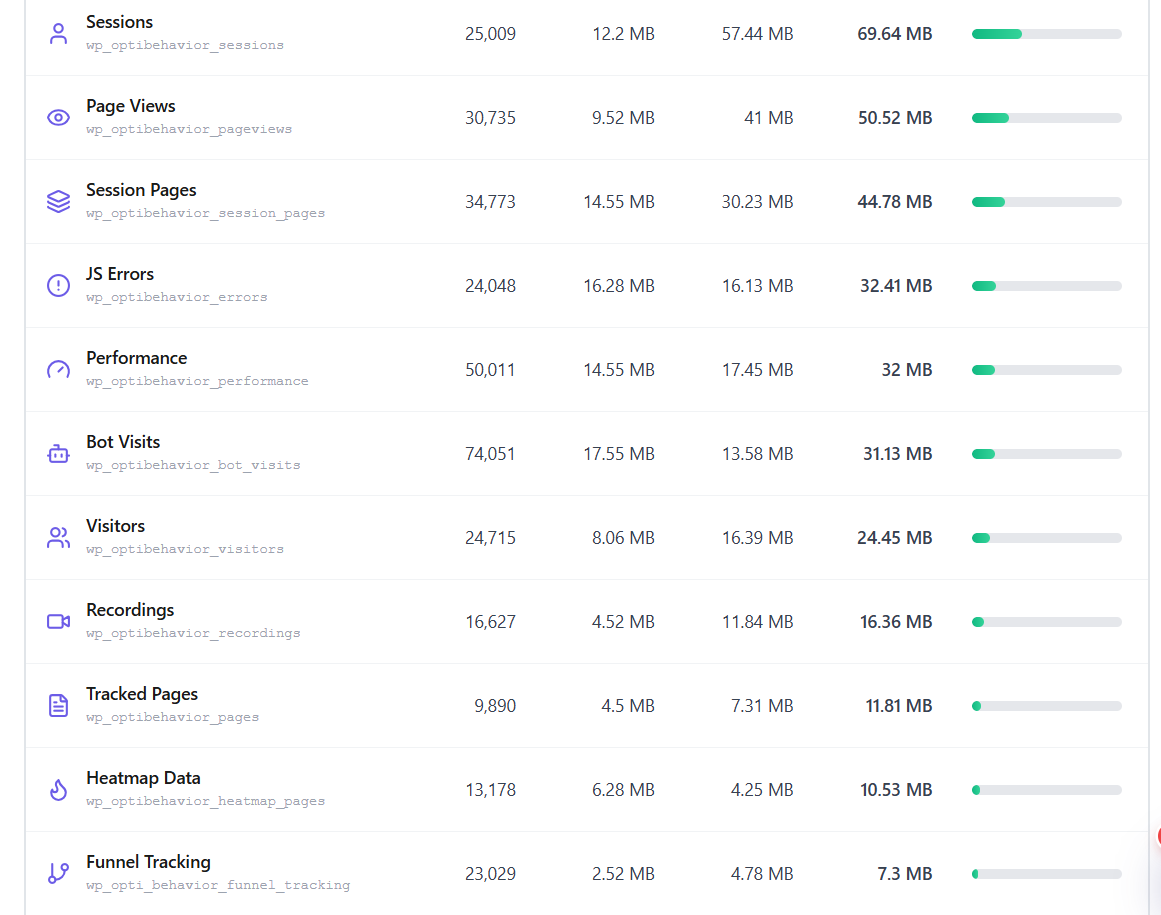
| MySQL footprint | 565 MB across 34 tables (852,404 rows) |
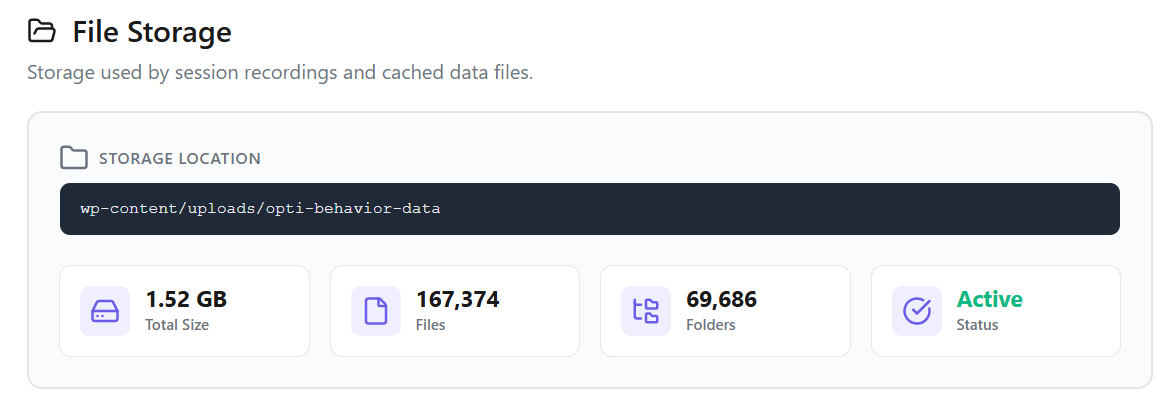
| File storage footprint | 1.52 GB |
| Total footprint | ≈2.07 GB |
| Database growth per day | ≈6.3 MB |
| Database cost per page view | ≈1.45 KB |
| Total cost per session (everything included) | ≈14 KB |
| Est. cost per session (DB / files) | ≈3.7 KB DB / ≈10.3 KB files |
| Average stored session recording | ≈69 KB compressed |
Session recording is the expensive module: 16,627 stored replays account for roughly 1.1 GB of the 1.52 GB on disk. Everything else — every click, scroll, attention sample, funnel step, A/B impression, form interaction, JS error and performance sample — fits in the remaining ~500 MB of files and 565 MB of database.
That is the whole claim. The rest of this article explains how.
The problem: why analytics plugins wreck WordPress databases
The default design for a WordPress tracking plugin is one MySQL row per event. It works beautifully in a demo and collapses in production, for three predictable reasons.
Rows scale with engagement, not traffic. A single 90-second session with a mouse, a scroll and a form generates hundreds of coordinate samples. At 1,700 sessions a day, a naive one-row-per-event schema writes tens of millions of rows a month into the same MySQL instance that serves your pages.
Big rows poison the buffer pool. Session replay payloads are hundreds of kilobytes of JSON. Stored as LONGTEXT next to your posts and options, they evict the pages MySQL actually needs cached. Your site does not slow down because the plugin is querying — it slows down because everything else stopped fitting in memory.
Read-modify-write kills long sessions. A session that is still being recorded has to be updated repeatedly. If each update reads the entire accumulated payload, merges, re-sorts, re-compresses and rewrites it, the cost of storing a session grows with the square of its length. The longest, most valuable sessions become the most expensive ones.
Every design decision below exists to defeat one of those three failure modes.
Design 1: hybrid storage — MySQL for questions, files for payloads
The rule is simple: if you query it, it lives in MySQL. If you only ever replay it, it lives on disk, compressed.
| Data | Where it lives | Why |
|---|---|---|
| Sessions, visitors, page views, session pages | MySQL (indexed) | Filtered, grouped and joined on every dashboard load |
| Funnel steps, A/B impressions and conversions, form interactions | MySQL | Aggregated in real time |
| JS errors, performance samples, traffic sources | MySQL | Queried by page, date and type |
| Recording metadata (session id, duration, event count, page) | MySQL (small row) | Powers the recordings list and search |
| Recording event streams (rrweb DOM mutations) | gzip JSON file | Only ever read once, whole, at playback |
| Raw heatmap event batches (clicks, moves, attention) | gzip JSON file | Only ever read to render one page’s heatmap |
Daily aggregates (daily_stats, daily_dimension_stats, heatmap_daily, ab_daily_stats) | MySQL (tiny) | Serve all historical charts |
Files are written under wp-content/uploads/opti-behavior-data, sharded into date and hour folders so no single directory ever holds a pathological number of entries, and compressed with zlib at level 9. The compression ratio on rrweb output is severe — DOM mutation streams are extremely repetitive — which is why a full session replay averages 69 KB on disk instead of the 1–3 MB it occupies uncompressed.
The consequence for MySQL is the number that matters: the database grows about 6.3 MB per day at 1,700 sessions per day, and it grows in small, indexed, cache-friendly rows.
Design 2: append-only writes, so long sessions stay cheap
The naive way to update a growing recording is: read the whole file, decompress it, merge the new events, re-sort everything, recompress at level 9, rewrite the file. Every save. That is O(N²) work over the life of a session, and it is the single most common reason session-recording plugins are described as “heavy.”
Opti-Behavior writes the base recording file exactly once. Every subsequent batch of events is appended as one NDJSON line to a sidecar file (.oblog), while a second tiny sidecar (.obidx) carries running counters — event count and duration — so that size and event caps stay enforceable in constant time without ever re-reading the payload.
The merge and the sort happen once, at read time, when someone actually opens the replay. Writes are appends. A four-minute session and a forty-minute session cost the same per event.
Design 3: a tracker that never fights the main thread
Client-side cost is where “lightweight” claims usually quietly die. The tracker is built around four constraints:
Passive listeners everywhere. Every mousemove, scroll and click listener is registered as passive, so the browser is never forced to wait on tracking code before it can scroll or paint.
Batching, not chatter. Events accumulate in memory and flush on an interval or a size threshold, not per event. Batches are capped deliberately, because uncapped 8–10 MB payloads are exactly what pushes a 128 MB shared host into an HTTP 500.
Compression in the browser, streaming. Payloads are gzipped before they leave the page using the native CompressionStream API — the browser’s own streaming compressor, not a JavaScript zlib implementation blocking the main thread. Less bandwidth for the visitor, less CPU on the server, no jank. Where CompressionStream is unavailable, the tracker falls back to plain multipart upload with a lower size ceiling rather than trying to compress in JS.
Delivery that survives navigation. Flushes use navigator.sendBeacon, falling back to fetch with keepalive. The tracker never holds up unload, and it never needs to, because it is not asking the page to wait.
The scripts also declare data-cfasync="false" and ship a dedicated compatibility layer for WP Rocket, LiteSpeed Cache, SG Optimizer and the other big optimizers — because the fastest tracker in the world is still slow if your caching plugin concatenates and defers it into the wrong execution order.
Design 4: a dashboard that queues its own queries
Write performance is half the story. The other half is what happens when you open an analytics dashboard holding 850,000 rows and 167,000 files.
The obvious implementation — fire every widget’s AJAX request at once with Promise.all — is the wrong one. Six heavy GROUP BY scans launched simultaneously against a cold InnoDB buffer pool on shared hosting thrash the disk, and every one of them finishes slower than if they had been drip-fed. Parallelism past a certain point is not speed; it is congestion.
So the dashboard schedules instead:
- Bounded concurrency. A small pool caps how many widget queries are in flight at once. Same widgets, same data, steady database.
- Parallel within a section, sequential between sections. Section one loads its widgets together, then arms the next section, ascending, one list at a time.
- Zero AJAX for what you haven’t opened. Collapsed sections fetch nothing until you click the chevron; that first click arms the cascade for the rest.
- Dependency gating for cache affinity. Widgets that share a computed series wait for the one that primes the shared transient, so the expensive query runs once instead of six times.
Heatmap rendering uses the same philosophy against files instead of rows. A page’s heatmap can reference thousands of compressed JSON event files, so they are loaded progressively in small batches with async yields between them, keeping the UI responsive while the overlay fills in. Rendering re-projects in chunks and pauses on scroll, the loader pauses entirely when the browser tab is hidden and resumes where it stopped, and the user can stop a long load at any time.
The result is a dashboard that stays interactive on hardware where a Promise.all blast would produce a spinner and a 504.
Design 5: tiered retention — history without hoarding
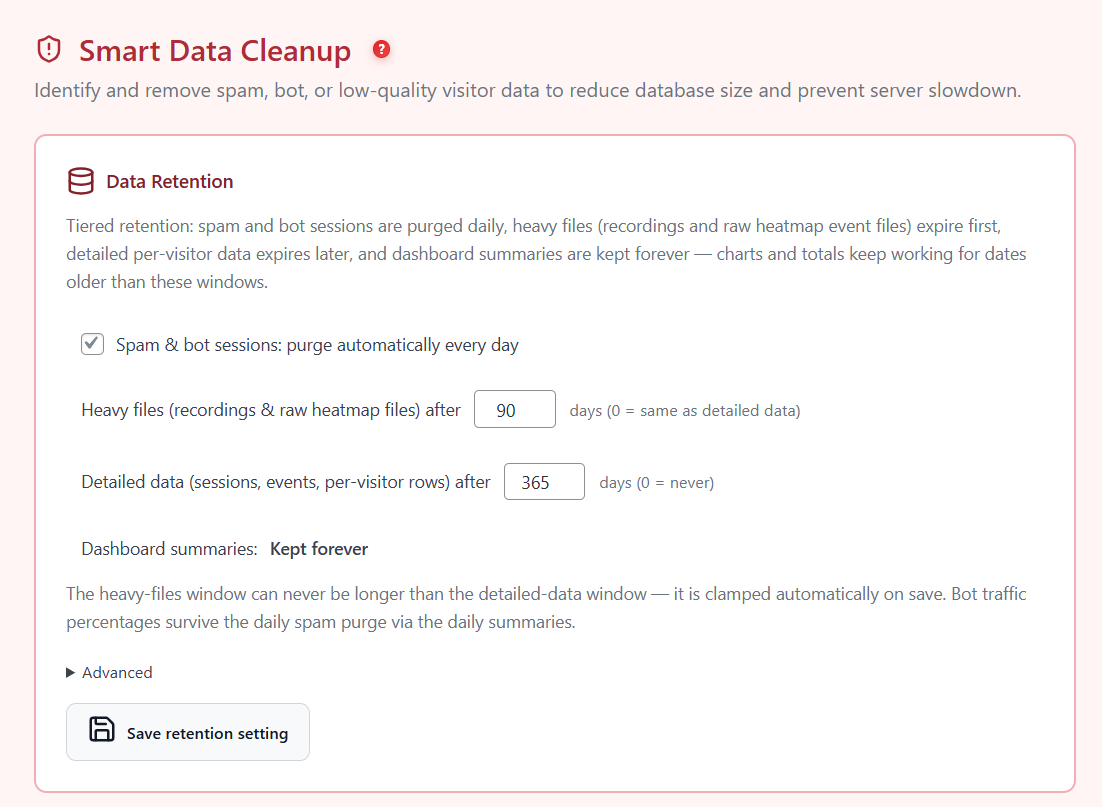
Raw data is the part that grows without bound. Aggregates are not. Opti-Behavior separates them with a four-tier retention model:
- Spam and bot sessions — purged automatically every day.
- Heavy files — recordings and raw heatmap event files expire first (default 90 days).
- Detailed data — sessions, events, per-visitor rows expire later (default 365 days).
- Dashboard aggregates — daily stats tables are kept forever.
The file window is clamped so it can never outlive the detailed-data window, and files are never orphaned: they are removed in the same cascade as their database rows.
This is why the database on the measured site holds roughly 25,000 detailed session rows while the dashboard confidently reports 155,263 sessions over the same 90 days. Spam and bot sessions are deleted as raw rows — with their events, recordings and files, in one cascade — but the per-day counts survive in the daily aggregates, including the spam and automated session counts that produce your bot-traffic percentages.
That is the trade in one sentence: you keep the number, you drop the carcass. You can still answer “how many bot sessions hit this site in June” a year later, for the cost of one row per day, without storing a single one of those sessions.
That decoupling is the actual answer to “will this plugin still be fast in two years.” Detailed data has a horizon. Aggregates are permanent and cost kilobytes.
The safety valve: a cleanup that refuses to run
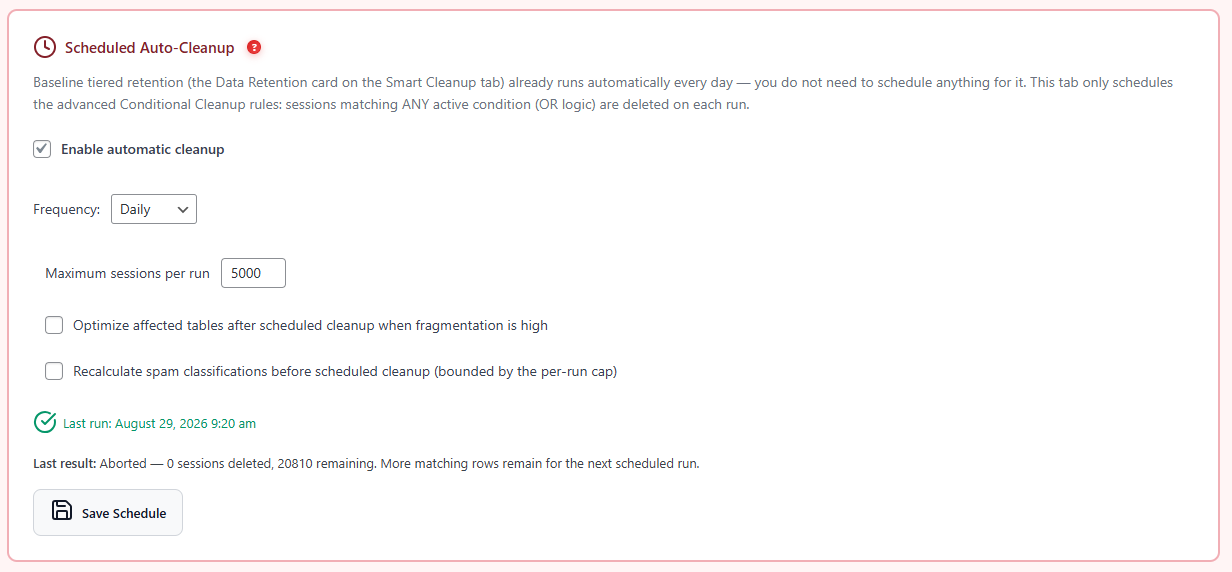
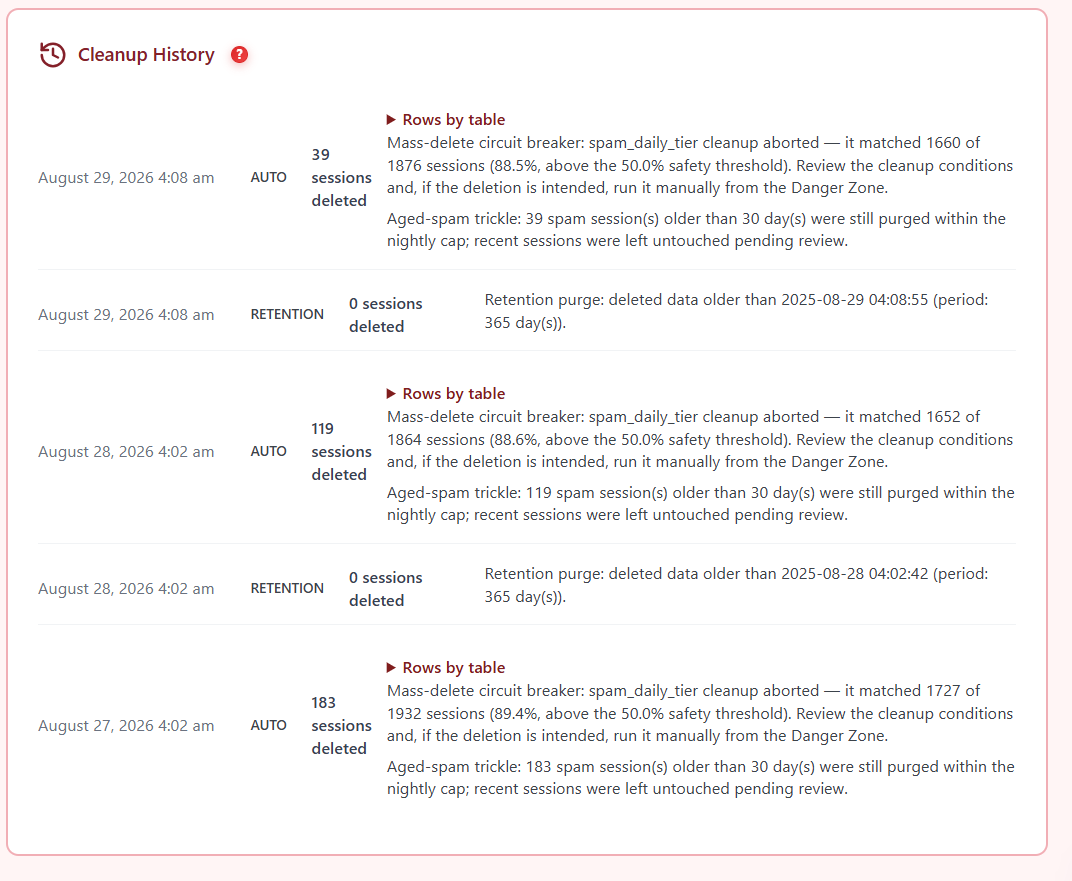
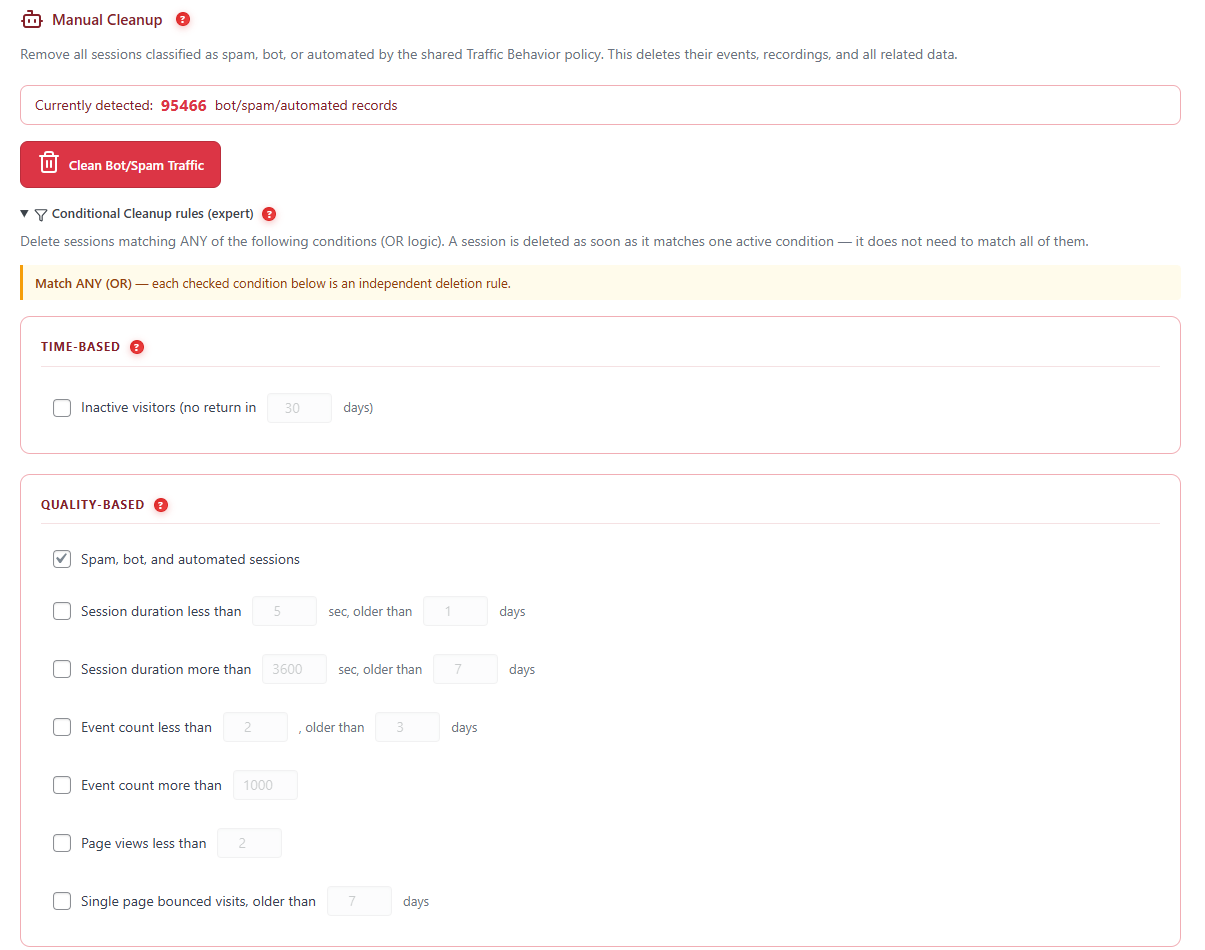
Automatic deletion is dangerous, and Opti-Behavior treats it that way. Every automated cleanup pass — the daily spam tier and any scheduled conditional rule — first measures what share of the sessions table it is about to delete. If that share exceeds 50%, the run aborts and logs a warning instead of deleting anything, on the assumption that a rule matching most of your data is a misconfigured or misfiring rule, not a legitimate purge. Manual cleanups from the Danger Zone are deliberately not gated: an explicit human confirmation is allowed to do what an unattended cron job is not.
Because a permanently tripped breaker would let flagged rows accumulate forever, a second rule runs underneath it: while the breaker is tripped, spam sessions older than 30 days are still aged out oldest-first within the nightly cap. Misclassification incidents mislabel recent engaged sessions, so old flagged rows are safe to remove while recent ones wait for review. The database can never grow without bound, and a bad rule can never silently erase your dataset overnight.
Every run is written to a cleanup log with its counts, its warnings and its rows-by-table breakdown, so nothing about what was deleted — or why nothing was — is a mystery.
Design 6: filter before you store, not after
The cheapest row is the one never written. A dedicated ingest gate and bot classifier run before persistence, so crawler and automated traffic is classified on arrival rather than discovered during a painful cleanup six months later. On the measured site, 74,051 bot visits are recorded as compact classification rows — not as sessions with recordings, heatmap files and event streams attached.
What this means for your hosting
Translate the per-unit numbers to your own traffic:
| Your traffic | Est. DB growth / month | Est. total footprint / month (recordings on) |
|---|---|---|
| 500 page views/day | ~22 MB | ~80 MB |
| 2,000 page views/day | ~87 MB | ~325 MB |
| 5,000 page views/day | ~215 MB | ~815 MB |
| 15,000 page views/day | ~650 MB | ~2.4 GB |
Two practical notes. First, recordings dominate the file total; sampling them or shortening the heavy-files window is the single biggest lever if disk is tight, and it costs you nothing in dashboard history because aggregates are unaffected. Second, the database column is the one your host actually cares about on shared plans — and it is the small one.
Methodology
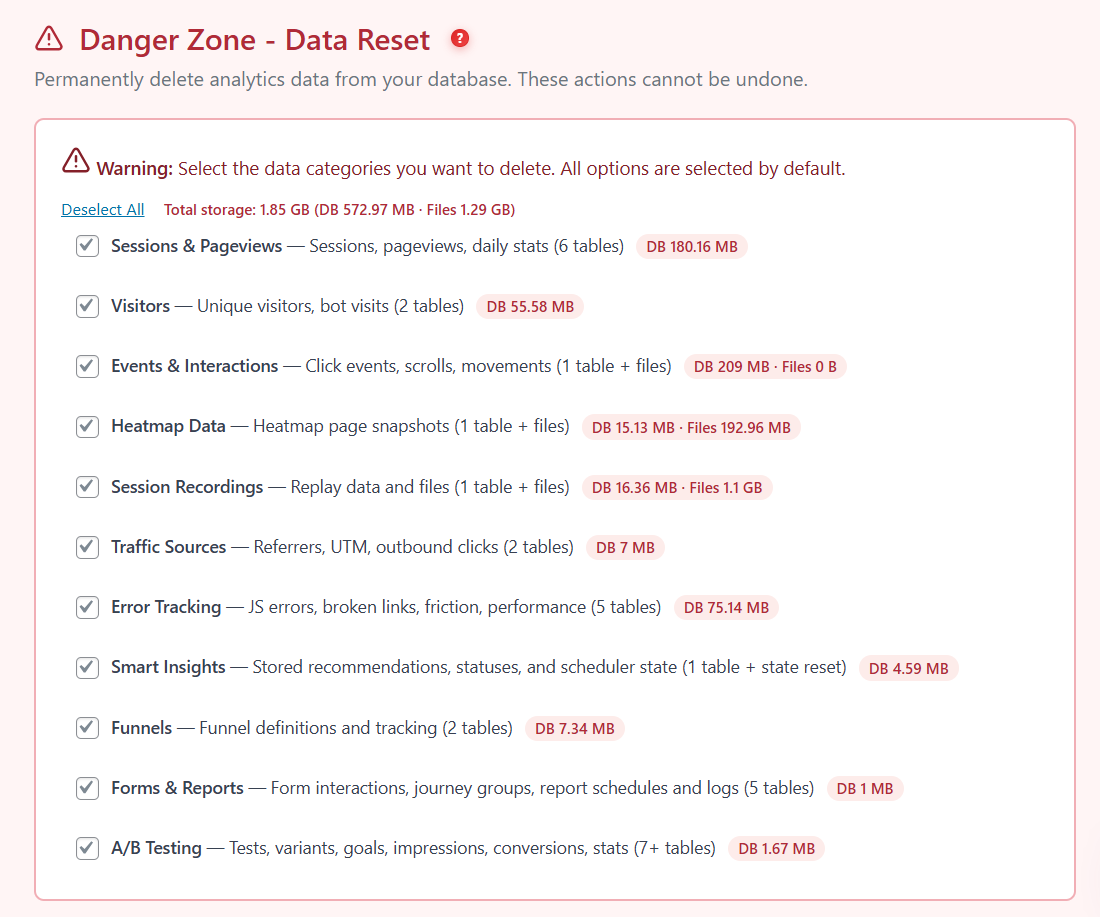
The figures come from Opti-Behavior’s own Storage Overview and Database Statistics screens on a production WordPress site, measured on 29 August 2026 over the range 1 June – 29 August 2026, with every module enabled: real-time analytics, click/move/attention heatmaps, session recording, funnels, A/B testing, user journeys, form analytics, error and performance tracking. Retention was at defaults: daily spam purge on, heavy files 90 days, detailed data 365 days, aggregates forever. Totals are the plugin’s own measurements of its tables and its data directory, not estimates.
Click around a real dashboard before you install anything
A live WordPress site with real traffic, real heatmaps and real recordings. No signup, no credit card, no email.
Open the live demo →FAQ
Does Opti-Behavior slow down my WordPress database?
It is designed so the database grows slowly and in small indexed rows: about 6.3 MB per day at 1,700 sessions per day, roughly 1.45 KB per page view. Heavy payloads never enter MySQL at all — recordings and raw heatmap events are stored as compressed JSON files outside the database.
How much disk space does Opti-Behavior use?
On a site with 400,163 page views over 90 days with every module enabled: 565 MB of database and 1.52 GB of files, ≈2.07 GB total, or about 14 KB per session including full session replay.
Where are session recordings stored?
In gzip-compressed JSON files under wp-content/uploads/opti-behavior-data, sharded by date and hour, with only a small metadata row in MySQL. A stored recording averages about 69 KB.
Does the tracking script hurt Core Web Vitals?
The tracker uses passive event listeners, batches events instead of sending one request per event, compresses payloads with the browser’s native streaming CompressionStream API, and delivers them with sendBeacon or keepalive fetch. It never blocks scrolling, painting or navigation.
What happens to my old data?
Spam and bot sessions are purged daily. Recordings and raw heatmap files expire after 90 days by default, detailed session data after 365 days, and daily dashboard aggregates are kept forever — so charts and totals keep working for dates far older than the raw-data windows. All windows are configurable.
Is the dashboard slow once there is a lot of data?
The dashboard runs its widget queries through a bounded-concurrency queue rather than firing them all at once, loads sections lazily as you expand them, and shares primed query caches between related widgets. Heatmap pages load their compressed event files in small progressive batches that yield to the browser, pause when the tab is hidden and can be stopped mid-load.
Can automatic cleanup delete data I wanted to keep?
Automated cleanup passes abort if a rule would delete more than 50% of the sessions table, logging a warning instead. While that circuit breaker is tripped, only spam sessions older than 30 days are aged out, so the database still cannot grow without bound. Manual cleanups from the Danger Zone are not gated, because they carry an explicit confirmation.
Is Opti-Behavior compatible with caching and optimization plugins?
Yes. It ships a dedicated compatibility layer for WP Rocket, LiteSpeed Cache, SG Optimizer and others, and marks its scripts data-cfasync="false" so optimizers do not break tracker execution order.
Does my data leave my server?
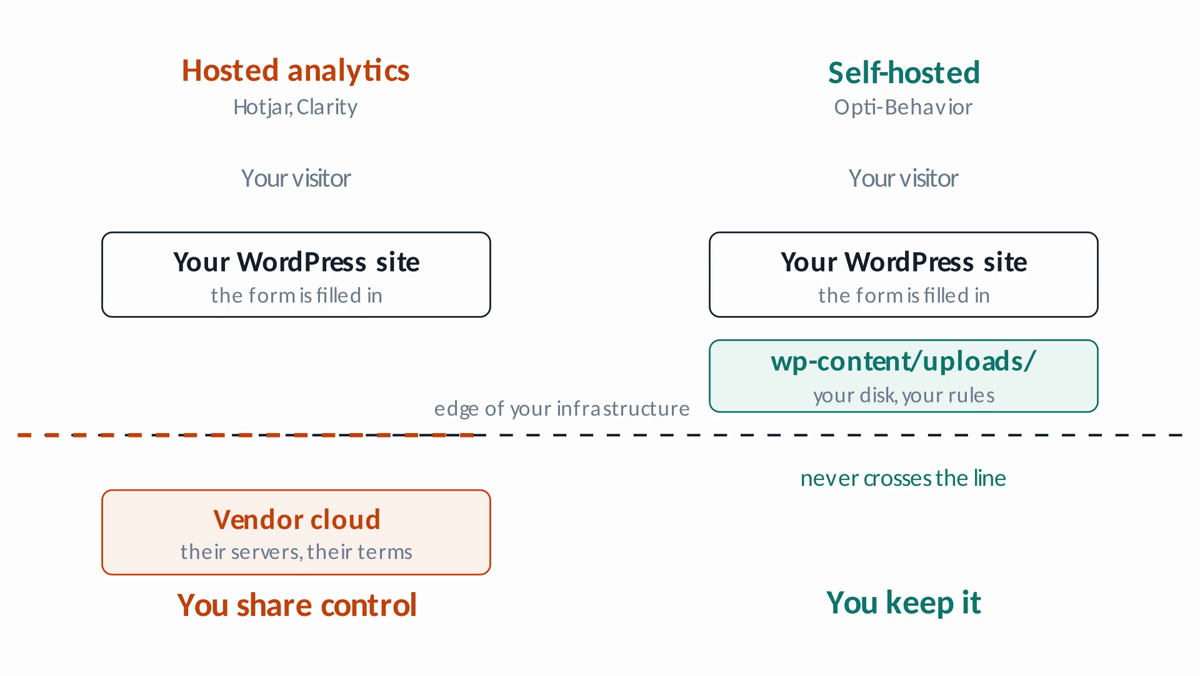
No. Opti-Behavior is fully self-hosted. Sessions, recordings, heatmaps and aggregates stay in your own database and your own uploads directory, which is what makes GDPR compliance tractable in the first place.
How is this different from a plugin that stores everything in MySQL?
A one-row-per-event design writes tens of millions of rows a month at this traffic level and stores replay payloads as large text columns beside your posts, which evicts useful pages from the InnoDB buffer pool. The hybrid model keeps MySQL small and queryable and puts bulk payloads where bulk payloads belong — on disk, compressed.
Try it on your own site
Install Opti-Behavior from the WordPress plugin directory, from the WordPress plugin directory, let it run for a week, and open Storage Overview. The plugin measures its own footprint down to the table. Compare the number to whatever you are running today.
More on the Pro modules — session recording, funnels, A/B testing, form analytics — at optiuser.com.
{“@context”:”https://schema.org”,”@type”:”FAQPage”,”mainEntity”:[{“@type”:”Question”,”name”:”Does Opti-Behavior slow down my WordPress database?”,”acceptedAnswer”:{“@type”:”Answer”,”text”:”Opti-Behavior stores only small indexed metadata in MySQL and writes heavy payloads such as session recordings and raw heatmap events to gzip-compressed JSON files on disk. On a site with about 1,725 sessions per day the database grew roughly 6.3 MB per day, about 1.45 KB per page view.”}},{“@type”:”Question”,”name”:”How much disk space does Opti-Behavior use?”,”acceptedAnswer”:{“@type”:”Answer”,”text”:”On a production site with 400,163 page views across 90 days and every module enabled, Opti-Behavior used 565 MB of database and 1.52 GB of file storage, about 2.07 GB in total, or roughly 14 KB per session including full session replay.”}},{“@type”:”Question”,”name”:”Where are Opti-Behavior session recordings stored?”,”acceptedAnswer”:{“@type”:”Answer”,”text”:”Recordings are stored as gzip-compressed JSON files under wp-content/uploads/opti-behavior-data, sharded by date and hour, with only a small metadata row kept in MySQL. A stored recording averages about 69 KB.”}},{“@type”:”Question”,”name”:”What happens to old Opti-Behavior data?”,”acceptedAnswer”:{“@type”:”Answer”,”text”:”Spam and bot sessions are purged daily. Recordings and raw heatmap files expire after 90 days by default and detailed session data after 365 days, while daily dashboard aggregates are kept forever so historical charts continue to work.”}},{“@type”:”Question”,”name”:”Can Opti-Behavior’s automatic cleanup delete data I wanted to keep?”,”acceptedAnswer”:{“@type”:”Answer”,”text”:”No. Automated cleanup passes abort and log a warning if a rule would delete more than 50 percent of the sessions table. While that circuit breaker is tripped, only spam sessions older than 30 days are aged out within a nightly cap, so the database still cannot grow without bound. Manual cleanups from the Danger Zone are not gated because they require explicit confirmation.”}},{“@type”:”Question”,”name”:”Is the Opti-Behavior dashboard slow with large datasets?”,”acceptedAnswer”:{“@type”:”Answer”,”text”:”The dashboard runs widget queries through a bounded-concurrency queue instead of firing them simultaneously, loads collapsed sections lazily, and shares primed query caches between related widgets. Heatmap pages load compressed event files in small progressive batches that yield to the browser and pause when the tab is hidden.”}}]}