
You have traffic. You have a page. But nobody clicks the button. If you keep asking yourself “why is my page not converting?”, Page X-Ray gives you the answer, for every page of your site, in one report.
Most analytics tools show you numbers: visits, bounce rate, time on page. They do not tell you what is wrong, or what to fix first. So you open a heatmap, then a recording, then the funnel report, then the error log. An hour later, you are still guessing.
Contents
- Landing page not converting? Start with these 9 reasons
- Page not converting? The short answer
- Start with the list: which page should you fix first?
- One report per page: health score and page goal
- What to fix, most costly first
- The WordPress page audit: a checklist made for this type of page
- Did a plugin update break my page? The WordPress change log
- Your funnels, seen from the page
- The action plan, in order
- How Page X-Ray fits in Smart Insights
- How to open Page X-Ray on your site
- What Page X-Ray does not do
- Questions people ask
- The bottom line
Landing page not converting? Start with these 9 reasons
Before we look at Page X-Ray, here is the short list. When a landing page is not converting, it is almost always one of these nine things. Each one leaves a clear trace in your data.
| Reason | What you see in the data | Where to look |
|---|---|---|
| People do not understand the offer in 5 seconds | Short visits, quick exits from the top of the page | Scroll heatmap, time on page |
| The main button is hard to find | Few clicks on the button, clicks on other things | Click heatmap |
| The button is below where most people stop | Scroll depth ends before the button | Scroll heatmap |
| Clicks on things that are not links | Hot spots on images, icons or text | Click heatmap, rage clicks |
| The form asks too much | People start the form and quit on one field | Form analytics |
| Something is broken | JavaScript errors, dead clicks, slow load | Error tracking, recordings |
| The page is slow on mobile | High mobile exit rate, poor Core Web Vitals | Performance report |
| Not enough trust | People scroll to reviews or price, then leave | Recordings, attention heatmap |
| Wrong visitors | One traffic source converts much worse than the others | Funnel filtered by source |
Checking all nine by hand takes time. That is exactly why we built Page X-Ray. It reads the same data for one page and tells you which of these problems is the biggest. Here is how it works.
Page X-Ray is the new per-page report of Smart Insights in Opti-Behavior Pro 1.9.2. It reads every module for one page (heatmaps, scroll depth, session recordings, funnels, forms, errors and broken links) and turns them into one answer: what is wrong, how many visits it costs, and the one button that opens the right report.
In this article we walk through a real report from our live demo store, section by section. Every screenshot comes from the plugin, not from a mockup.
See it running on a live site
A real WordPress dashboard with real traffic. No signup, no credit card, no email.
Open the live demo →Page not converting? The short answer
A page not converting almost always has one of five causes. Page X-Ray checks each of them, on each page, with your real visitors:
- The main button is not seen or not clicked. It sits too low, says something vague, or competes with other links.
- Visitors leave before the offer. They stop scrolling before the part of the page that matters.
- Something is broken. A link leads to a missing page, a script error freezes a button, a form field makes people give up.
- The page does not earn trust. No reviews, no testimonials, no legal pages, no human to contact.
- Something changed. A plugin, theme or WordPress update, or a page edit, happened just before the numbers moved.
Instead of five reports to cross-check for every page not converting, you get one report that ranks these problems by the visits they cost and tells you what to do about each one.
Start with the list: which page should you fix first?
Open Smart Insights → Page X-Ray. Every tracked page of the period is listed with a health score, its number of visits and its number one problem. The list is sorted from the page to fix first to the healthiest, so the first row is where your time pays off most.
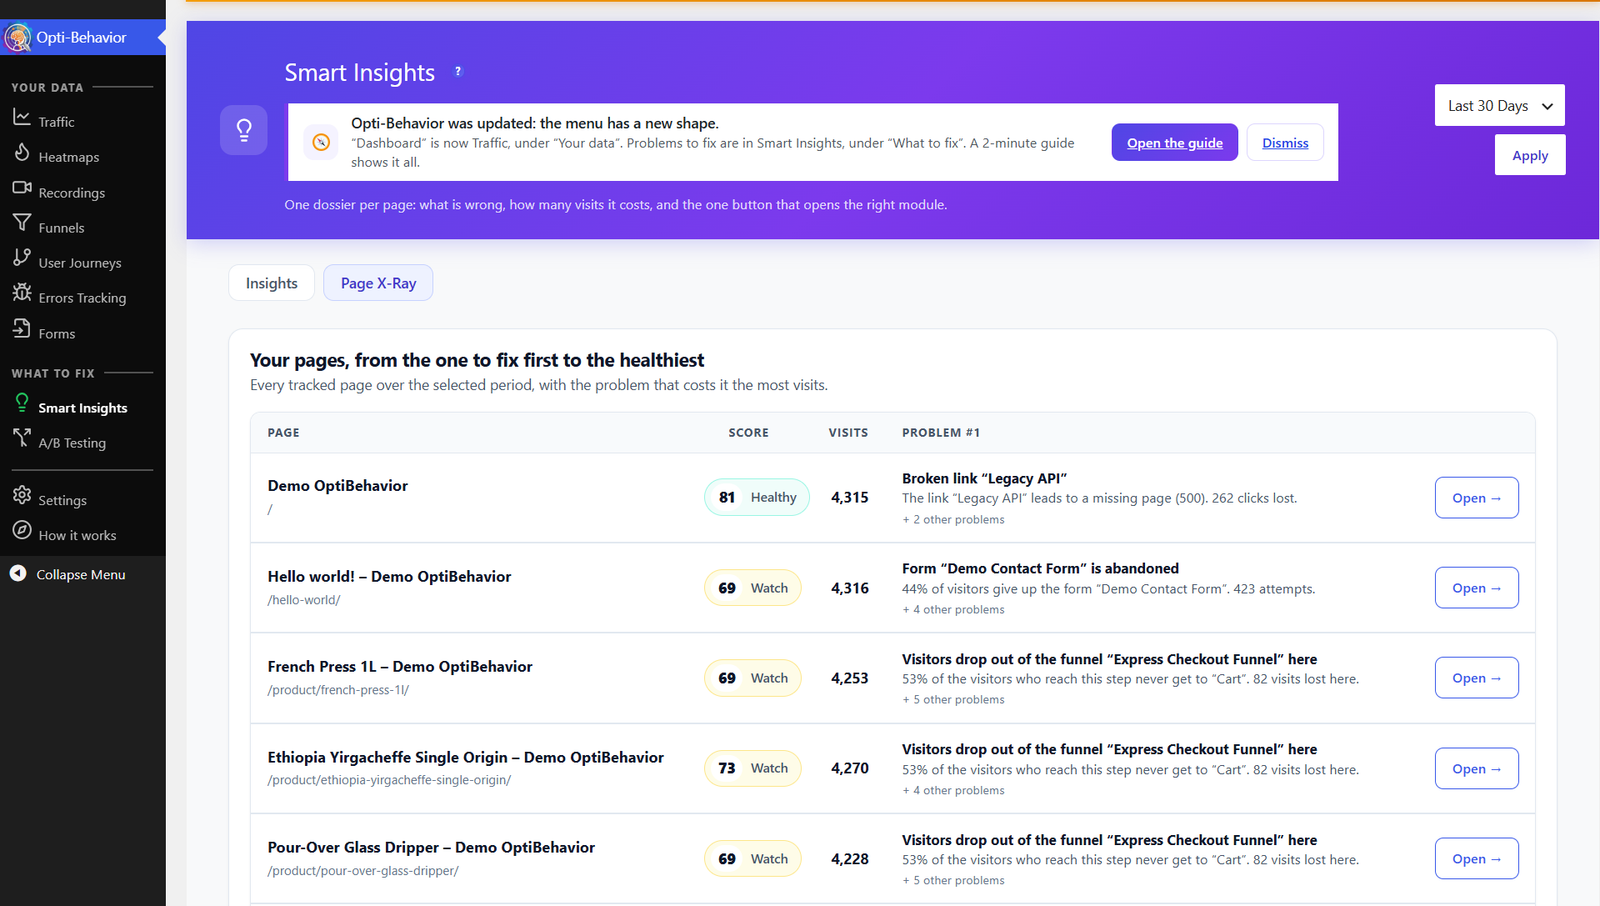
A healthy page with a lot of traffic can still sit high in the list if one problem touches many visits. A page with a low score but very few visits stays lower. The score is about what visitors actually hit, not about a theoretical checklist.
One report per page: health score and page goal
Click Open on a page and its report starts with the essentials. Here is the home page of our demo coffee store.
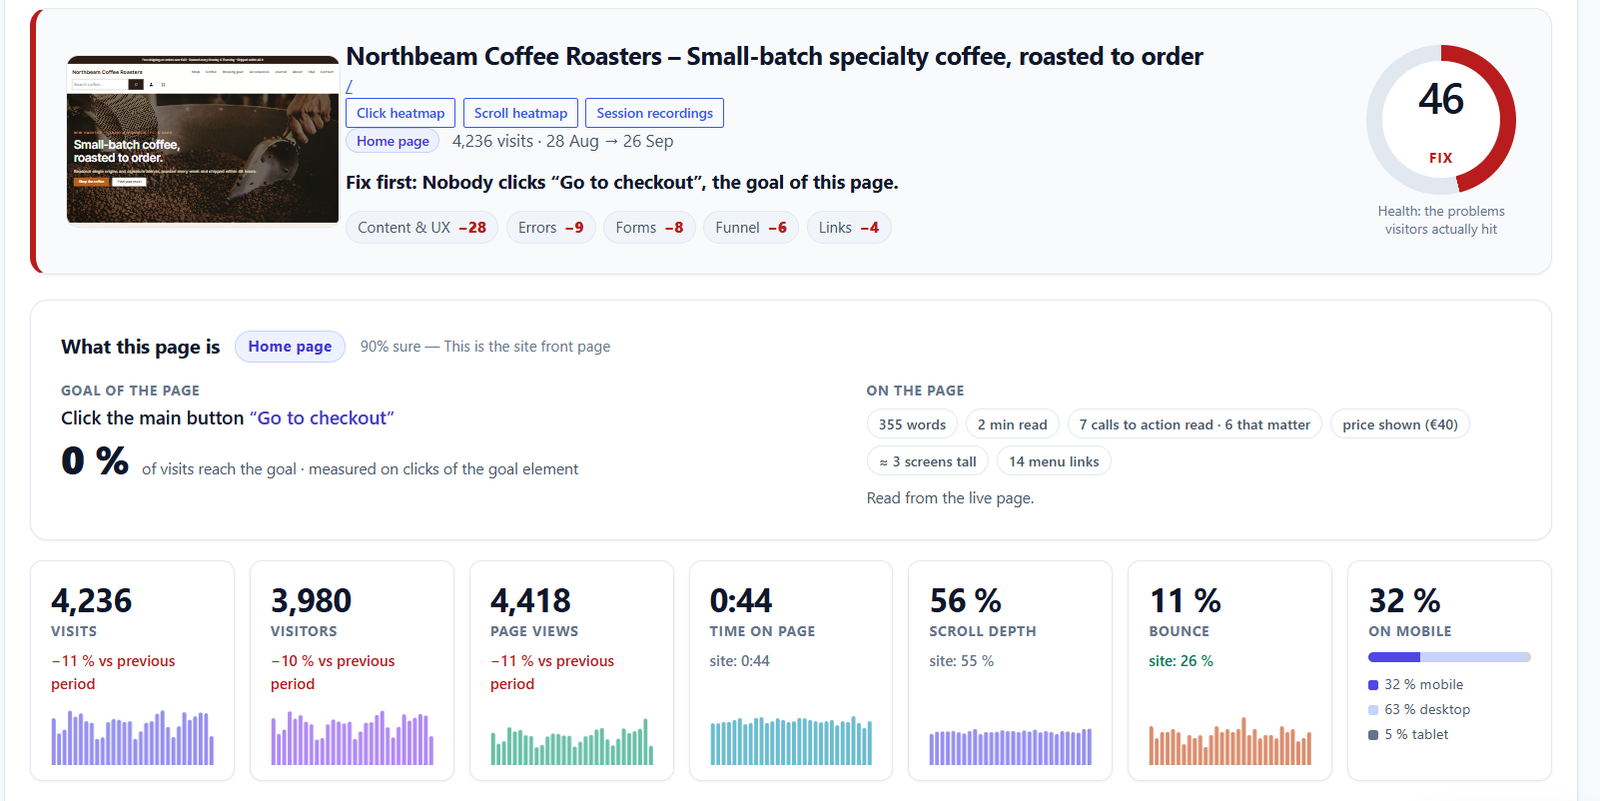
- Health score. Built from the problems visitors actually hit, with the points lost per area: Content & UX, Errors, Forms, Funnel, Links.
- What this page is. Page X-Ray reads the live page and recognises its type (home page, product, article, contact page and more) and how sure it is.
- Goal of the page. The main button it found, here “Go to checkout”, and the share of visits that reach it. Here: 0%. That single number explains why this page is not converting.
- On the page. Words, reading time, calls to action, price shown, page height and menu links, read from the live page.
- Vital signs. Visits, visitors, page views, time on page, scroll depth, bounce and mobile share, each compared with the previous period or with the site average.
What to fix, most costly first
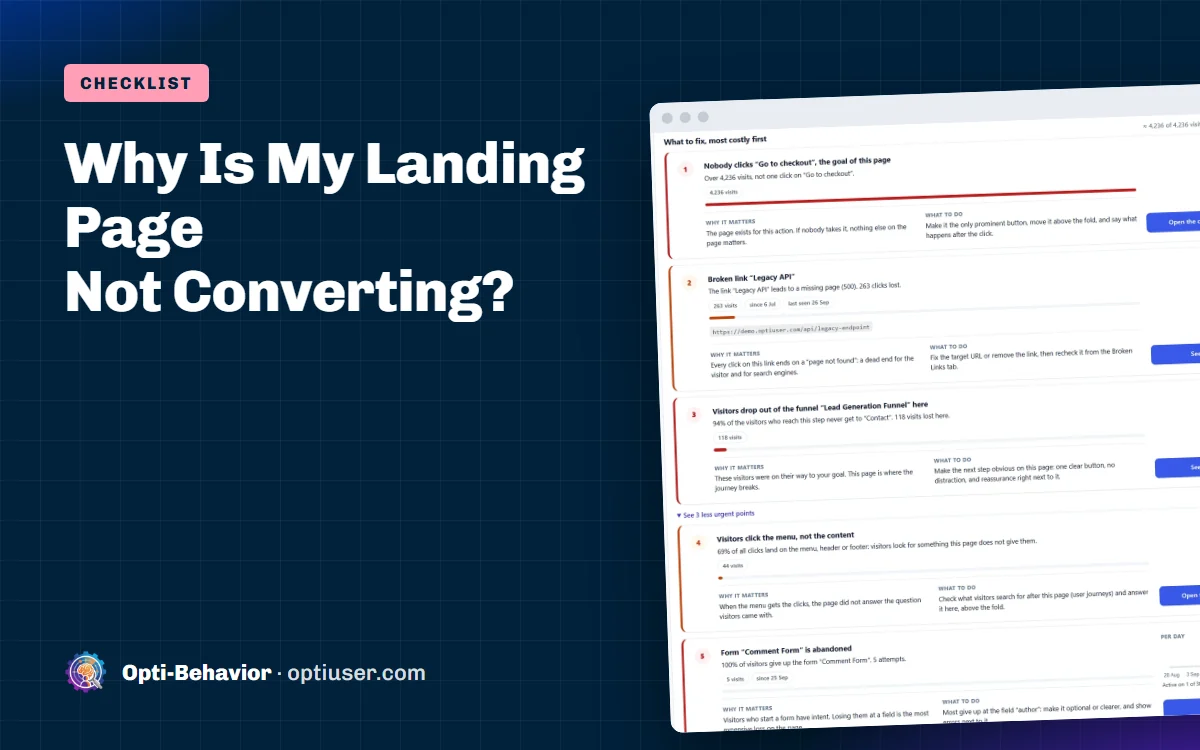
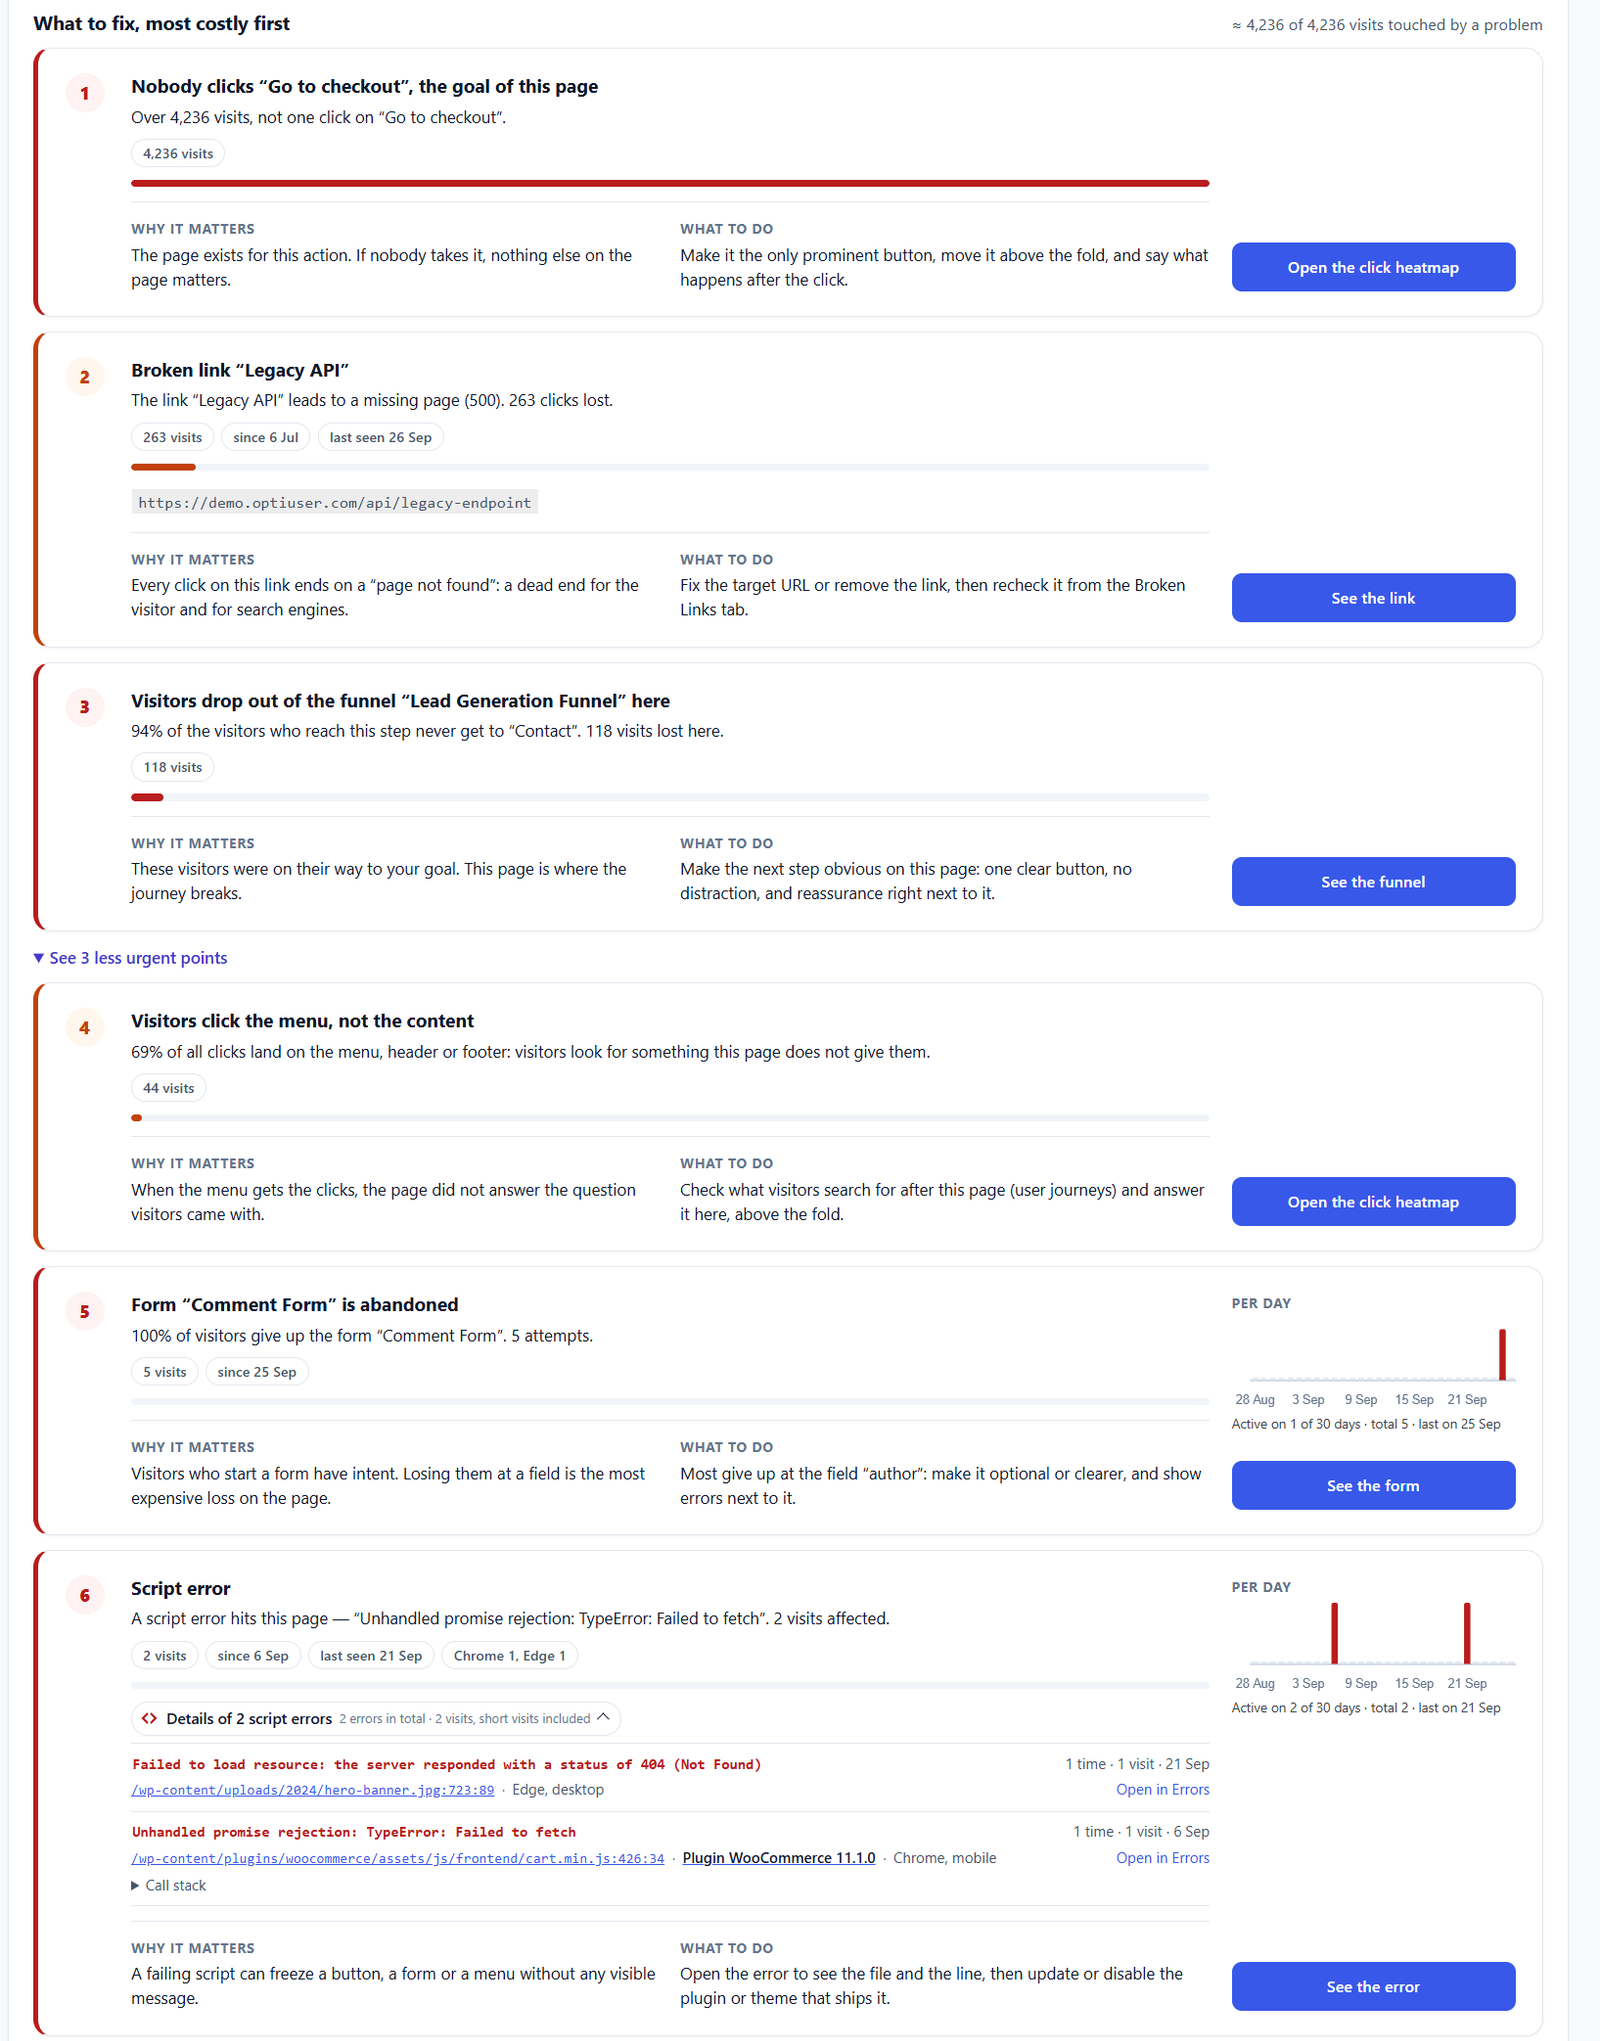
This is the heart of the report, and where a page not converting shows its real cause. Each problem is a card with the visits it touched, why it matters, what to do, and one button that opens the exact report you need. The most costly problem comes first.
Why nobody clicks your main button
“Nobody clicks Go to checkout, the goal of this page. Over 4,236 visits, not one click.” When the goal of a page is never taken, nothing else on the page matters. Page X-Ray tells you to make it the only prominent button, move it above the fold and say what happens after the click, and opens the click heatmap so you can see where visitors click instead.
Broken links that cost you clicks
A link that leads to a missing page is a dead end for the visitor and for search engines. The card shows the link text, the address, how many visits clicked it and since when, so you can fix or remove it in minutes.
Visitors who click the menu, not the content
When most clicks land on the menu, the header or the footer, visitors are looking for something the page does not give them. Page X-Ray measures that share and points you to the user journeys to see where they go next.
Forms that visitors abandon, and the field that stops them
Visitors who start a form have intent. Losing them is the most expensive loss on a page. The card names the field where most people give up, here “author”, and suggests making it optional or clearer.
JavaScript errors: which plugin broke the page?
A failing script can freeze a button, a form or a menu without any visible message. Page X-Ray lists each error with the message, the file and the line, the plugin or theme that ships it (here WooCommerce), the browsers and devices, and the number of visits affected.
The WordPress page audit: a checklist made for this type of page
Below the problems comes the page audit. It works like a landing page audit, done automatically for every page of your WordPress site. It compares what the page contains with the checklist for its type: a product page is not checked like an article or a contact page. It is split into tabs, each with a score, the missing items and one clear action per item.
Understand: can visitors and Google tell what the page is?
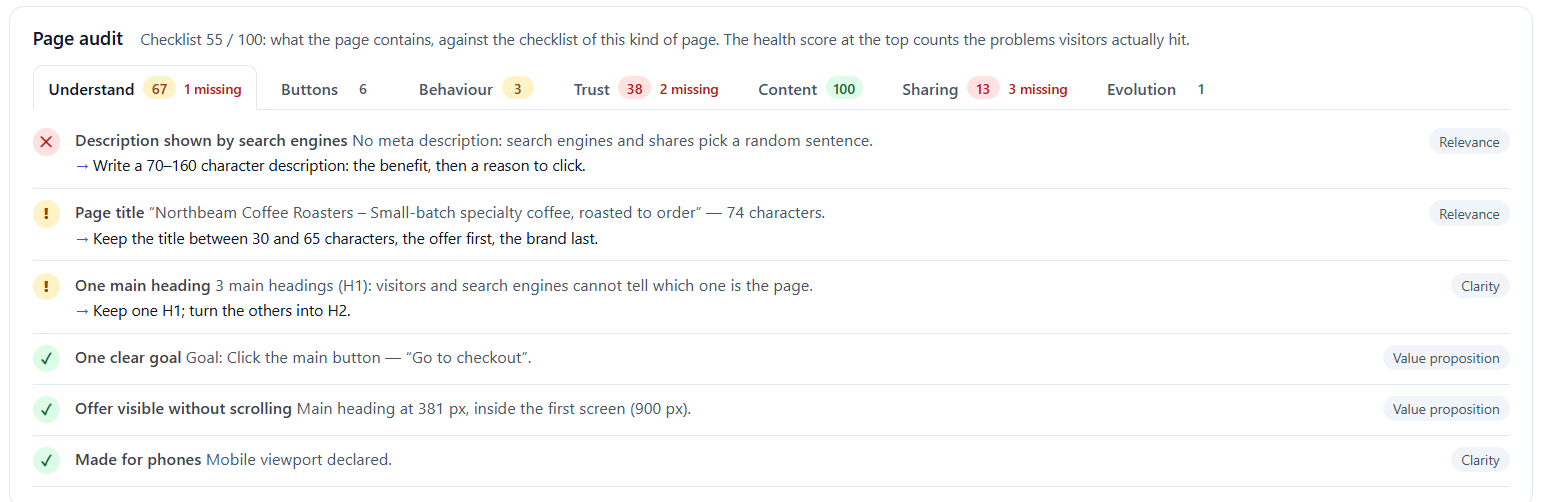
Missing meta description (see Google’s guide to meta descriptions), a title that is too long, three H1 headings on one page: small things that decide what people see in Google and whether they understand the page in the first seconds.
Buttons: which calls to action are really clicked?
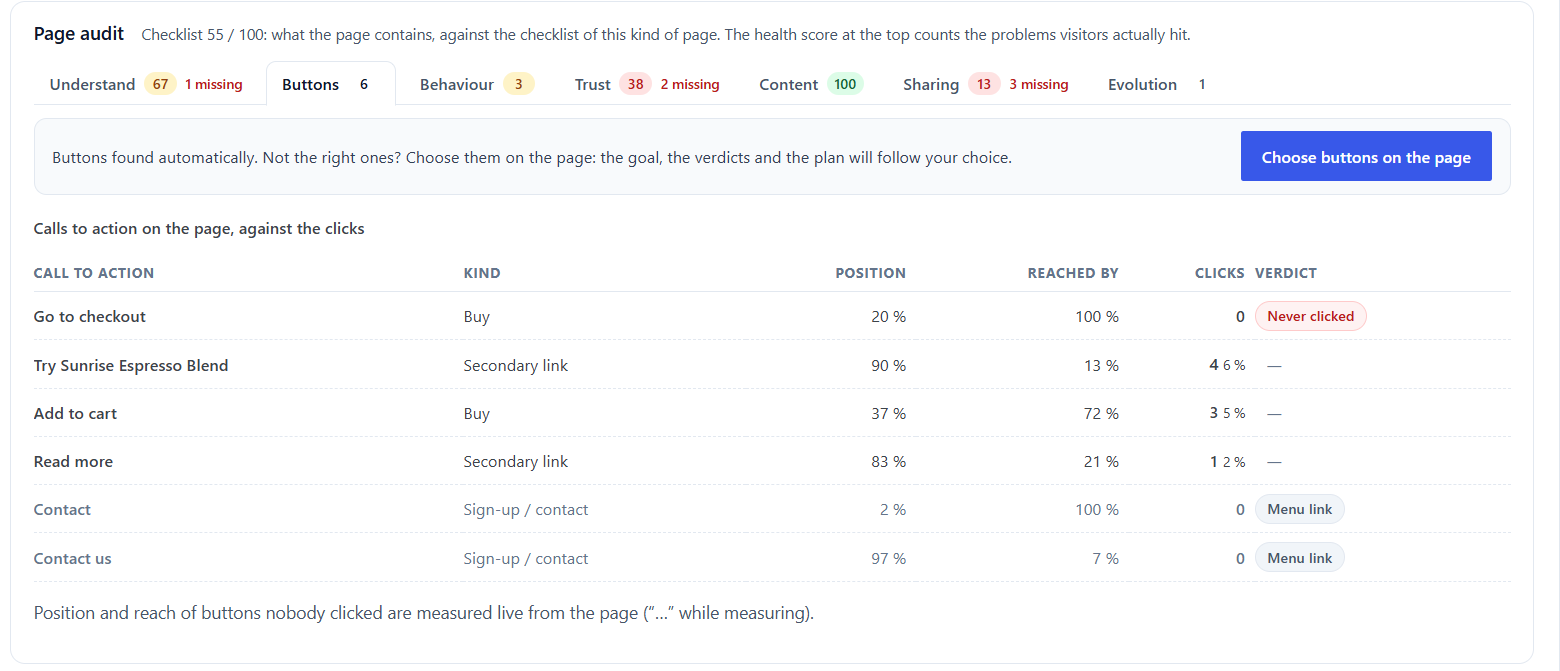
Page X-Ray finds the buttons automatically. For each one you see where it sits, how many visitors scroll that far and how many click. If it picked the wrong buttons, choose them yourself on the page: the goal, the verdicts and the action plan follow your choice.
Behaviour: where visitors look, click and leave
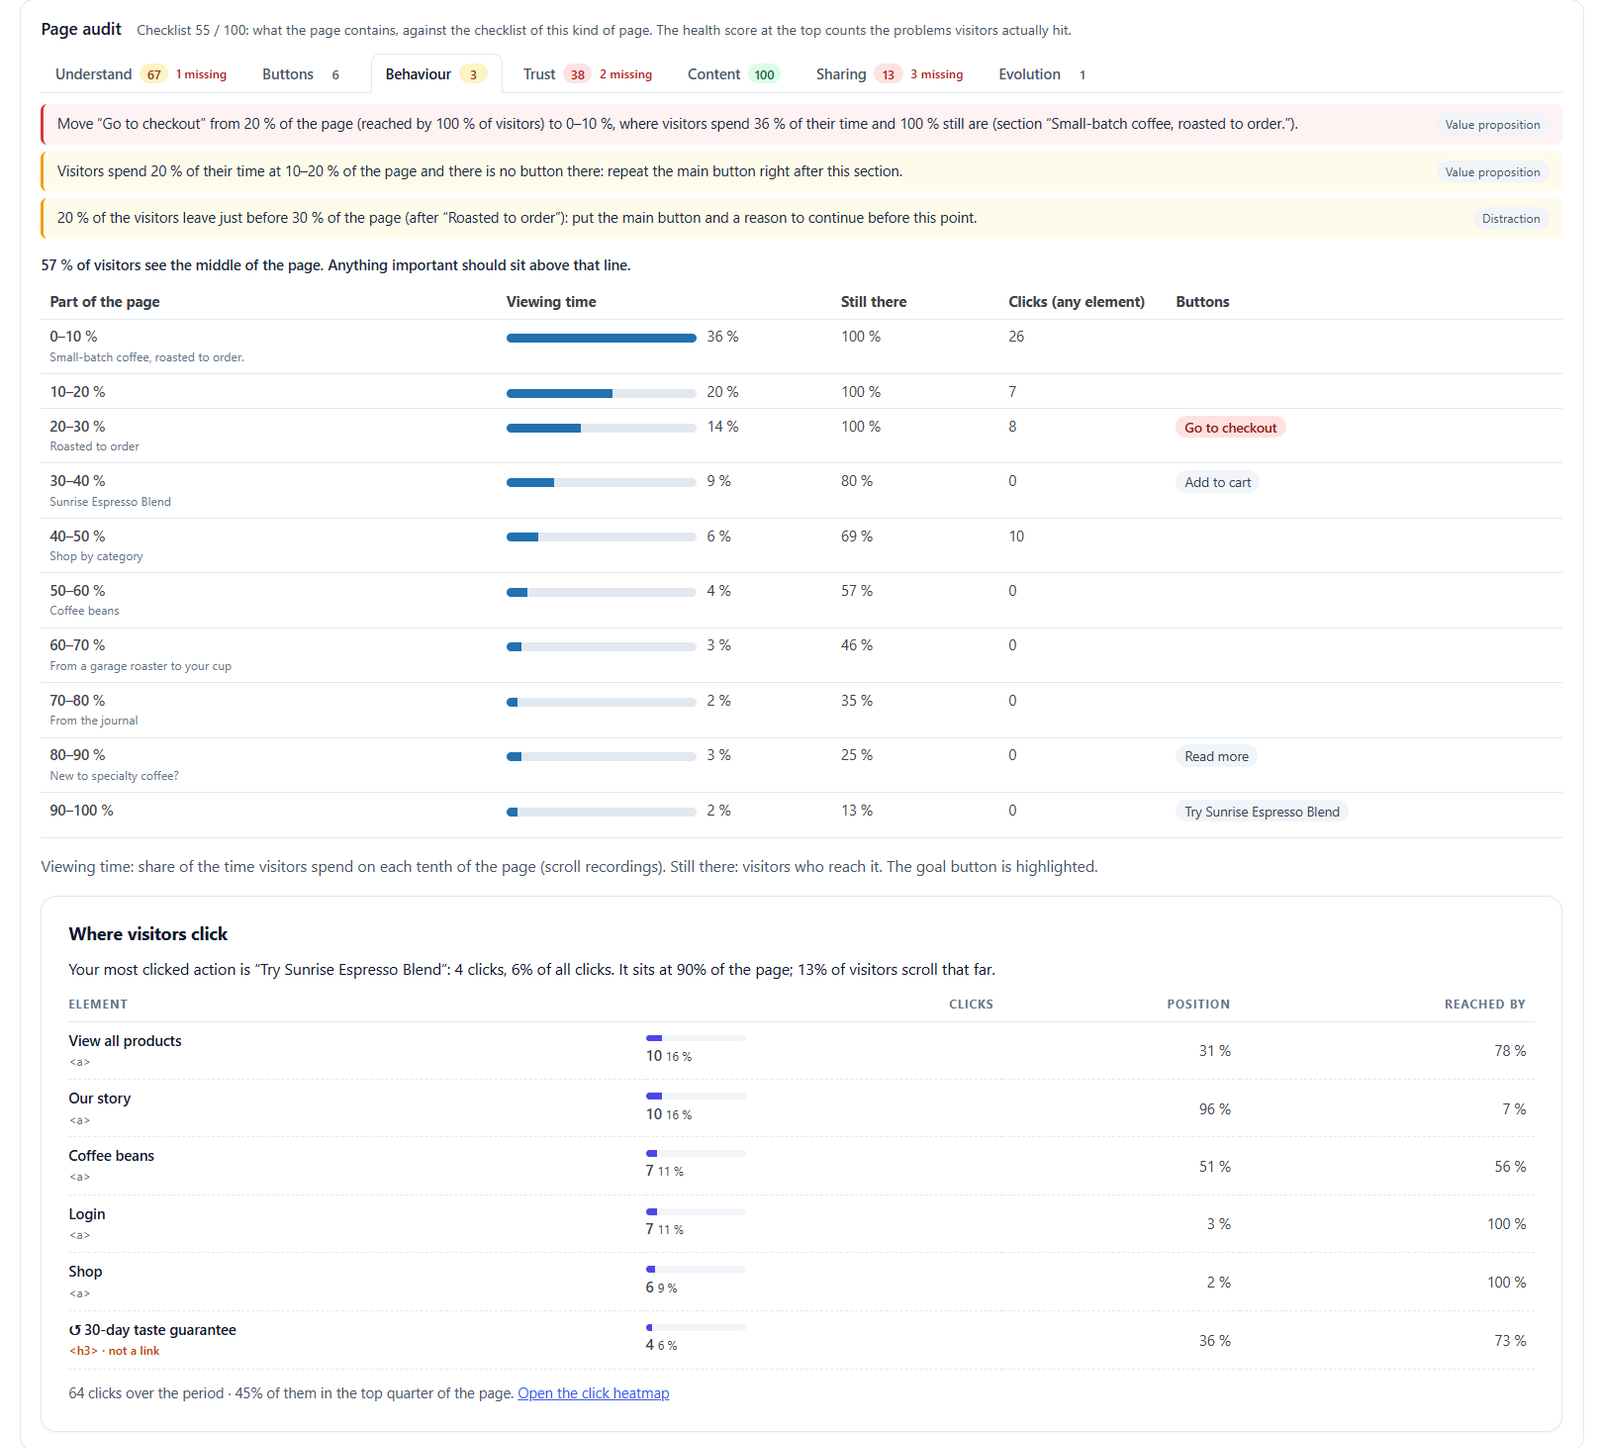
This tab answers “why do visitors leave my website?” with numbers, page by page. Here, 36% of the viewing time is spent in the first tenth of the page, but the main button sits at 20%. Page X-Ray suggests moving it up, repeating it after the section where visitors spend their time, and adding a reason to continue before the point where 20% of them leave. It also flags elements that people click but that are not links, like a “30-day taste guarantee” heading.
Trust: would you buy from this page?
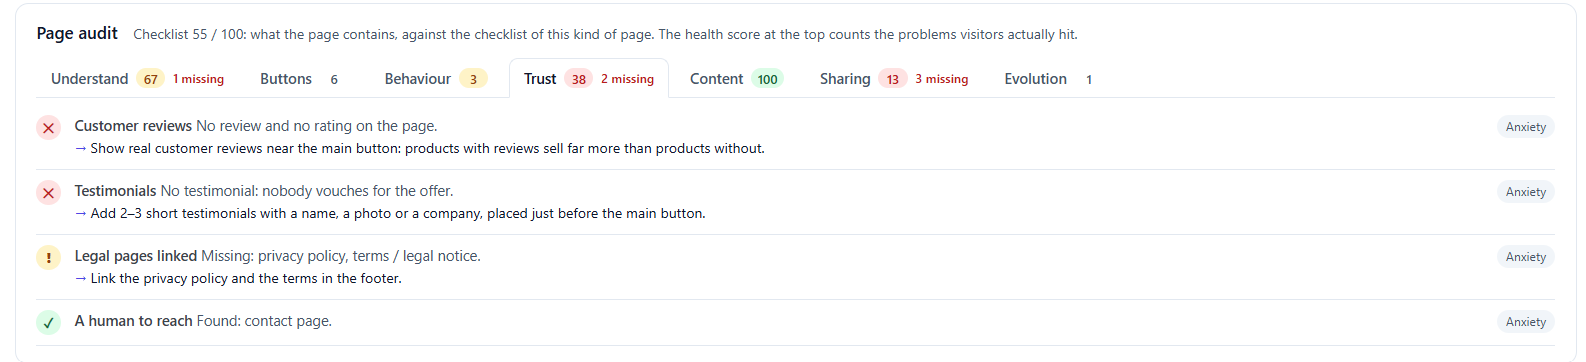
No reviews, no testimonials, no privacy policy linked: visitors hesitate. Each missing item comes with a precise fix, like adding two or three short testimonials just before the main button.
Content: is there enough, and is it easy to read?
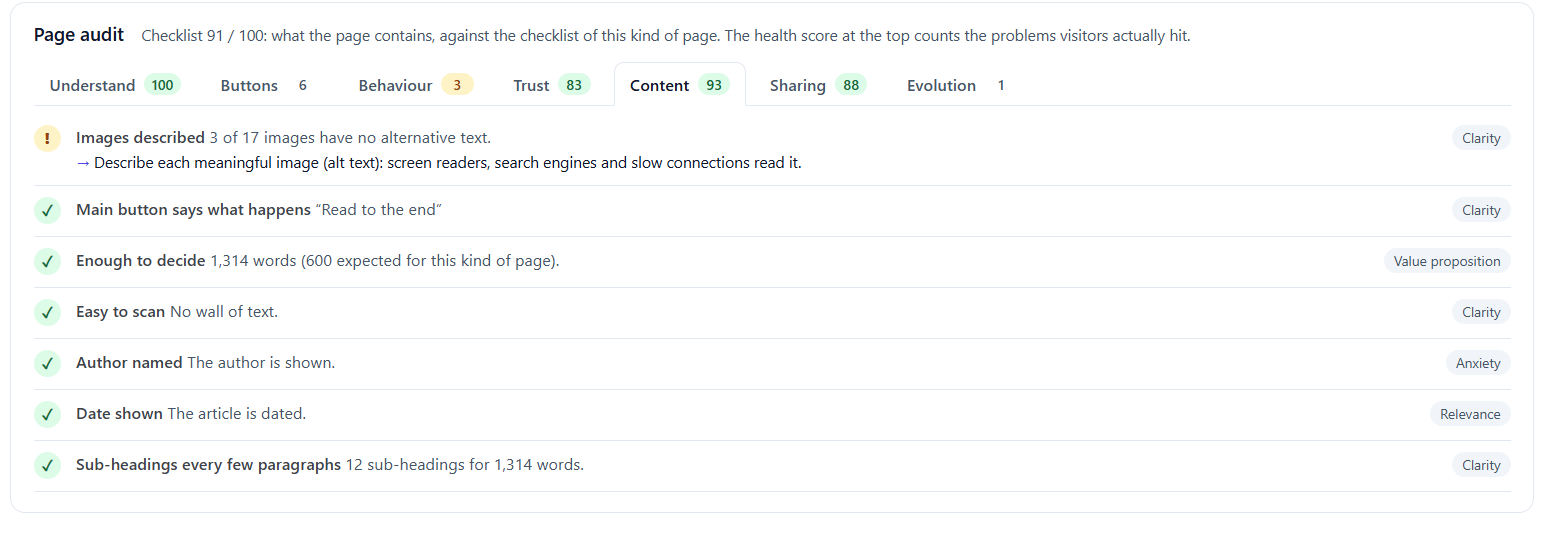
Here on a blog article: 1,314 words where about 600 are expected for this kind of page, 12 sub-headings, author and date shown, but 3 of 17 images without alternative text.
Sharing: what people see when they share your page
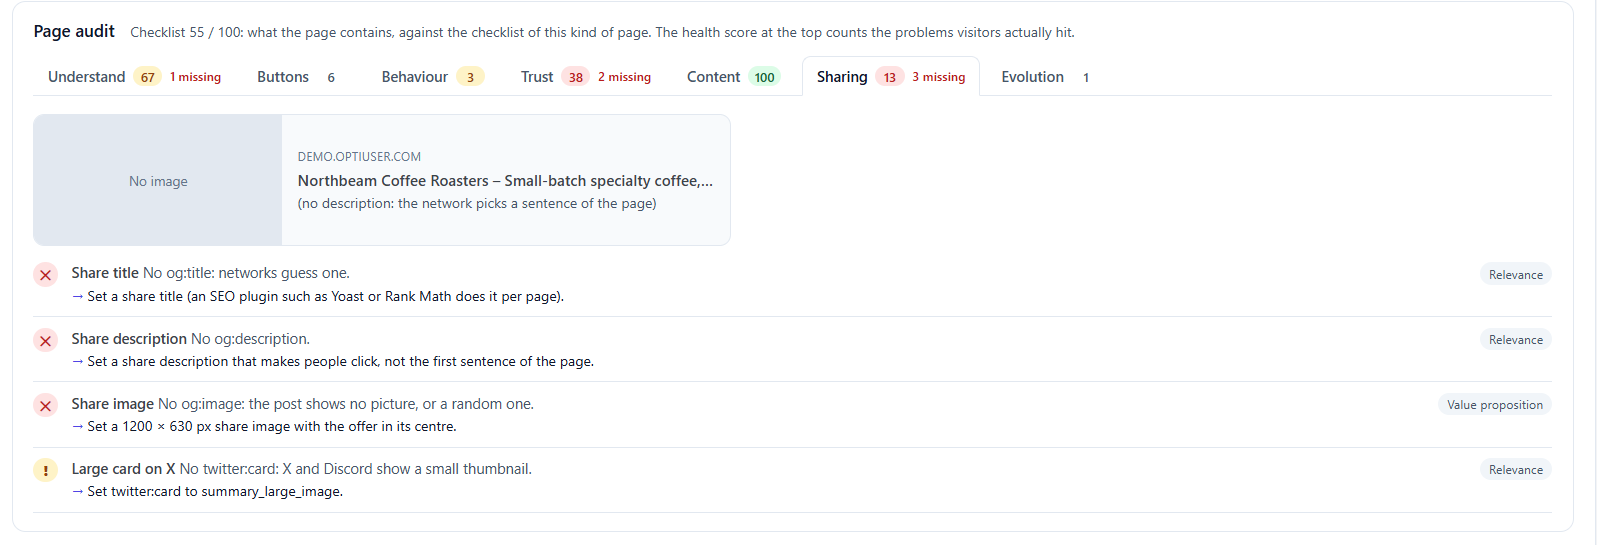
When a page has no share title, description or image (the Open Graph tags), Facebook, LinkedIn, X or Discord pick one at random. Page X-Ray shows the preview people see and what to set, usually from your SEO plugin.
Evolution: did a change really move your visitors?
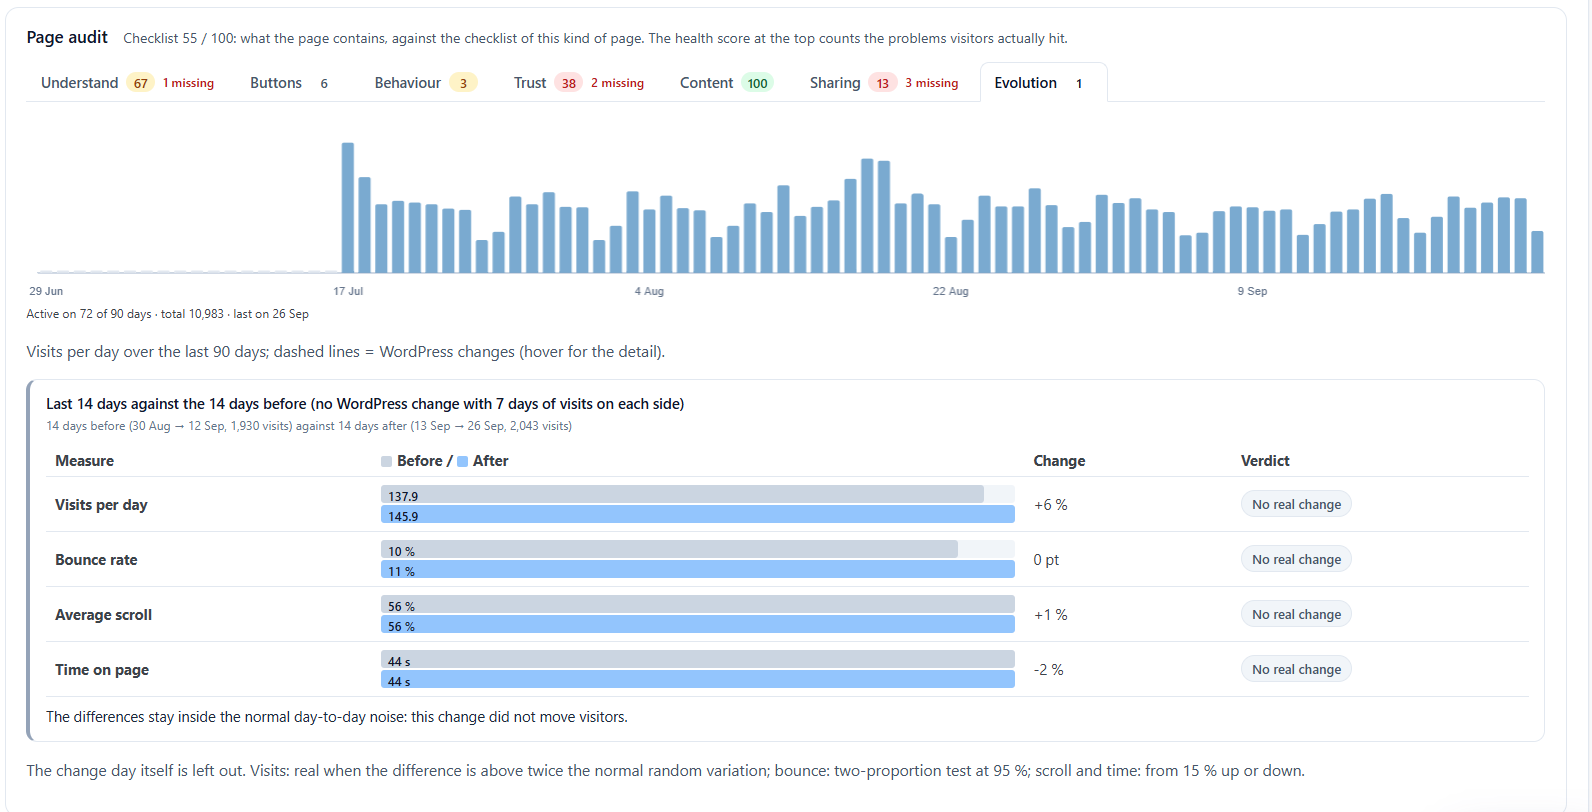
Numbers move every day. The Evolution tab compares two periods and tells you if the difference is real or just normal day-to-day noise, using simple statistical tests. Here: no real change.
Did a plugin update break my page? The WordPress change log
“My traffic dropped after a WordPress update.” “Conversions fell after I edited the page.” Page X-Ray keeps a log of plugin, theme and WordPress updates and of page edits. Each change is listed with its date and marked on the charts as a dashed line, so you can see at a glance whether a problem started right after it.

When a change has enough visits on each side, the report compares the days before and after it. No more guessing whether the new theme version is the reason your page stopped converting.
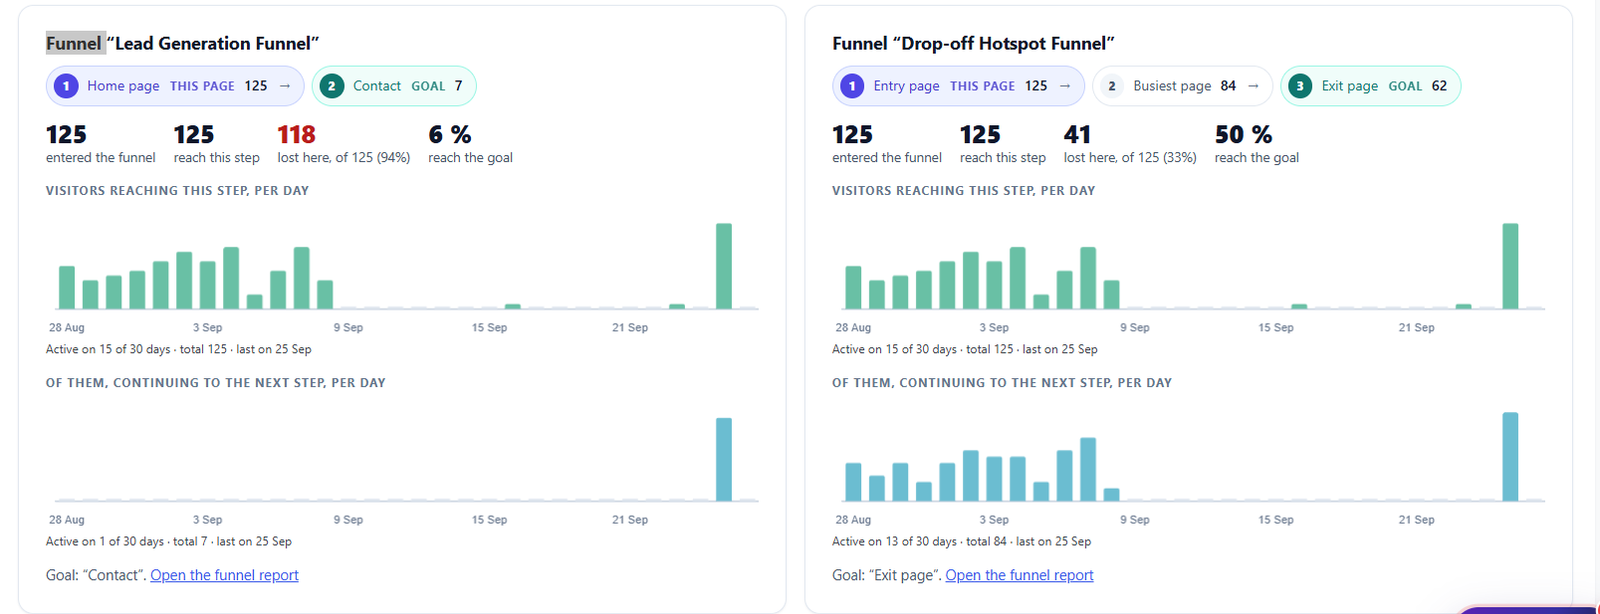
Your funnels, seen from the page
A page is often one step of a longer path: product page, cart, checkout. Page X-Ray shows every funnel the page belongs to, how many visitors reach this step, how many are lost here and how many reach the goal, day by day.
The action plan, in order
The report ends with what to do, in order, with the effort each step needs and a button that takes you straight to it.
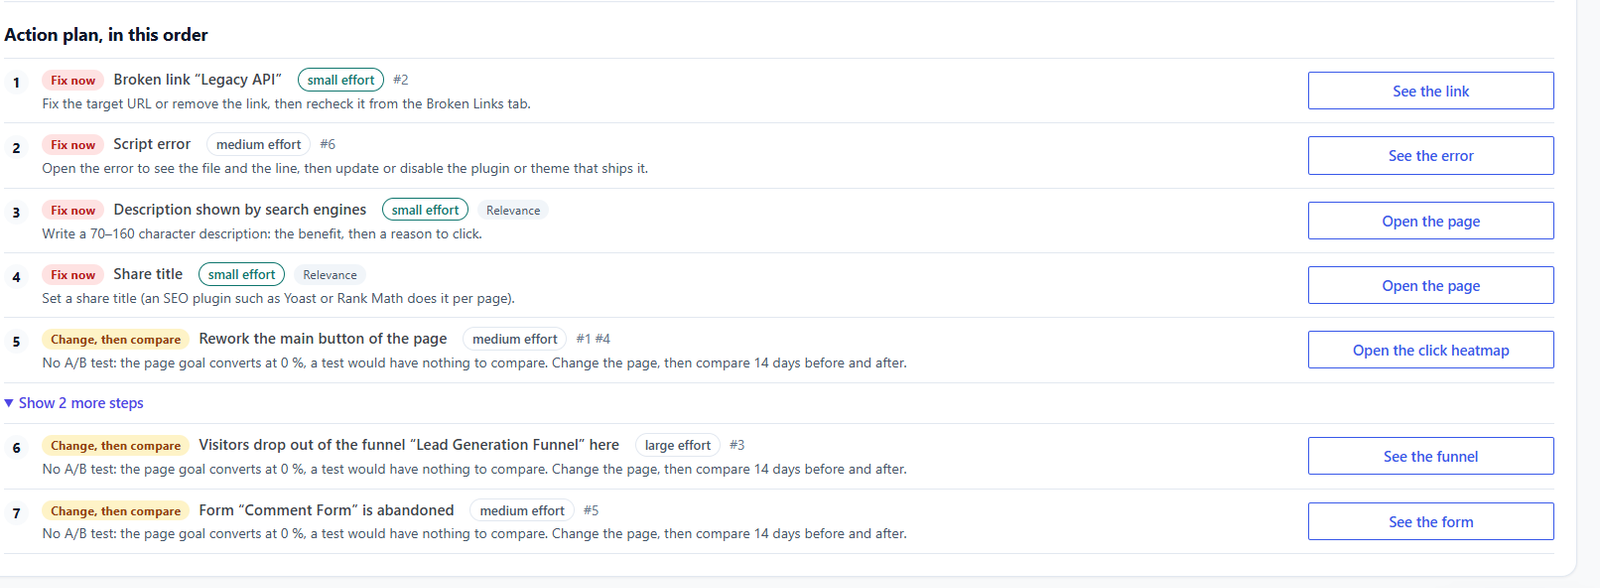
“Fix now” steps are clear fixes, like a broken link or a missing description. “Change, then compare” steps are bigger changes. When the page goal converts at 0%, an A/B test would have nothing to compare, so Page X-Ray tells you honestly to change the page and compare 14 days before and after instead.
How Page X-Ray fits in Smart Insights
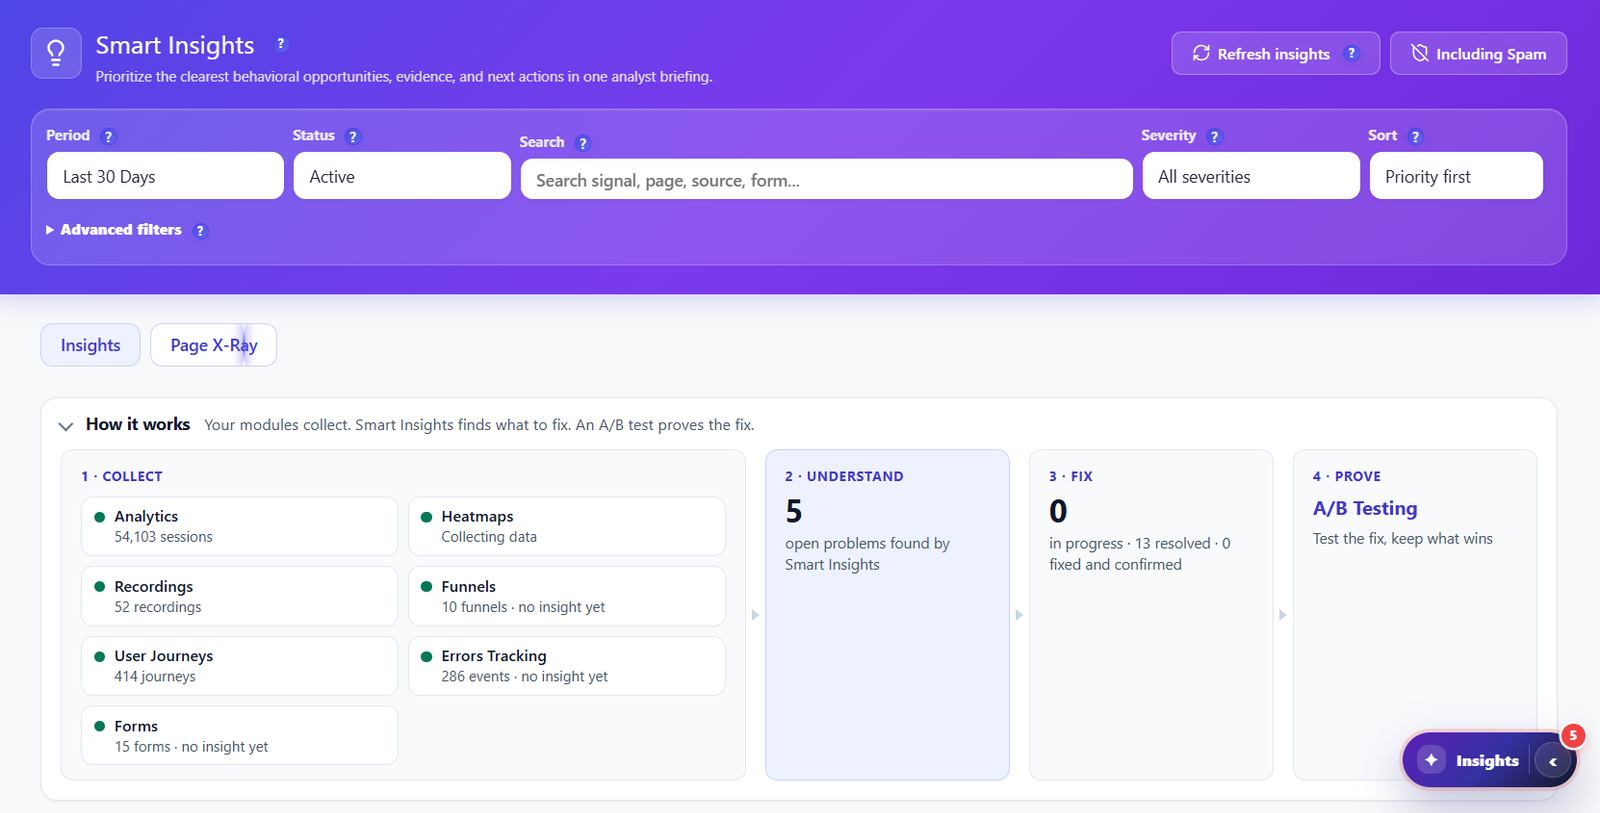
Smart Insights works in four steps: your modules collect, Smart Insights finds what to fix, you fix it, and an A/B test or a before and after comparison proves the fix. The Insights tab lists problems across the whole site. The Page X-Ray tab looks at the same data page by page.
How to open Page X-Ray on your site
- Install Opti-Behavior from WordPress.org and let it collect a few days of visits.
- Activate Opti-Behavior Pro (a free trial is available).
- Go to Opti-Behavior → Smart Insights and open the Page X-Ray tab.
- Choose the period, then click Open on the first page of the list. You can also reach a page report from the Dossier button of the Heatmaps list.
What Page X-Ray does not do
We would rather be clear about the limits. Page X-Ray explains a page not converting with what visitors really did, so it needs visits: a problem is only raised when enough visitors are measured, and cards built on few visits are marked as provisional. It does not rewrite your page for you. And money figures are only shown when they come from real orders, never from a guess.
Page X-Ray also does not slow your site down. Reports are built in your WordPress admin from data you already collect, and the trackers on the public site load late. We measured it: 100/100 on Google PageSpeed Insights with tracking on. If you are comparing tools, see also our Hotjar alternative for WordPress guide.
Choosing a tool? See our WordPress heatmap plugin comparison of 8 options.
Questions people ask
Why is my landing page not converting?
A landing page not converting usually has one of four problems: visitors never see or never click the main button, they do not trust the page, something on the page is broken (a link, a script or a form), or they leave before they reach the offer. Page X-Ray checks all four on each page and ranks them by the visits they cost, so you know which one to fix first.
Why is my page not converting even though it gets traffic?
Traffic only means visitors arrive. A page not converting despite good traffic usually loses people after they land: the main button sits below the point where most visitors stop scrolling, the page does not answer the question they came with, or something broken gets in the way. Page X-Ray shows which one it is, with the share of visits each problem touches.
How do I know which page on my site to fix first?
Open the Page X-Ray tab in Smart Insights. It lists every tracked page with a health score, its number of visits and its most costly problem, sorted from the page to fix first to the healthiest.
How can I see why visitors leave my website?
Page X-Ray splits the page into ten parts and shows how much of their time visitors spend on each part, how many are still there, and the exact point where most of them leave. It then tells you what to put before that point.
Why does nobody click my button?
It is the most common cause of a page not converting: the button is too low on the page, says something vague like Submit, or competes with other links. Page X-Ray measures where each call to action sits, how many visitors reach it and how many click it, and flags the buttons that are never clicked.
How do I find broken links and JavaScript errors on a WordPress page?
With Opti-Behavior Pro, broken links and script errors are recorded when real visitors hit them. Page X-Ray shows them in the report of the page they happen on, with the number of visits affected and, for script errors, the file, the line and the plugin or theme that ships it.
Did a plugin update hurt my conversions?
Page X-Ray logs plugin, theme and WordPress updates and page edits. Each change is drawn on the charts, and the report compares the two weeks before and after it, with a verdict that says whether the change really moved visitors or stayed inside normal day-to-day noise.
Is Page X-Ray free?
Page X-Ray is part of Opti-Behavior Pro. The free plugin shows the Page X-Ray tab with a lock and an example report, so you can see what you get before you upgrade.
Does Page X-Ray slow down my website?
No. Page X-Ray builds its reports inside your WordPress admin from data you already collect. On the public site, the Opti-Behavior trackers load late and scored 100/100 on Google PageSpeed Insights with tracking on.
Where is my data stored?
On your own server. Opti-Behavior is self-hosted: the data behind Page X-Ray stays in your WordPress database and is never sent to a third-party analytics service.
The bottom line
Knowing that you have a page not converting is easy. Knowing why, and what to do first, used to take hours of cross-checking reports. Page X-Ray does that work for every page not converting, and for the healthy ones too: it reads what visitors really did, ranks the problems by the visits they cost, and gives you an ordered plan with a button for each step. Try it on the live demo, then on your own site.
Start tracking every visitor, with the data on your own server
Install Opti-Behavior free. Visitor data stays on your own WordPress server, and no cookies are required.
See it running on a live site
A real WordPress dashboard with real traffic. No signup, no credit card, no email.
Open the live demo →