Skip links
iconOpti-Behavior
made by OptiUser

Dashboard for wp mark whiteWordPress · woo markWooCommerce FREE PRO

Every visitor, live.
Every metric, one screen.
Your own server.

Six live KPIs, a real-time visitor feed with a world map, traffic charts, engagement tables, an hour-by-day activity heatmap and bot and spam detection — 18 widgets inside your WordPress admin, refreshed every few seconds, with no third-party analytics service.

The whole dashboard is in the free plugin · Pro adds the full raw traffic export · No credit card

Admin in 6 languages · Multisite ready

← Back to overview

50

visitors on the site right now, each with page, country and anonymity status.

Do this

Watch a campaign launch land, visitor by visitor.

6

live KPIs, each with a trend against the previous period.

Do this

Compare periods before you change anything.

3

traffic classes — human, automated and spam — so bots stop inflating your numbers.

Do this

Keep Excluding Spam on for clean reports.

168

hour-by-day cells show exactly when your audience is most active.

Tip

Schedule posts and promotions on the hot cells.

Every view can use
  • Date range
  • Filters
  • Exclude spam
  • CSV / JSON
  • Saved filters
  • Email reports
Example data
wp mark white
5.0 Rated on WordPress.org
1,700+ active installsSites running Opti-Behavior today
woo mark
Built for WooCommerceCheckout, cart and product-page funnels
rgpd
100% self-hosted · GDPR-readyNative WordPress · anonymized data · no third parties
Cache plugin compatible
wp rocketWP Rocketlitespeed cacheLiteSpeed Cachew3 total cacheW3 Total Cachewp super cacheWP Super CacheautoptimizeAutoptimizesg optimizerSG OptimizerperfmattersPerfmatterswp optimizeWP-Optimizejetpack boostJetpack BoostbreezeBreezewp fastest cacheWP Fastest CachehummingbirdHummingbirdnitropackNitroPackflyingpressFlyingPresscache enablerCache Enablerswift performanceSwift Performanceasset cleanupAsset CleanUp
Works with all themes & page builders
elementorElementordiviDivibeaver builderBeaver BuilderwpbakeryWPBakerygutenbergGutenbergOxygenbrizyBrizybreakdanceBreakdancesiteoriginSiteOriginastraAstrageneratepressGeneratePresskadenceKadencethemifyThemifymotopressMotoPresslive composerLive ComposeroceanwpOceanWPblocksyBlocksyneveNeve
6
Live KPIs
Visitors, sessions, page views, session time, scroll depth and bounce rate
18
Widgets
Live feed, map, charts, tables, heatmap and quality panels
5
Seconds to refresh
The live feed ticks every 5 seconds while the tab is open
Sessions
No session or page-view caps, data in your own database

Analytics fail when they live somewhere else, count everything and answer nothing.

A dashboard is only useful if you open it, trust it and can ask it a question. Four things get in the way.

The problem

Your analytics live in another tab

A separate login, a separate account, a separate cookie banner.

With Opti-BehaviorThe dashboard is a page of your own WordPress admin, powered by your own database, with a live feed that ticks every 5 seconds.

The problem

Bots and spam inflate every number

Crawlers and scrapers look like visitors until you separate them.

With Opti-BehaviorTraffic is classified as human, automated or spam, named bots are listed with their share, and one Excluding Spam switch cleans every widget.

The problem

Averages hide when your audience shows up

A daily total cannot tell you when to publish or when to deploy.

With Opti-BehaviorAn hour-by-day heatmap of 168 cells and a peak-hour KPI show your audience’s rhythm, so you time posts, promotions and maintenance.

The problem

Every question needs an analyst

Which country, on mobile, from this campaign, staying over a minute?

With Opti-BehaviorSixteen filters across visitor, session, page and UTM attributes, saved filters, and one-click CSV or JSON export answer it yourself.

Every dashboard widget, explained with a guided tour

The screenshots zoom onto each panel in turn. Click a step to jump, or click the image to open it full size.

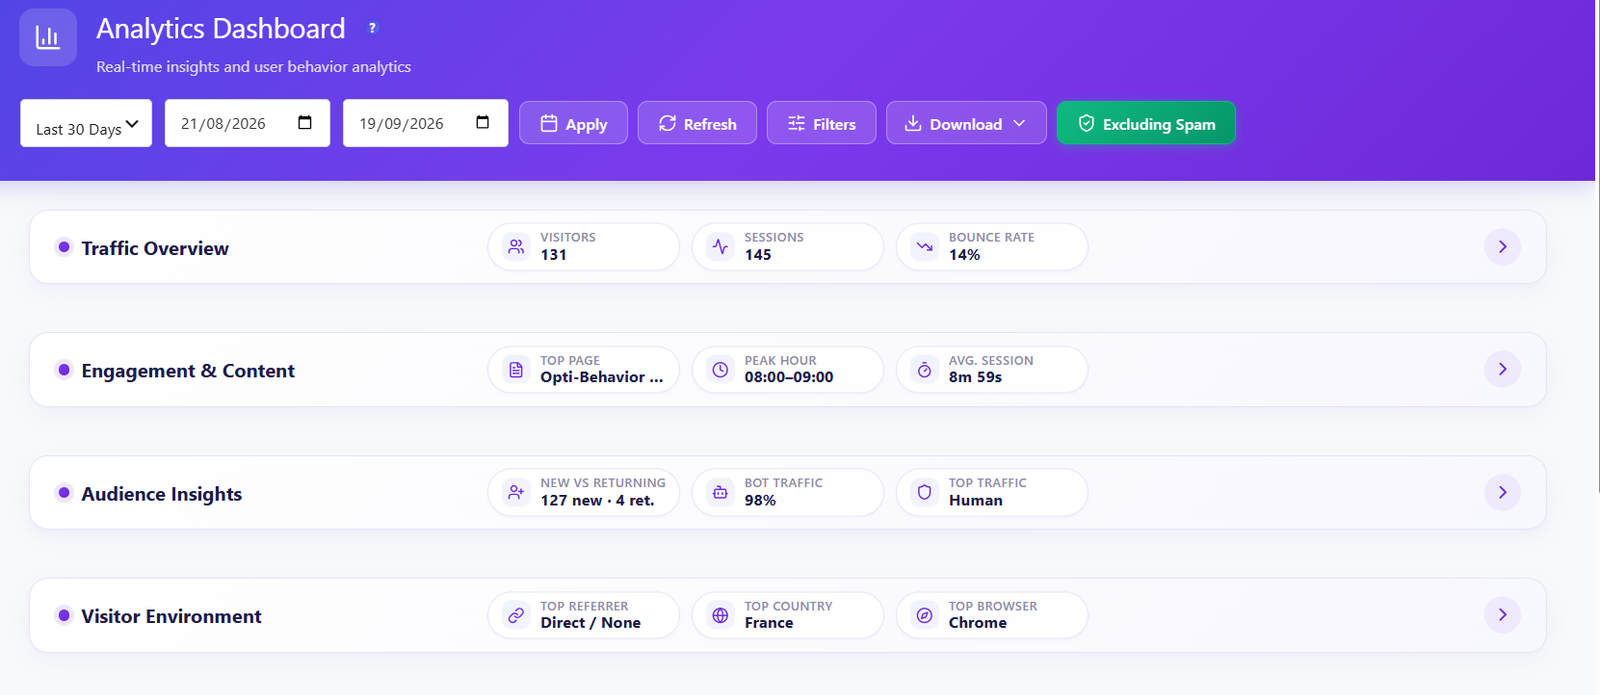
Opti-Behavior Analytics Dashboard header with a period selector, custom dates, Apply, Refresh, Filters, Download and Excluding Spam controls, and four collapsible groups: Traffic Overview, Engagement and Content, Audience Insights and Visitor Environment

Dashboard overview FREE

One header to steer the whole dashboard.

Pick a period, refresh, open the filters, download the data or switch spam on and off, and every widget follows. Four collapsible groups summarise your site at a glance and expand into the detailed panels below.

TipCollapse the groups you do not need: the dashboard remembers a clean layout for daily use.

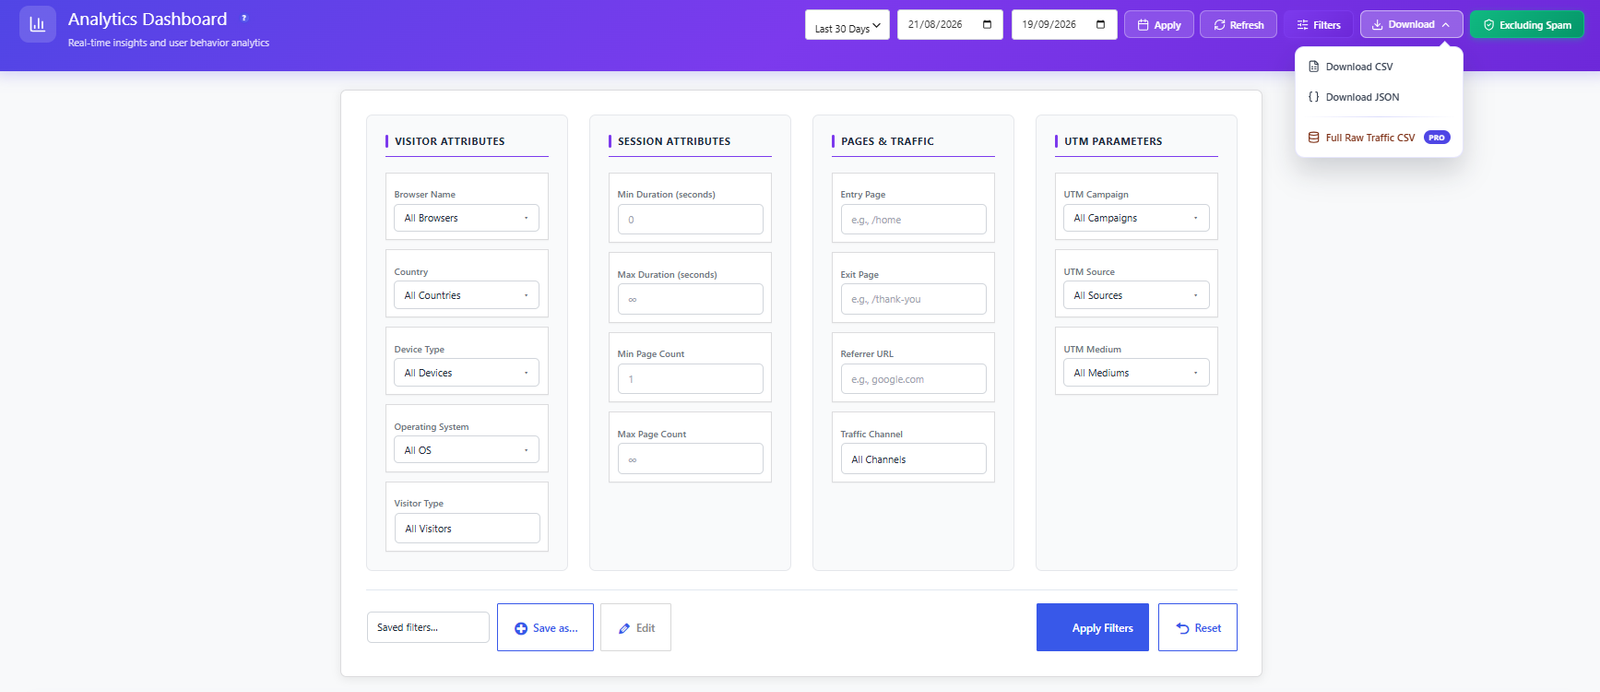
Opti-Behavior dashboard filter panel with visitor attributes, session attributes, pages and traffic and UTM parameters, saved filters, Save as, Edit, Apply Filters and Reset buttons, and the Download menu with CSV, JSON and a Pro Full Raw Traffic CSV

Filters & export FREE PRO

Ask your own questions, then take the data with you.

Sixteen filters across four groups slice every widget at once, saved filters bring a favourite view back in one click, and the Download menu exports the result as CSV or JSON. Pro adds a Full Raw Traffic CSV.

TipSave the filters you repeat every Monday: one click, same view.

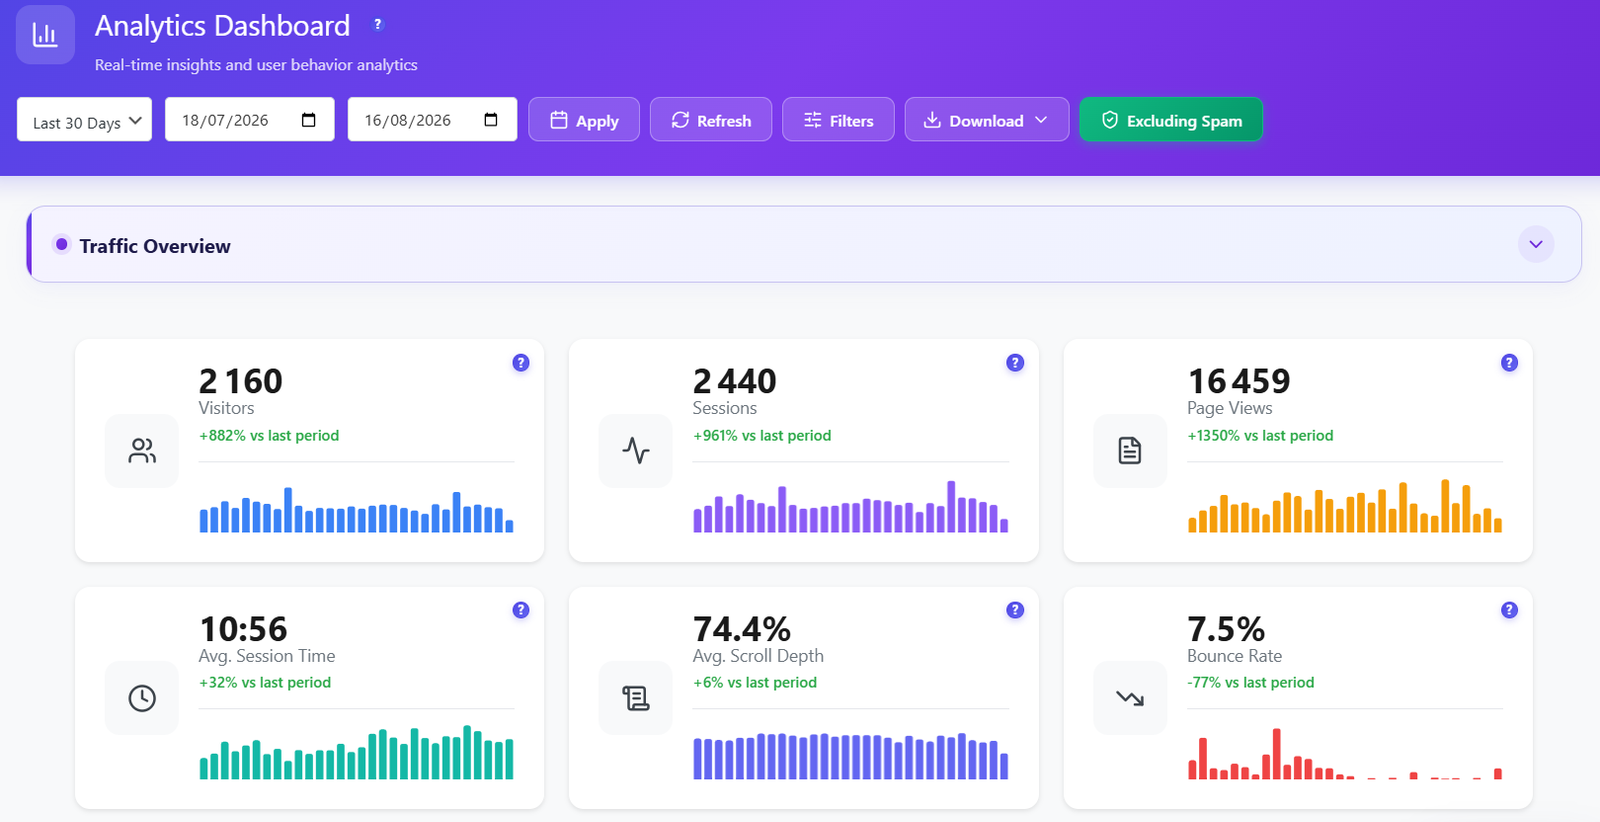
Opti-Behavior Traffic Overview with six KPI cards for visitors, sessions, page views, average session time, average scroll depth and bounce rate, each with a mini bar chart and a percentage change versus the last period

Live KPIs FREE

Six numbers that tell you how the site is doing.

Visitors, sessions, page views, average session time, average scroll depth and bounce rate, each with a mini bar chart and its change against the previous period, so a trend is visible before you read a single number.

TipA falling bounce rate with rising scroll depth is the pair to watch after a redesign.

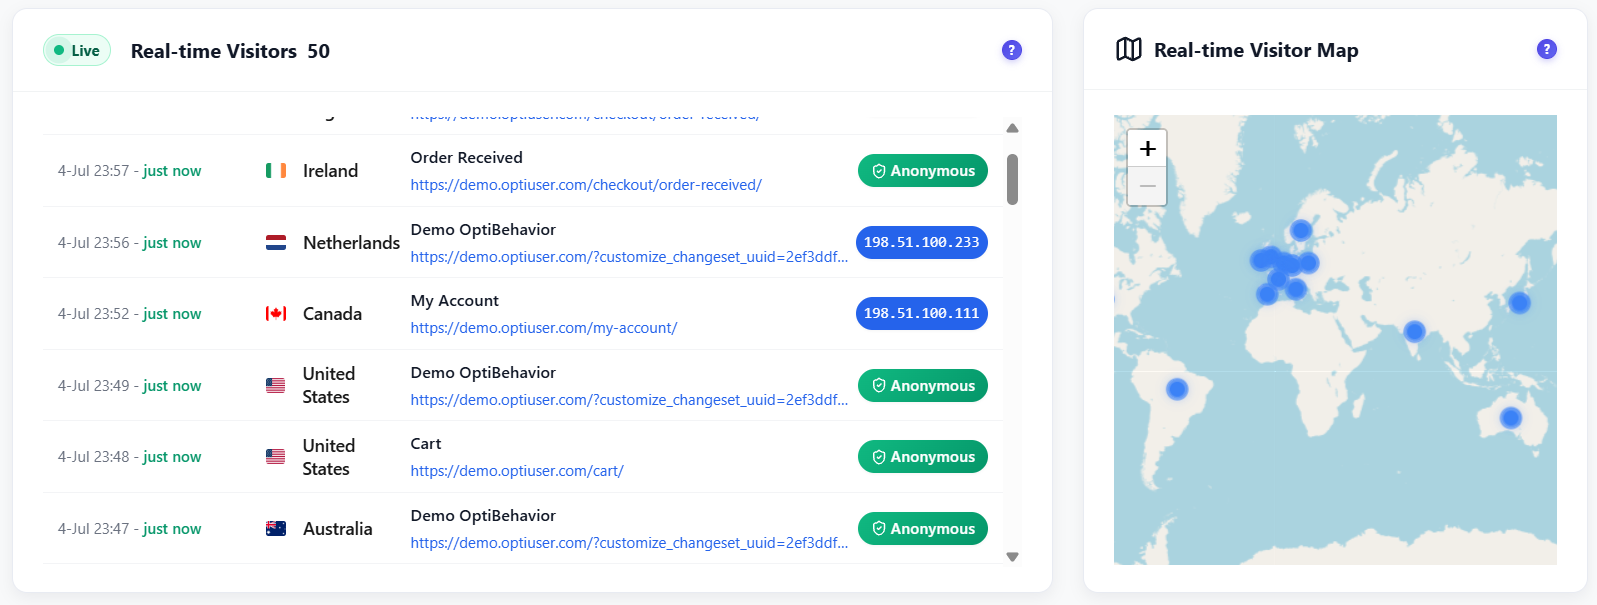
Opti-Behavior Real-time Visitors list with a Live badge and visitor count, showing time, country flag, page title, URL and an Anonymous badge or IP address for each visitor, next to a Real-time Visitor Map of the world with markers

Real-time visitors & map FREE

See who is on your site right now.

A live feed lists each active visitor with the time, country flag, page title and URL, and an interactive world map plots them as markers. The feed ticks about every 5 seconds while the tab is open.

TipKeep this panel open during a launch or newsletter send to watch the wave arrive.

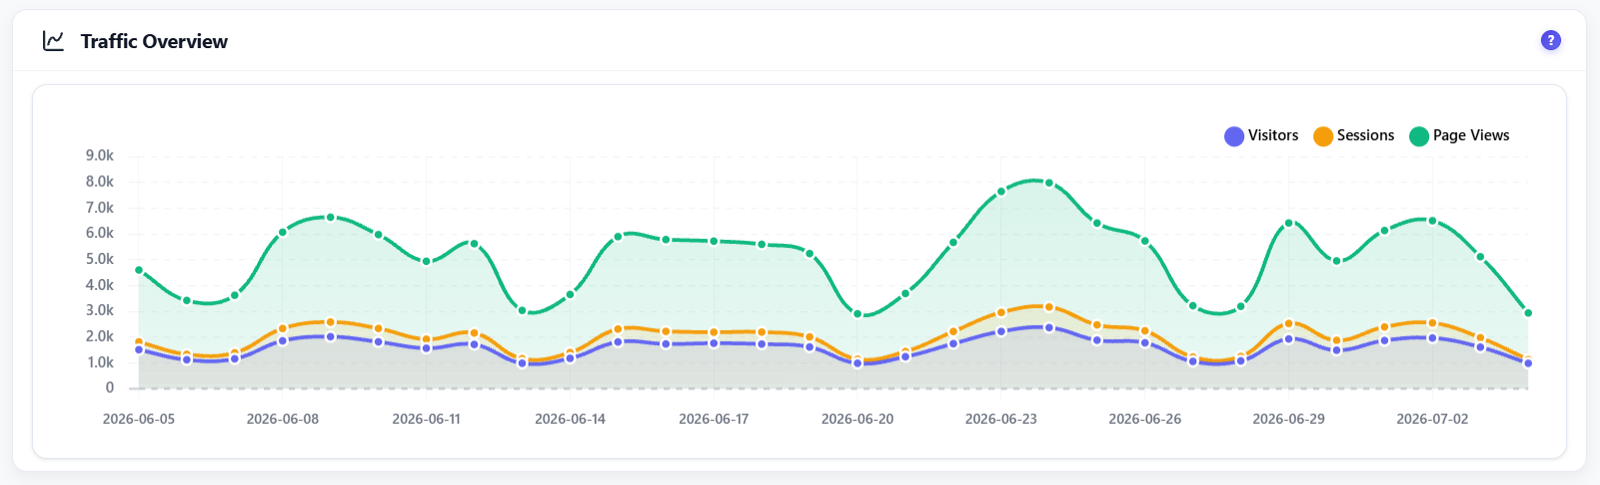
Opti-Behavior Traffic Overview line chart with three series, visitors, sessions and page views, plotted per day with a date axis and a legend

Traffic overview chart FREE

Visitors, sessions and page views on one timeline.

Three smoothed series show the rhythm of your traffic day by day, so a spike from a campaign or a dip from an outage is easy to spot and to date.

TipCompare the gap between page views and visitors: it is your pages-per-visit in a picture.

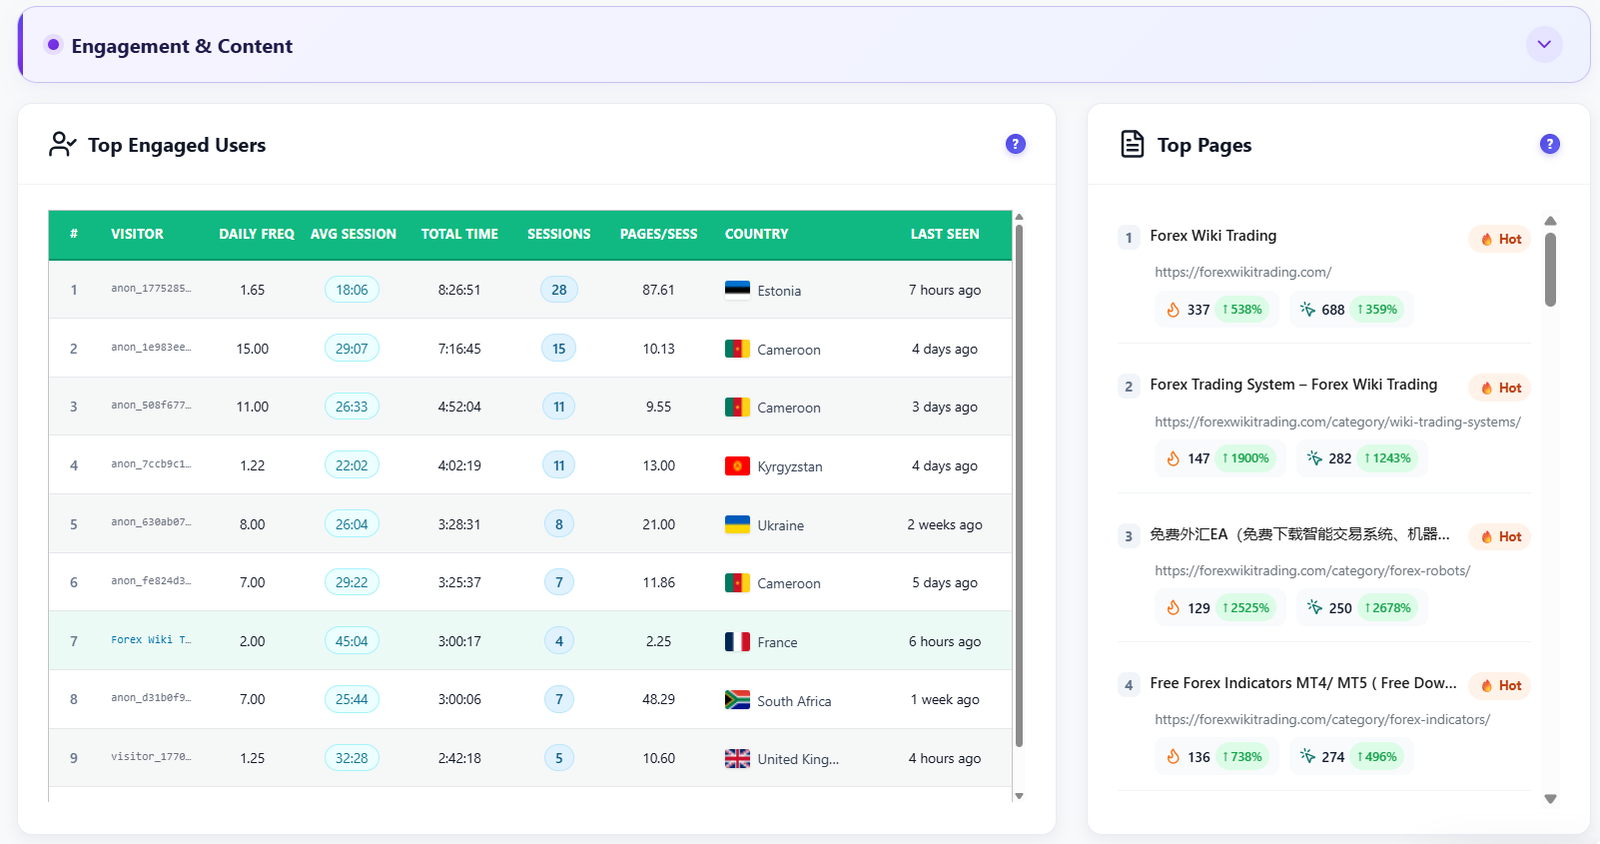
Opti-Behavior Engagement and Content section with a Top Engaged Users table showing daily frequency, average session, total time, sessions, pages per session, country and last seen, and a Top Pages list with Hot badges and growth percentages

Top engaged users & pages FREE

Find your most engaged visitors and your hottest pages.

A ranked table shows how often each visitor returns, how long they stay and how many pages they read, while Top Pages ranks your content with a Hot badge and the change of two engagement counts against the previous period.

TipRead the top pages next to the top users: the same content that keeps loyal readers is your best bet to promote.

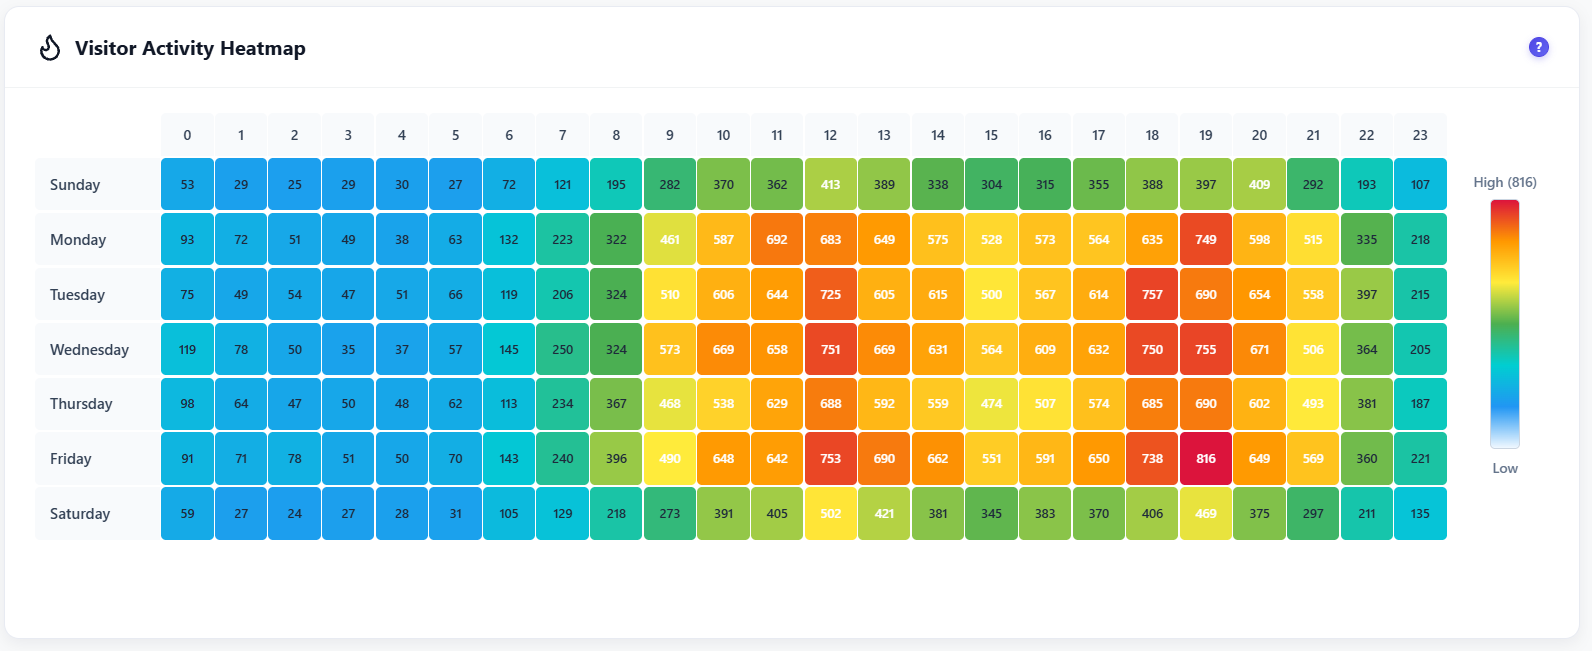
Opti-Behavior Visitor Activity Heatmap, a grid of seven weekdays by 24 hours where each cell shows a visit count colored from low blue to high red, with a Low to High legend

Visitor activity heatmap FREE

Know the hours your audience actually shows up.

A grid of 7 days by 24 hours colours every hour by how many visits arrived, from Low to High. Peak windows jump out, so you can publish, promote and schedule maintenance at the right time.

TipShip updates in the coldest blue window, publish in the reddest one.

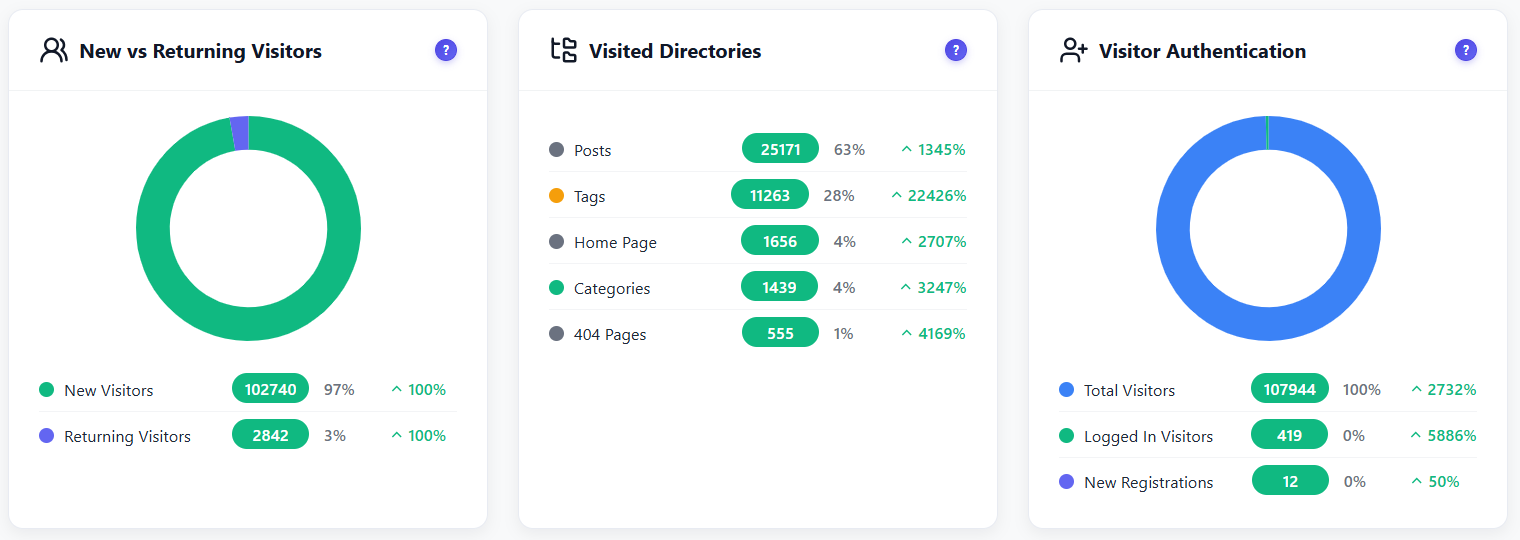
Opti-Behavior audience widgets: New vs Returning Visitors donut, Visited Directories list with posts, tags, home page, categories and 404 pages, and Visitor Authentication donut with total, logged-in visitors and new registrations

Audience insights FREE

New or returning, where they browse, and who is logged in.

Three panels describe your audience: new vs returning visitors, the site sections they visit most, and how many are logged in or newly registered — each with counts, share and change against the previous period.

TipA high 404 share in Visited Directories is a free to-do list of broken links.

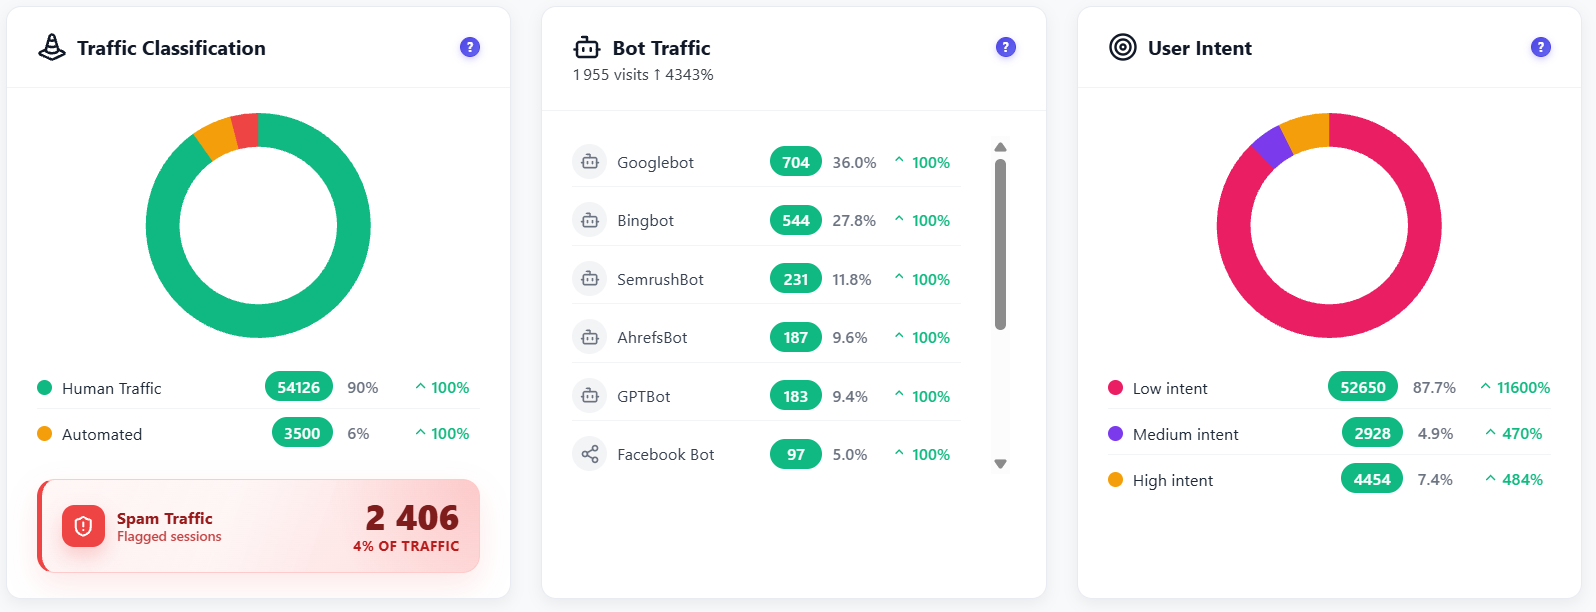
Opti-Behavior traffic quality widgets: a Traffic Classification donut with human and automated traffic and a Spam Traffic card, a Bot Traffic list with Googlebot, Bingbot, SemrushBot, AhrefsBot, GPTBot and Facebook Bot, and a User Intent donut with low, medium and high intent

Traffic quality FREE

Separate real people from bots and spam.

Traffic is classified as human, automated or spam, named bots are ranked with their visits and share, and user intent splits visitors into Low, Medium and High so you know who is actually engaged.

TipTurn on Excluding Spam before you read any other widget.

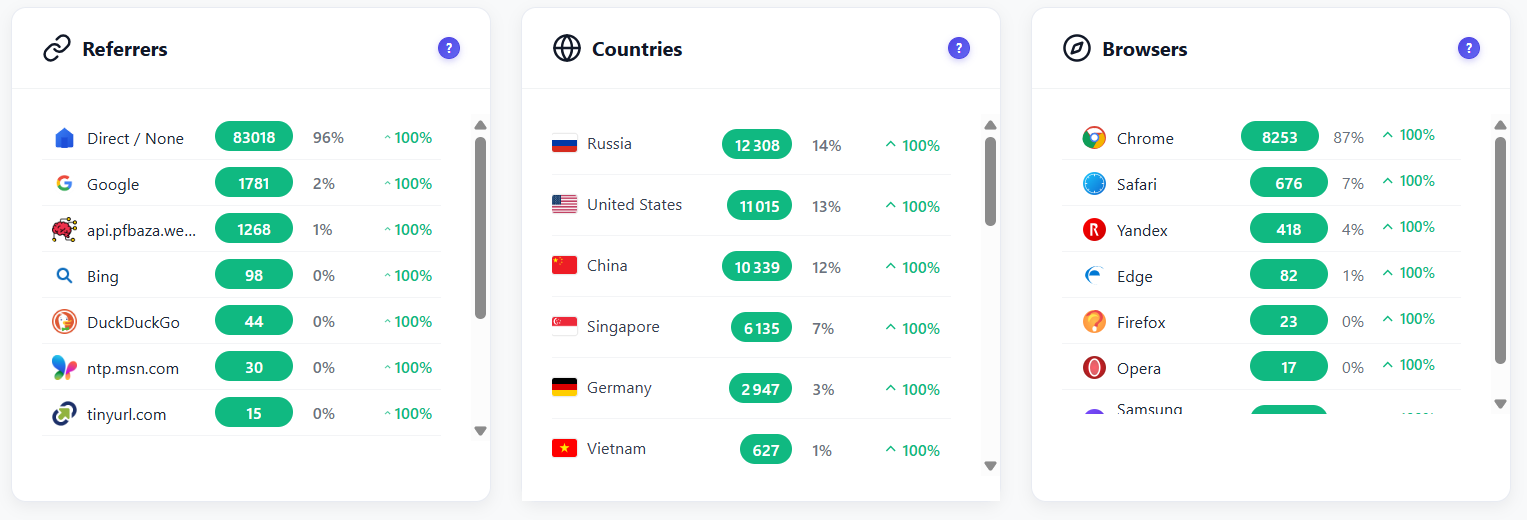
Opti-Behavior Referrers, Countries and Browsers widgets ranking Direct, Google, Bing and DuckDuckGo referrers, countries with flags and browsers such as Chrome, Safari, Edge, Firefox and Opera, each with visits, share and percentage change

Referrers, countries & browsers FREE

Where visitors come from, and what they browse with.

Three ranked lists show the sources sending you traffic, the countries your visitors are in and the browsers they use, each with visits, share and change against the previous period.

TipUse the referrer filter on a domain that surprises you, then check whether it is a bot.

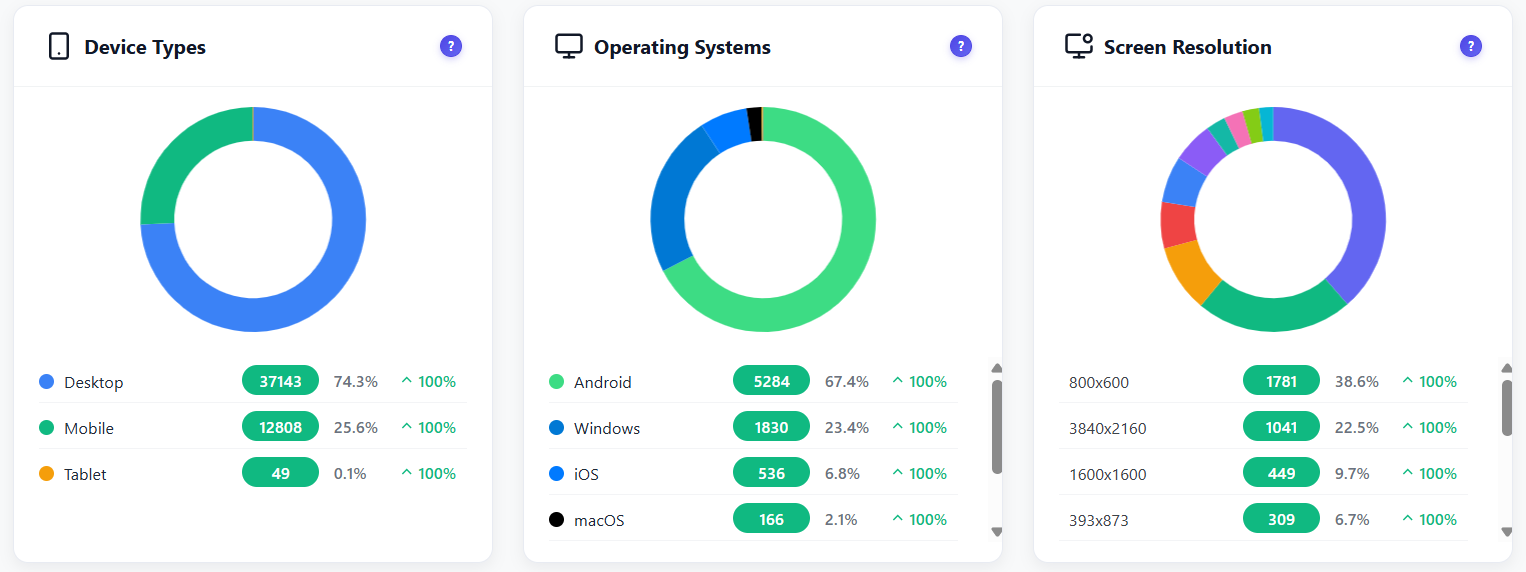
Opti-Behavior Device Types, Operating Systems and Screen Resolution donut charts with desktop, mobile and tablet, Android, Windows, iOS and macOS, and the most common screen resolutions, each with visits, share and change

Devices, systems & screens FREE

Design for the screens your visitors really use.

Device types, operating systems and the actual screen resolutions of your visitors, each with visits, share and change against the previous period, so you prioritise the layouts and browsers that matter.

TipTest your layout at the top resolution in the list before the next redesign.

From install to insight in four steps

1

Install & activate

Add Opti-Behavior from WordPress.org. There is no account to create and no code to paste.

2

A lightweight script collects visits

Pages, sessions, referrers, devices and engagement are recorded as visitors browse. Bots and spam are classified on the way in.

3

Data stays in your database

Everything lives in your WordPress database. Choose Anonymous mode to skip cookies and IP storage altogether.

4

The dashboard updates live

Widgets load in parallel, the live feed ticks every 5 seconds, and you can filter, export or schedule an email report.

Who Uses the Analytics Dashboard?

E-Commerce Owners

Watch live visitors, top pages and referrers during a launch, and separate real shoppers from bots.

Bloggers & Content Creators

See which posts are Hot, which directories get the visits and the hours when readers show up.

Agencies & Freelancers

Give clients a dashboard inside their own WordPress, plus scheduled email reports and CSV exports.

How the Opti-Behavior dashboard compares

Most tools give you a dashboard. What differs is where the data lives, how much you may store and whether bots are separated for you.

Opti-Behavior vs
Opti-Behavior Hotjar · Contentsquare Microsoft Clarity Matomo
Data stays on your server✗ Microsoft servers*
Native WordPress · no external accountPartial · Matomo for WordPress
Real-time visitor feed with world mapPaid · add-on
Bot, automated & spam classification
User intent scoring
Scheduled email reports
No session or page-view limit35 sessions/day on Free
Price€0 – €89/yrwhole plugin, all 10 modules$0 – from $49/mo$0*Free self-hosted · premium from €26/mo

* Clarity is free; Microsoft acts as an independent data controller and may use behavioral data for advertising, and collection is limited in the EU without consent. Hotjar merged into Contentsquare in July 2025: its column shows the Contentsquare Free and Growth plans. Competitor plans change often — check each vendor’s pricing page and documentation before you decide.

Dashboard FAQ

Does the dashboard update in real time?
Yes. The live visitor feed refreshes about every 5 seconds while the tab is open and pauses when it is hidden. The other widgets load in parallel when you open the page or change the period, and the Refresh button reloads them on demand.
Will the dashboard slow down my WordPress admin or my site?
The widgets are loaded in parallel by your own server, with a timeout per widget so one slow panel cannot block the rest. Tracking is a lightweight script and the dashboard only runs in the admin, so it does not add weight to your front-end pages.
How does traffic classification work?
Each visit is classified as human, automated or spam. Known bots such as Googlebot, Bingbot, SemrushBot, AhrefsBot, GPTBot and Facebook Bot are listed with their share, and you can add your own bot patterns and spam thresholds in Settings. The Excluding Spam switch removes flagged sessions from every widget.
Can I filter and export my data?
Yes. Sixteen filters cover visitor attributes (browser, country, device, operating system, visitor type), session attributes (duration and page count), pages and traffic (entry page, exit page, referrer URL, channel) and UTM campaign, source and medium. You can save filters and download CSV or JSON. Pro adds a Full Raw Traffic CSV.
Can I get reports by email?
Yes. Scheduled email reports (daily, weekly or monthly) send key metrics to your inbox through the WordPress mailer or your own SMTP server. See the Settings page for details.
Does it show logged-in users and registrations?
Yes. The Visitor Authentication widget shows total visitors, logged-in visitors and new registrations, and you can exclude administrators from tracking in Settings.
What is the Visitor Activity Heatmap?
A grid of 7 days by 24 hours. Each of the 168 cells shows how many visits arrived at that hour on that weekday, from Low to High, so you can see your peak windows at a glance.
What are Top Engaged Users and Top Pages?
Top Engaged Users ranks visitors by daily frequency, average session, total time, sessions and pages per session, with country and last seen. Top Pages ranks pages with a Hot badge and the change of two engagement counts against the previous period.
How does the real-time map work?
Each active visitor appears in the live list with time, country, page title and URL, and as a marker on an interactive world map. Depending on your privacy mode the list shows an Anonymous badge or the visitor IP. In Anonymous mode nothing personal is stored.
Which devices, browsers and screen sizes are reported?
Device type (desktop, mobile, tablet), operating system, browser and the actual screen resolution are reported with visits, share and change against the previous period, so you can prioritise the layouts your visitors really use.


See Everything. Own Everything.

Install Opti-Behavior for free and open a live dashboard in minutes. All data stays on your server.

Explore
Drag