
Errors & Performance
Tracking
5 monitoring tools in one dashboard: JavaScript Errors, Friction Events (rage clicks, dead clicks), Core Web Vitals, Performance Scoring, and Broken Link Detection. Know everything that goes wrong on your site.
100% Self-Hosted
GDPR Compliant
Real-Time Updates
Unlimited Tracking
5 Monitoring Tools, One Unified Dashboard
Every error, friction event, performance metric and broken link is captured automatically and organized for fast resolution.
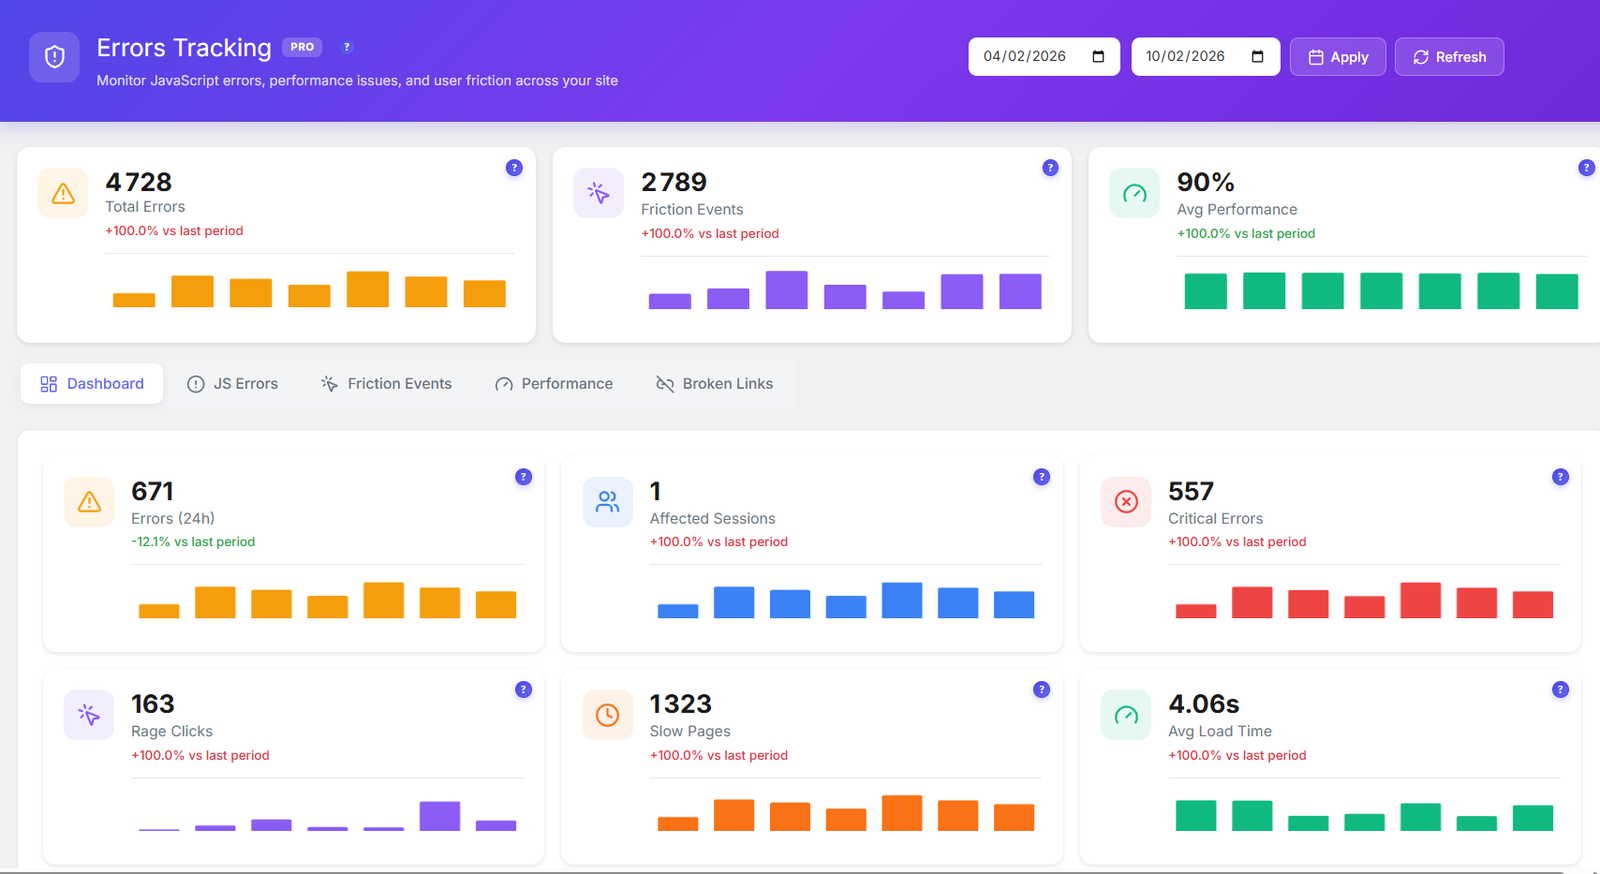
Error Dashboard Overview
Unified dashboard showing all 5 monitoring tools with error counts, severity levels, and quick navigation between JavaScript errors, friction events, performance, and broken links.
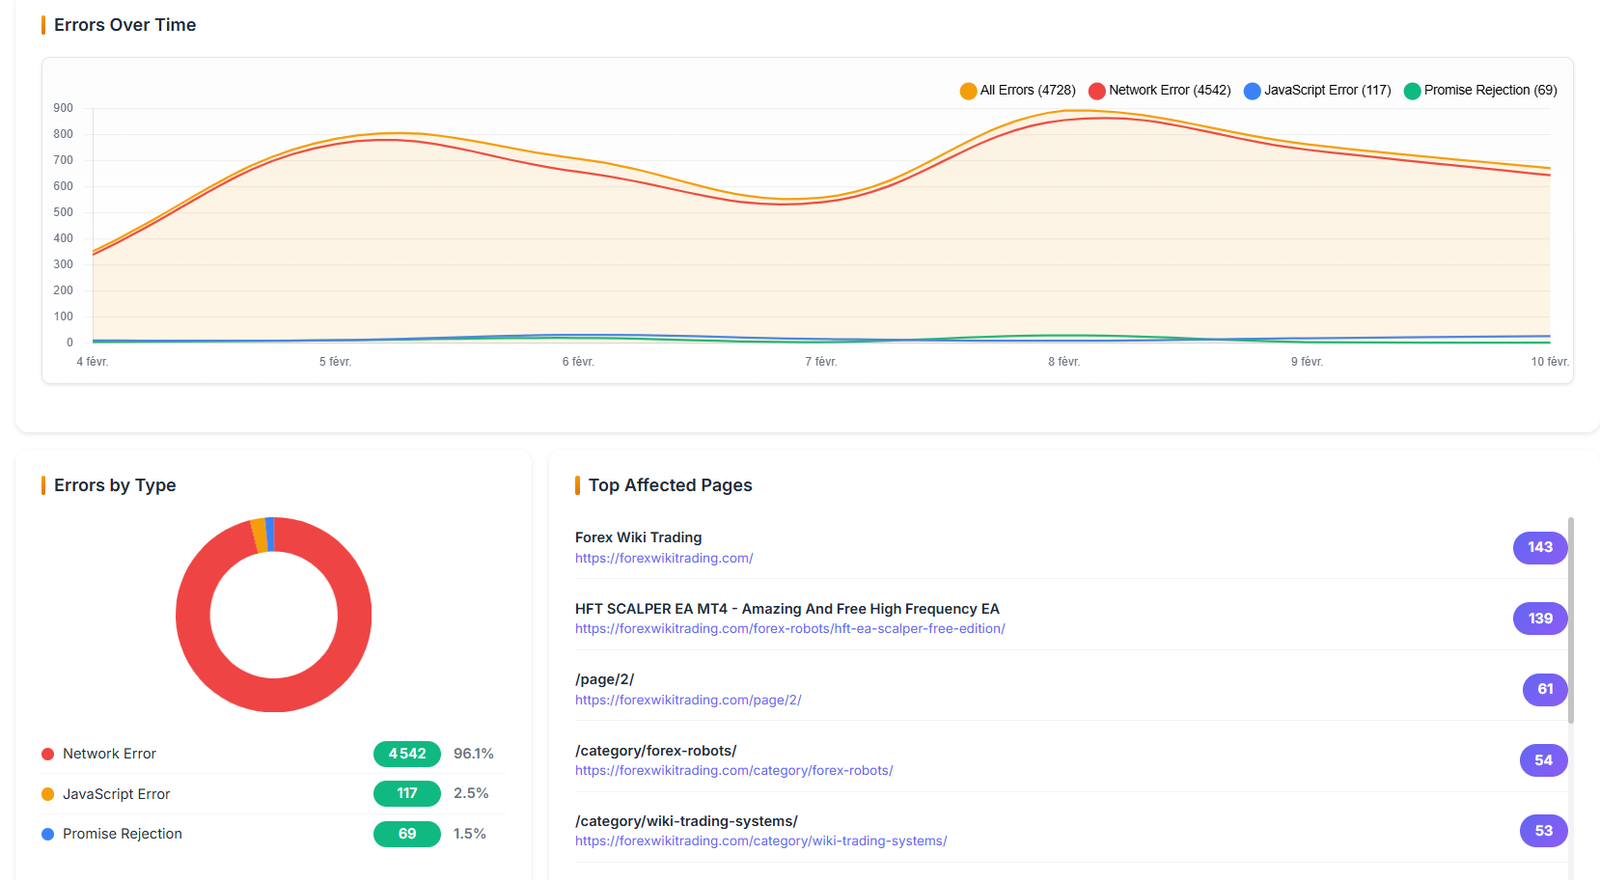
Error Trends & Analytics
Track errors over time with trend charts. See error distribution by type, severity breakdown, and identify patterns that help prioritize fixes.
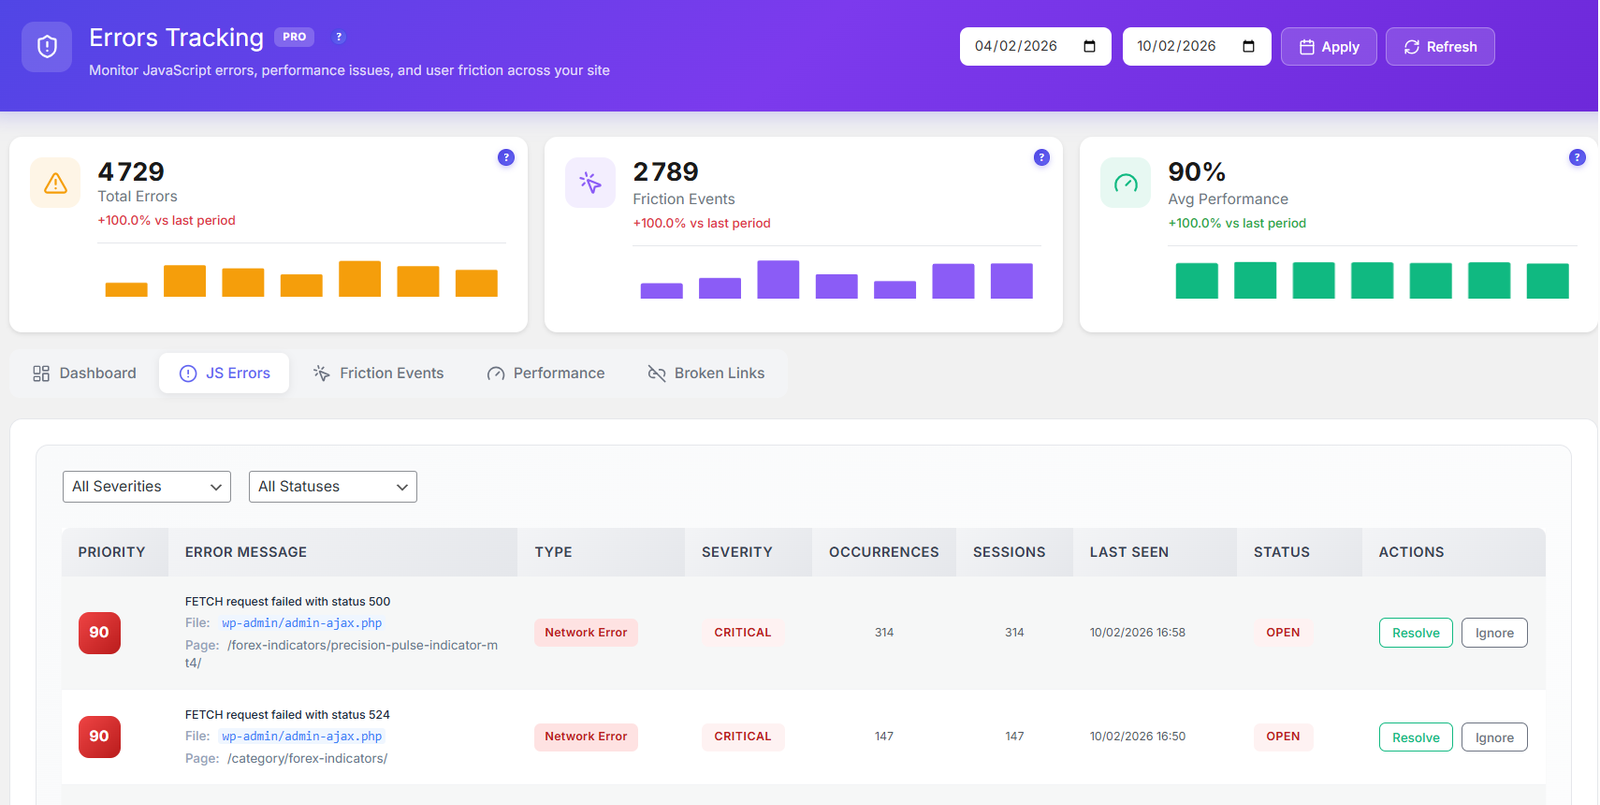
JavaScript Error Tracking
Capture JS errors with full stack traces, affected page URLs, browser info, and occurrence counts. Status workflow: Open → Investigating → Resolved.
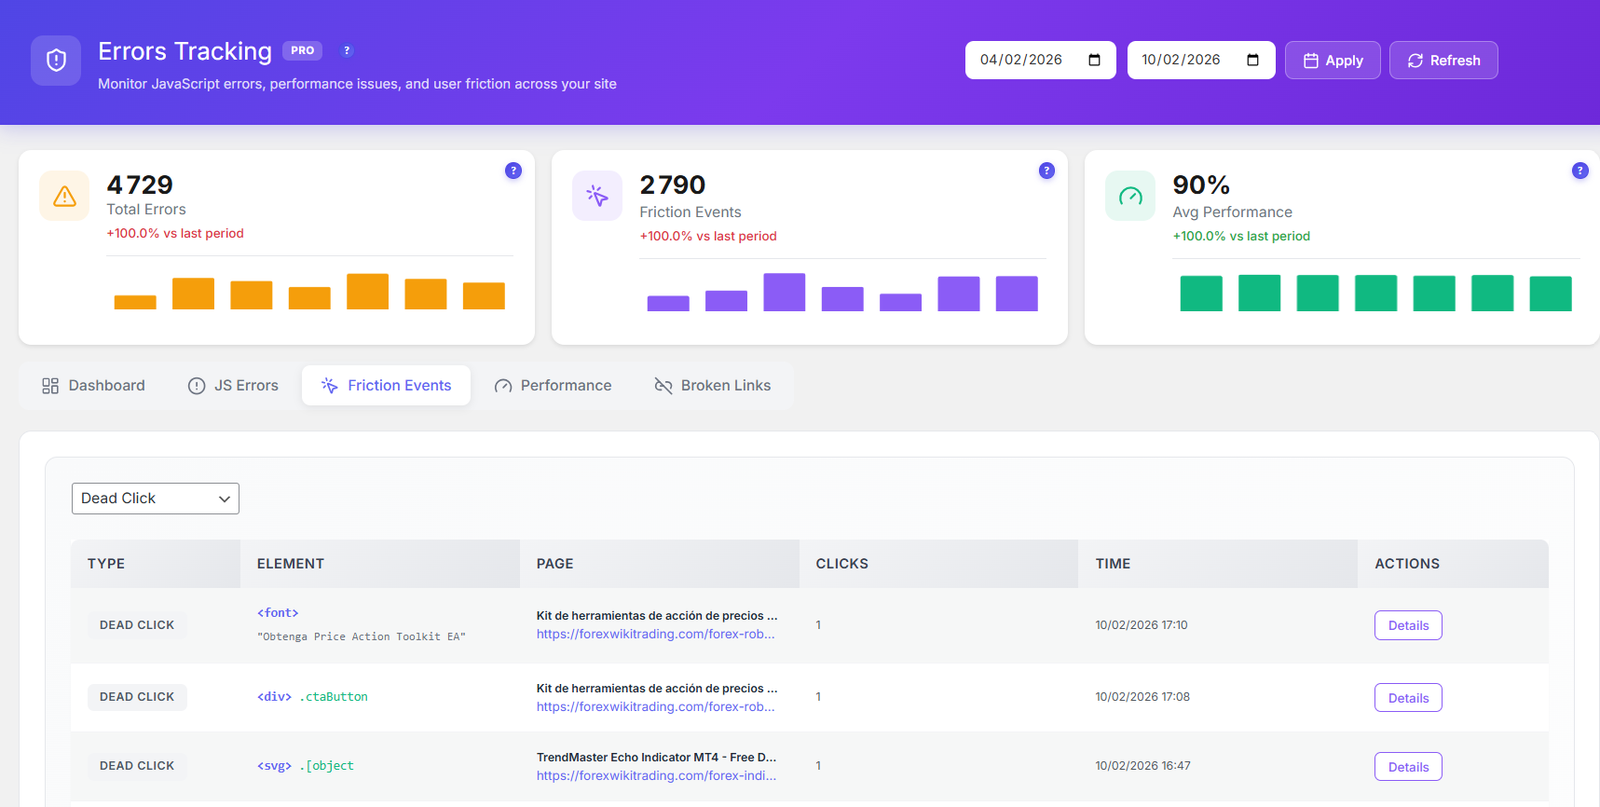
Friction Events Detection
Detect rage clicks (rapid frustrated clicking) and dead clicks (clicking non-interactive elements). Identify UX issues causing user frustration before they leave.
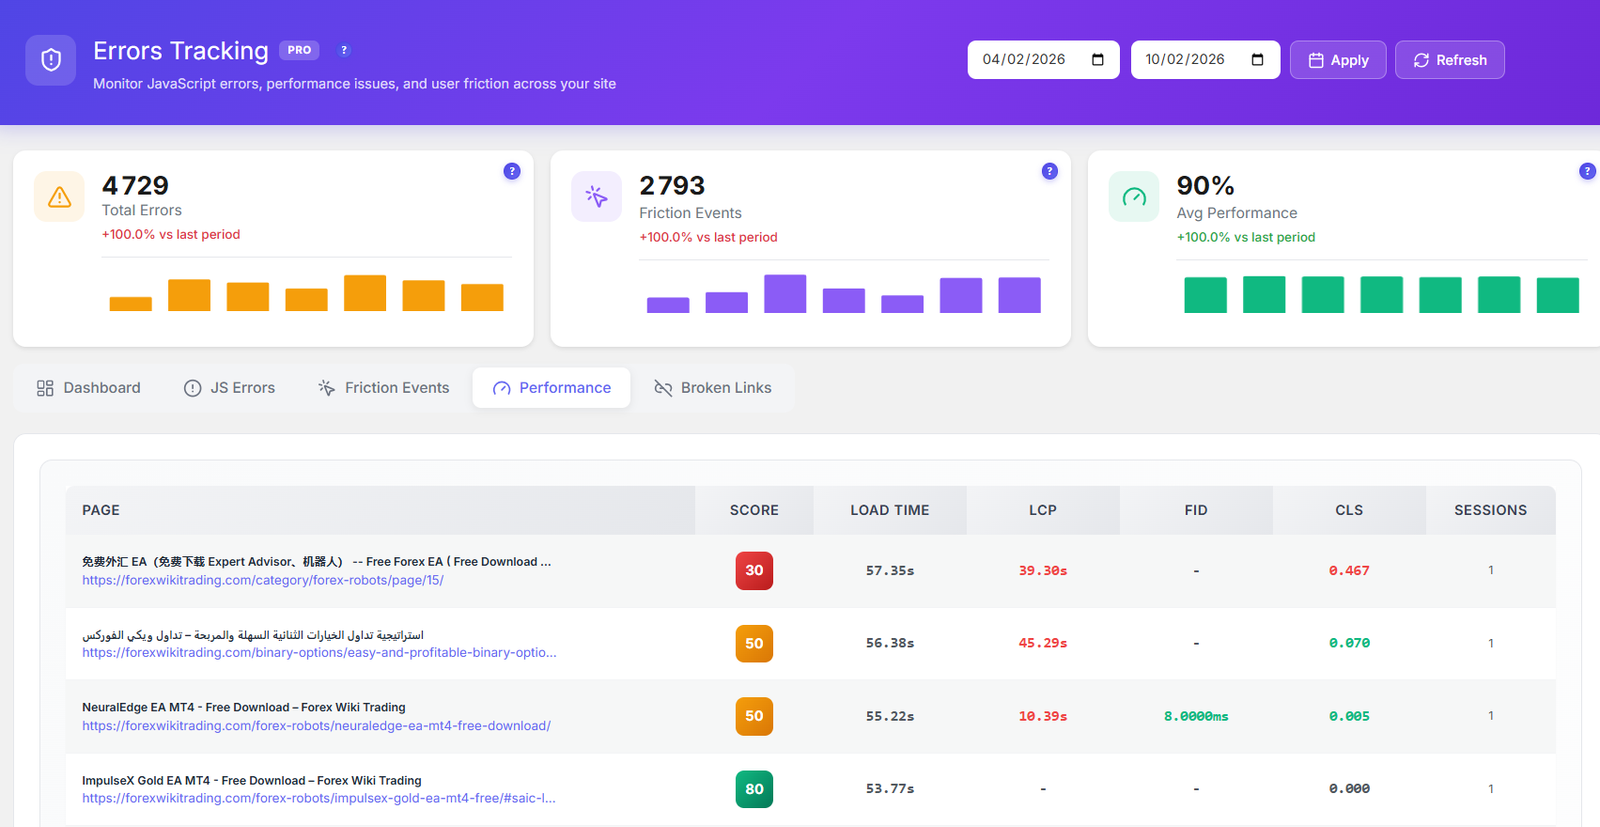
Core Web Vitals Monitoring
Track LCP, FID, CLS, INP, and TTFB scores. Performance scoring from 0-100 per page with Good/Needs Improvement/Poor ratings aligned with Google’s thresholds.
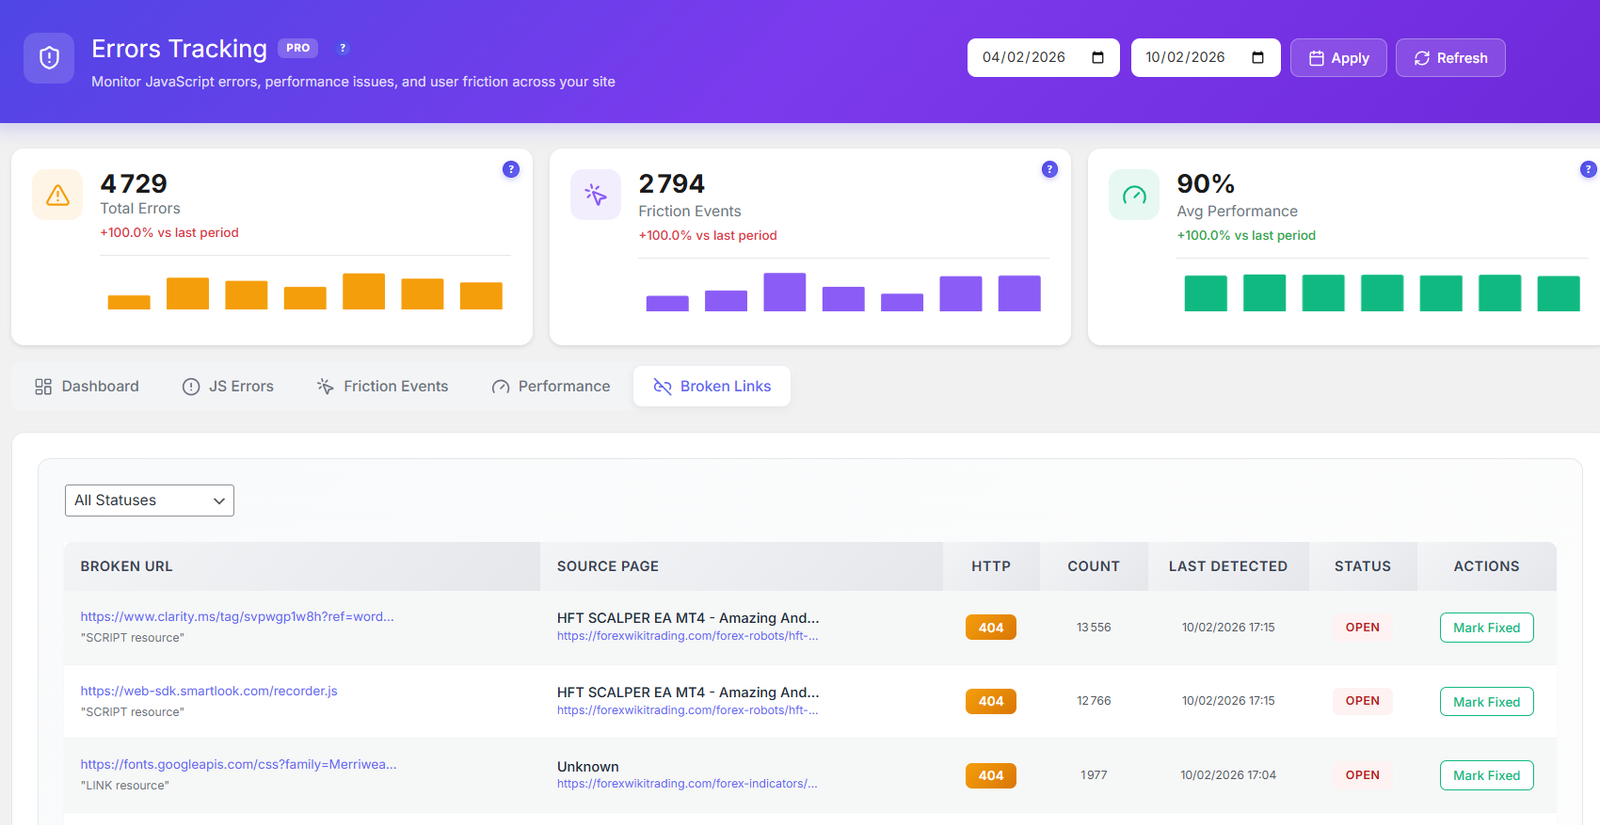
Broken Link Detection
Automatically detect 404 and 500 errors on your site. Track broken links with source page, status code, and discovery date. Fix broken links before they hurt your SEO.
How It Works
1
Enable Error Tracking
Activate error tracking in the Opti-Behavior Pro settings panel. Choose which monitoring tools to enable — JS errors, friction events, Core Web Vitals, performance scoring, or broken links.
2
Automatic Monitoring Begins
The tracking script monitors errors, clicks, and performance metrics in real-time. All data is captured client-side and sent to your server — no third-party services involved.
3
Classification & Severity Scoring
Errors are automatically classified by severity and type. JavaScript errors get stack traces, friction events get element selectors, and performance issues get scored against Web Vitals thresholds.
4
Review, Investigate & Resolve
Review, investigate, and resolve issues from the dashboard. Use the status workflow to track progress from Open through Investigating to Resolved.
Who Uses Error & Performance Tracking?
Site Reliability
Monitor JavaScript errors and broken links to catch issues before users complain. Priority scoring helps focus on high-impact problems first.
UX Optimization
Detect rage clicks and dead clicks to find elements that confuse or frustrate users. Fix friction points to improve conversion rates.
Performance Monitoring
Track Core Web Vitals scores per page. Identify slow pages, layout shifts, and interaction delays that hurt SEO and user experience.
Error Tracking Comparison
| Feature | Opti-Behavior | Hotjar | MS Clarity | Sentry |
|---|---|---|---|---|
| JS Error Tracking | ✓ Pro | ✗ | ✗ | ✓ $29+/mo |
| Rage/Dead Clicks | ✓ Pro | ✗ | ✓ | ✗ |
| Core Web Vitals | ✓ Pro | ✗ | ✗ | ✗ |
| Broken Links | ✓ Pro | ✗ | ✗ | ✗ |
| Performance Score | ✓ Pro | ✗ | ✗ | ✓ |
| Status Workflow | ✓ Pro | ✗ | ✗ | ✓ |
| Self-Hosted | ✓ | ✗ | ✗ | ✗ |
| Price | $46/yr | $213+/mo | $0* | $29+/mo |
* Microsoft Clarity is free but Microsoft uses your visitors’ data for advertising.
Error Tracking FAQ
What types of errors does it track?
Opti-Behavior tracks 5 types of issues: JavaScript errors with full stack traces, rage clicks (frustrated repeated clicking), dead clicks (clicks on non-interactive elements), Core Web Vitals performance metrics (LCP, FID, CLS, INP, TTFB), and broken links (404/500 HTTP errors).
How does rage click detection work?
Opti-Behavior detects when a user clicks rapidly on the same element multiple times within a short period. This pattern indicates frustration — usually because a button isn’t responding, a link is broken, or an interactive element isn’t working as expected. Each rage click event is logged with the element selector and page URL.
Does it monitor Core Web Vitals automatically?
Yes. Once activated, Opti-Behavior Pro automatically measures LCP (Largest Contentful Paint), FID (First Input Delay), CLS (Cumulative Layout Shift), INP (Interaction to Next Paint), and TTFB (Time to First Byte) for every page visit. Each page gets a performance score from 0–100.
Can I track the status of errors (open, investigating, resolved)?
Yes. Every error has a status workflow: Open, Investigating, and Resolved. You can update statuses as your team works through issues. Errors also have severity levels and priority scoring to help you focus on the most impactful problems first.
How does broken link detection work?
The plugin monitors HTTP responses on your site and logs any 404 (Not Found) or 500 (Server Error) responses. It records the broken URL, the referring page, and the number of times the error occurred, so you can quickly find and fix dead links that hurt SEO and user experience.
Fix Issues Before Users Complain
Get Opti-Behavior Pro and start catching JavaScript errors, friction events, performance issues, and broken links — all from one self-hosted dashboard.