
User Journey
Analytics
Visualize how visitors navigate your site with interactive Sankey flow diagrams. Discover top paths, analyze entry/exit pages, group URLs by pattern, and create funnels from discovered navigation flows.
100% Self-Hosted
GDPR Compliant
Real-Time Updates
Unlimited Tracking
Understand How Users Navigate Your Site
Stop guessing which paths users take. See actual navigation flows visualized as interactive Sankey diagrams with full entry/exit analysis.
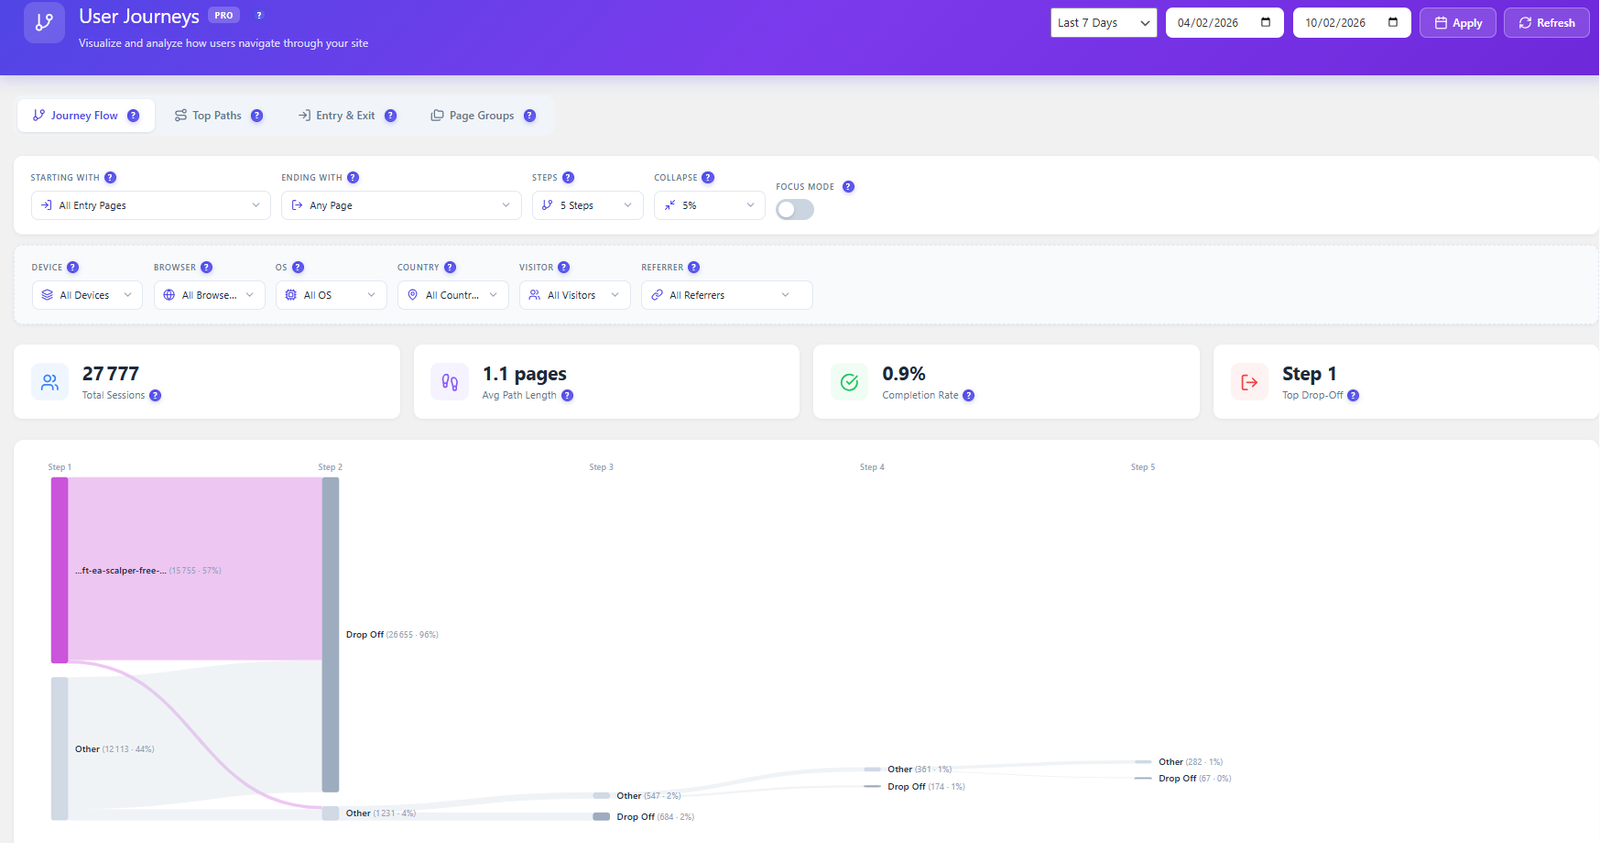
Sankey Flow Diagrams
Interactive Sankey diagrams visualize user navigation step by step. See traffic volume between pages, identify the most popular paths, and discover unexpected navigation patterns.
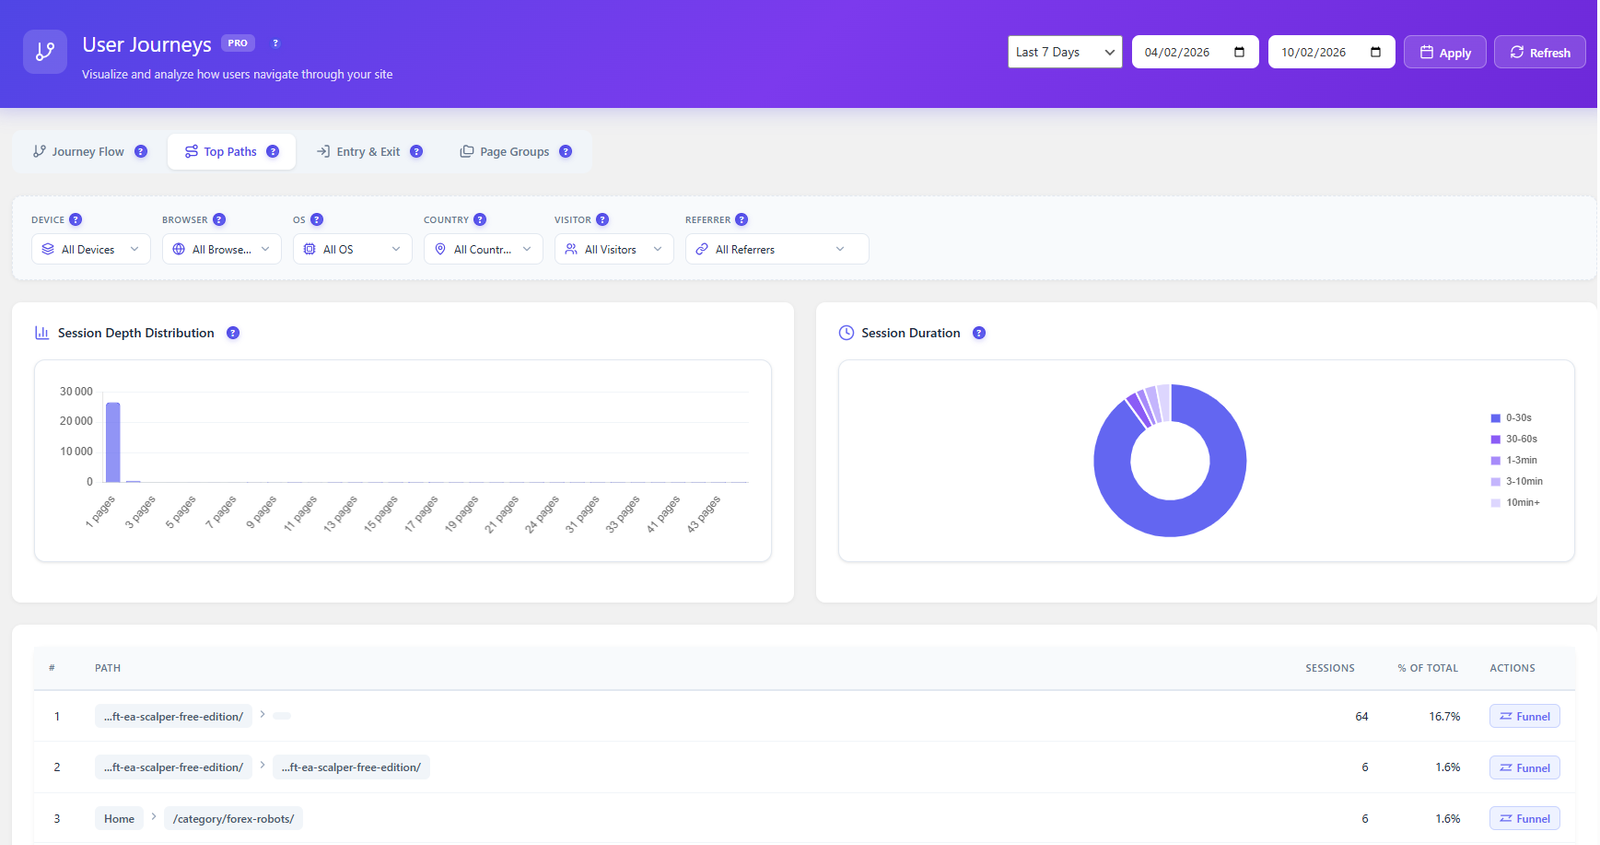
Top Paths Discovery
Automatically discover the most-traveled paths on your site. See session counts per path, average time spent, and one-click funnel creation from any discovered path.
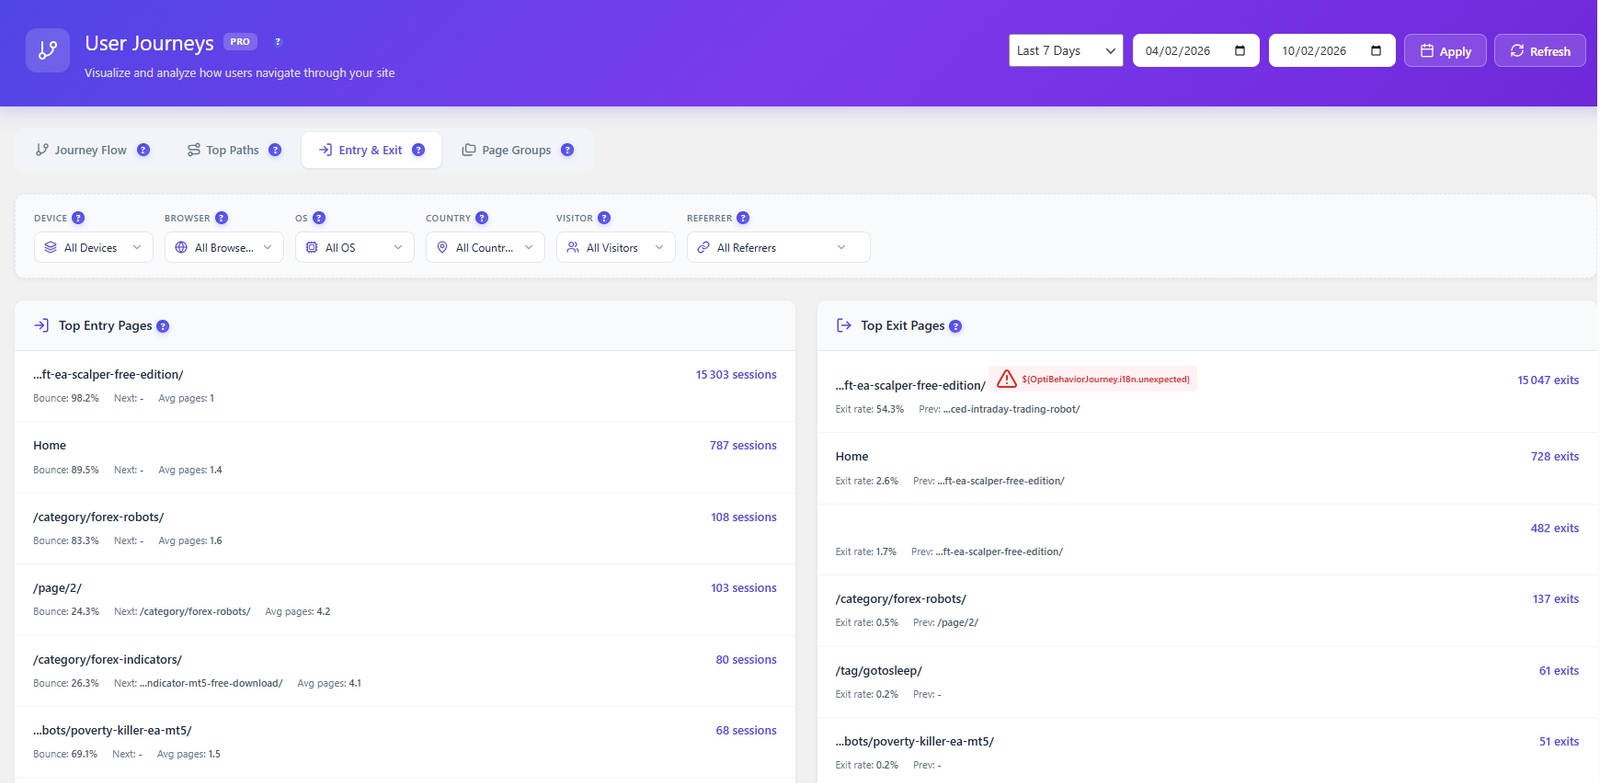
Entry & Exit Page Analysis
Know where visitors land on your site and where they leave. Entry/exit page analysis shows which pages attract traffic and which ones cause users to bounce.
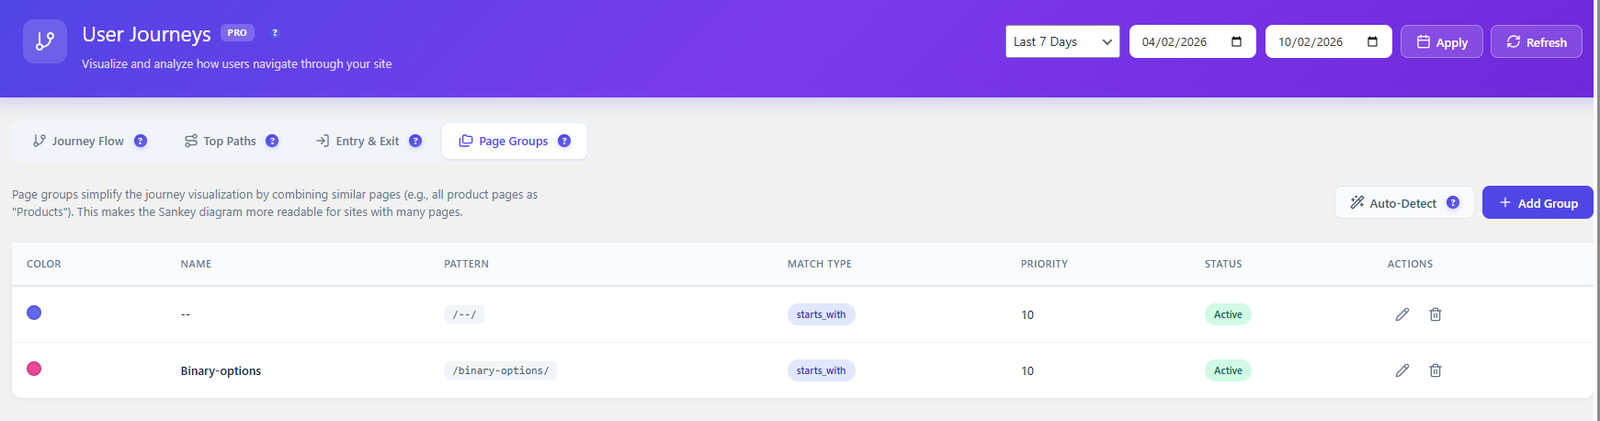
Page Groups & URL Patterns
Group similar URLs together for cleaner analysis. Combine /product/shoe-1, /product/shoe-2, etc. into a single “Products” group. Supports wildcard and regex patterns.
How It Works
1
Enable Journey Tracking
Activate user journey tracking in the Opti-Behavior Pro settings. The tracking script automatically captures page navigation sequences for every visitor session.
2
Navigation Data Accumulates
As visitors browse your site, their complete page-to-page navigation paths are recorded. Data is aggregated to reveal common patterns and traffic flows.
3
Explore the Sankey Diagram
Open the User Journeys page to see an interactive Sankey diagram. Hover over flows to see traffic volumes. Click nodes to drill into specific page transitions.
4
Create Funnels from Paths
Found an important path? Click “Create Funnel” to instantly turn any discovered navigation path into a tracked conversion funnel with dropout analysis.
Who Uses Journey Analytics?
Information Architecture
See how users actually navigate your site versus how you designed it. Discover if your menu structure and page hierarchy match real user behavior.
Revenue Optimization
Identify the most common paths to purchase. Understand which content pages lead to conversions and optimize internal linking to guide more users to revenue pages.
Content Strategy
Discover which blog posts lead to product pages, which landing pages drive the most engagement, and which content dead-ends cause visitors to leave.
Journey Analytics Comparison
| Feature | Opti-Behavior | Hotjar | MS Clarity | Matomo |
|---|---|---|---|---|
| Sankey Flow Diagrams | ✓ Pro | ✗ | ✗ | ✓ Paid |
| Top Paths Discovery | ✓ Pro | ✗ | ✗ | ✓ |
| Entry/Exit Analysis | ✓ Pro | ✗ | ✗ | ✓ |
| URL Grouping | ✓ Pro | ✗ | ✗ | ✓ |
| One-Click Funnel Creation | ✓ Pro | ✗ | ✗ | ✗ |
| Self-Hosted Data | ✓ | ✗ | ✗ | ✓ |
| Price | $46/yr | N/A | N/A | €26+/mo |
User Journeys FAQ
What is a Sankey flow diagram?
A Sankey diagram is an interactive visualization that shows how visitors flow between pages on your site. The width of each flow represents the number of sessions taking that path, making it instantly clear which navigation routes are most popular and where users drop off.
How many steps can a journey path have?
You can analyze paths from 3 to 7 steps. This range covers most user flows while keeping the Sankey diagram readable. You can adjust the step count to zoom in on specific parts of the user journey.
What are Page Groups and how do they help?
Page Groups let you combine similar URLs into a single group using pattern matching. For example, you can group all blog posts (/blog/*) into one node called “Blog” instead of showing each individual post. This makes the Sankey diagram cleaner and more useful for sites with many pages.
Can I create a funnel from a discovered journey path?
Yes. When you discover a popular path in the Top Paths analysis, you can convert it into a Conversion Funnel with one click. This lets you track conversion rates and drop-off points for paths your visitors are already taking naturally.
Can I filter journeys by device, browser, or country?
Yes. User Journey Analytics includes filters for device type, browser, operating system, country, and referrer source. This helps you compare how different audience segments navigate your site and identify segment-specific optimization opportunities.
Map Your Users’ Journey Today
Get Opti-Behavior Pro and see exactly how visitors navigate your site. Interactive Sankey diagrams, top paths discovery, and one-click funnel creation — all self-hosted.