
Skip links
iconOpti-Behavior
made by OptiUser

Smart Insights for wp mark whiteWordPress · woo markWooCommerce FREE PRO

Stop reading charts.
Get the next fix,
ranked by impact.

Smart Insights reads your own behavior data and lists the problems worth fixing — each with the visitors it costs, the evidence, a confidence level and one next action. A weekly CRO briefing on top, and nothing leaves your WordPress server.

Smart Insights core is free on WordPress.org · Pro adds 26 more signals and deeper evidence · No credit card

Admin in 6 languages · Multisite ready

← Back to overview

105

visitors at risk on the top item. The briefing puts the biggest leak first.

Do this

Start with the top row of the briefing.

105

visitors dropped out of one funnel. Impact is counted in visitors, not percentages.

Fix

Open the report the card points to, then mark the status.

72

visitors lost versus your site average, explained by four measured causes.

Fix

Open the recordings filtered to this page and review the first failed interactions.

52.8%

exit rate for new visitors, against 30.0% for everyone else. One segment carries it.

Fix

Open journeys and recordings filtered to that segment.

Filter every insight by
  • Period
  • Status
  • Severity
  • Category
  • Entity type
  • Confidence
Example data
wp mark white
5.0 Rated on WordPress.org
1,700+ active installsSites running Opti-Behavior today
woo mark
Built for WooCommerceCheckout, cart and product-page funnels
Self-hosted: visitor data stays on your own server.Native WordPress · no cookies required
Cache plugin compatible
wp rocketWP Rocketlitespeed cacheLiteSpeed Cachew3 total cacheW3 Total Cachewp super cacheWP Super CacheautoptimizeAutoptimizesg optimizerSG OptimizerperfmattersPerfmatterswp optimizeWP-Optimizejetpack boostJetpack BoostbreezeBreezewp fastest cacheWP Fastest CachehummingbirdHummingbirdnitropackNitroPackflyingpressFlyingPresscache enablerCache Enablerswift performanceSwift Performanceasset cleanupAsset CleanUp
Works with all themes & page builders
elementorElementordiviDivibeaver builderBeaver BuilderwpbakeryWPBakerygutenbergGutenbergOxygenbrizyBrizybreakdanceBreakdancesiteoriginSiteOriginastraAstrageneratepressGeneratePresskadenceKadencethemifyThemifymotopressMotoPresslive composerLive ComposeroceanwpOceanWPblocksyBlocksyneveNeve
6
Free Signals
Bounce, exit rate, scroll depth, engagement, mobile and traffic spikes
26
Pro Signals
Funnels, checkout, forms, errors, recordings, campaigns and more
5
Lifecycle Stages
Detected, diagnosed, hypothesis, testing, verified
✓
Weekly CRO Briefing
One recommended action, from your own data

Dashboards show numbers. Smart Insights shows what to do next.

You already collect the data. What is missing is a ranked list of problems, the proof behind each one and a way to know the fix worked.

The problem

Twenty reports, no clear next step

Heatmaps, funnels, recordings and errors each tell part of the story, and you are left to connect them.

With Opti-BehaviorEach insight names the problem, shows the evidence and points to the one report to open next.

The problem

Percentages hide the big leaks

A 50% drop on 100 sessions loses 50 visitors. A 10% drop on 10,000 sessions loses 1,000.

With Opti-BehaviorImpact is counted in visitors lost, and the largest leak comes first.

The problem

Small samples look like emergencies

Fifty-two mobile sessions can look terrible and mean nothing.

With Opti-BehaviorEvery insight carries a confidence level, and thin data is labelled an observation, not a loss.

The problem

Nobody checks that the fix worked

A change ships, the dashboard moves a little, and the question is never closed.

With Opti-BehaviorMark an insight resolved and the same metric is re-measured after a full window: did it move?

From the weekly briefing to proof that the fix worked

It runs on the behavior data Opti-Behavior already stores, with plain arithmetic you can check, and all of it stays on your server.

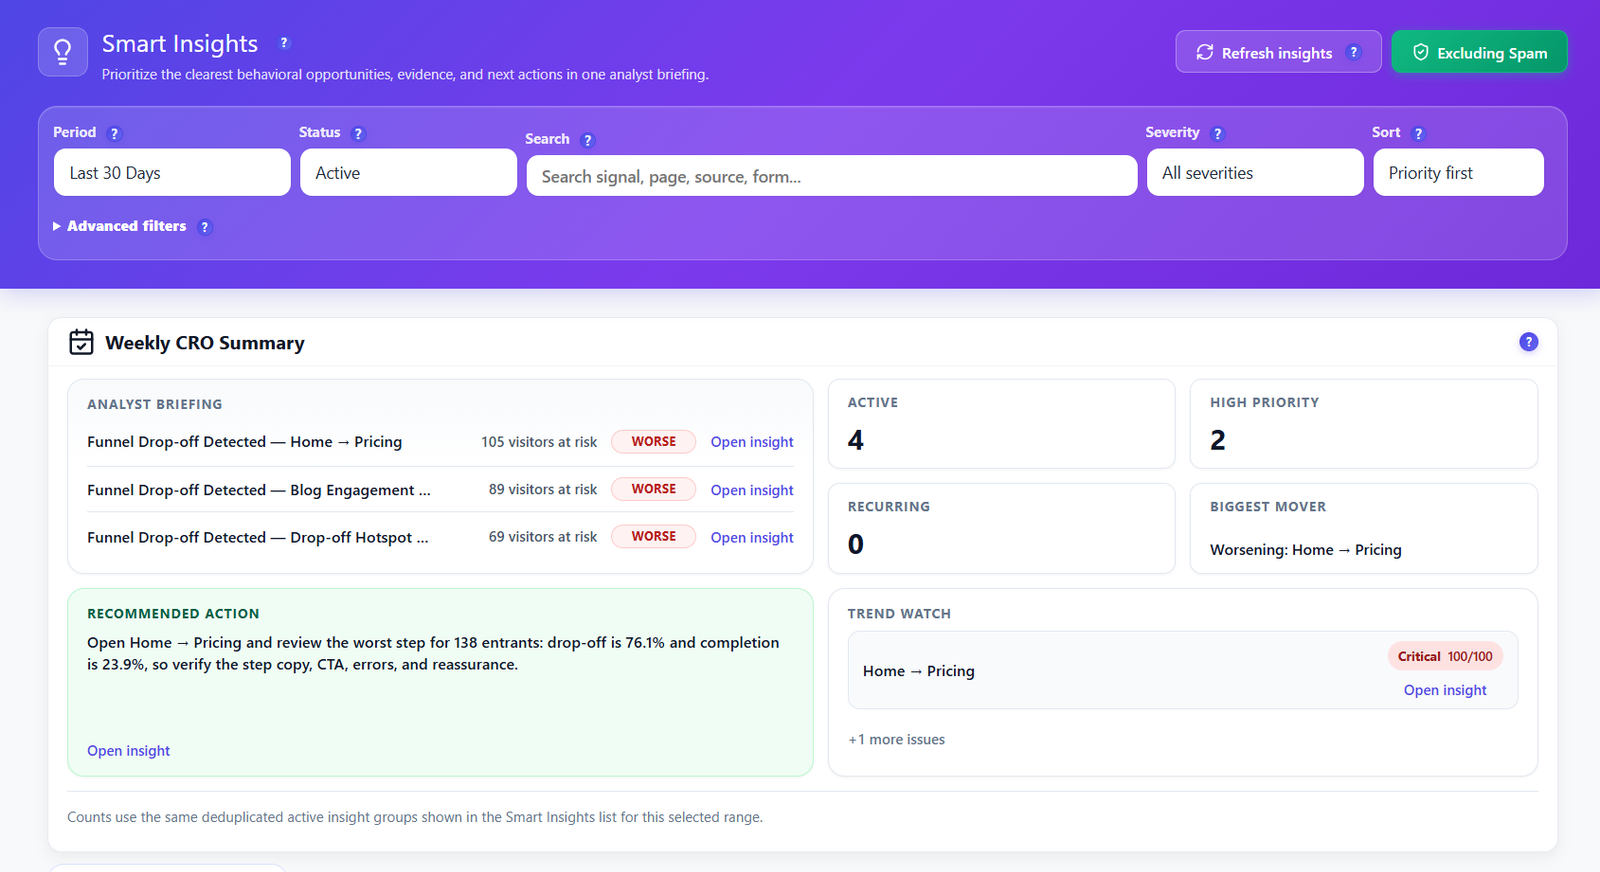
Opti-Behavior Smart Insights page with period, status, search, severity and sort filters above a Weekly CRO Summary: analyst briefing with visitors at risk, active and high priority counts, biggest mover, recommended action and trend watch

Weekly CRO summary PRO

Your Monday briefing, written from your own data.

The Weekly CRO Summary opens the page like an analyst’s note: the top issues with the visitors at risk and whether each got better or worse, counts of active, high-priority and recurring issues, the biggest mover, a trend watch and one recommended action. Free sites see a preview; Pro shows the full briefing.

  • Top issues with visitors at risk and a Worse / Better tag
  • Active, high priority and recurring counts
  • Biggest mover and a trend watch
  • Counts match the deduplicated list below, so the numbers agree

Fix itRead the briefing before the Monday meeting, then open only the top insight.
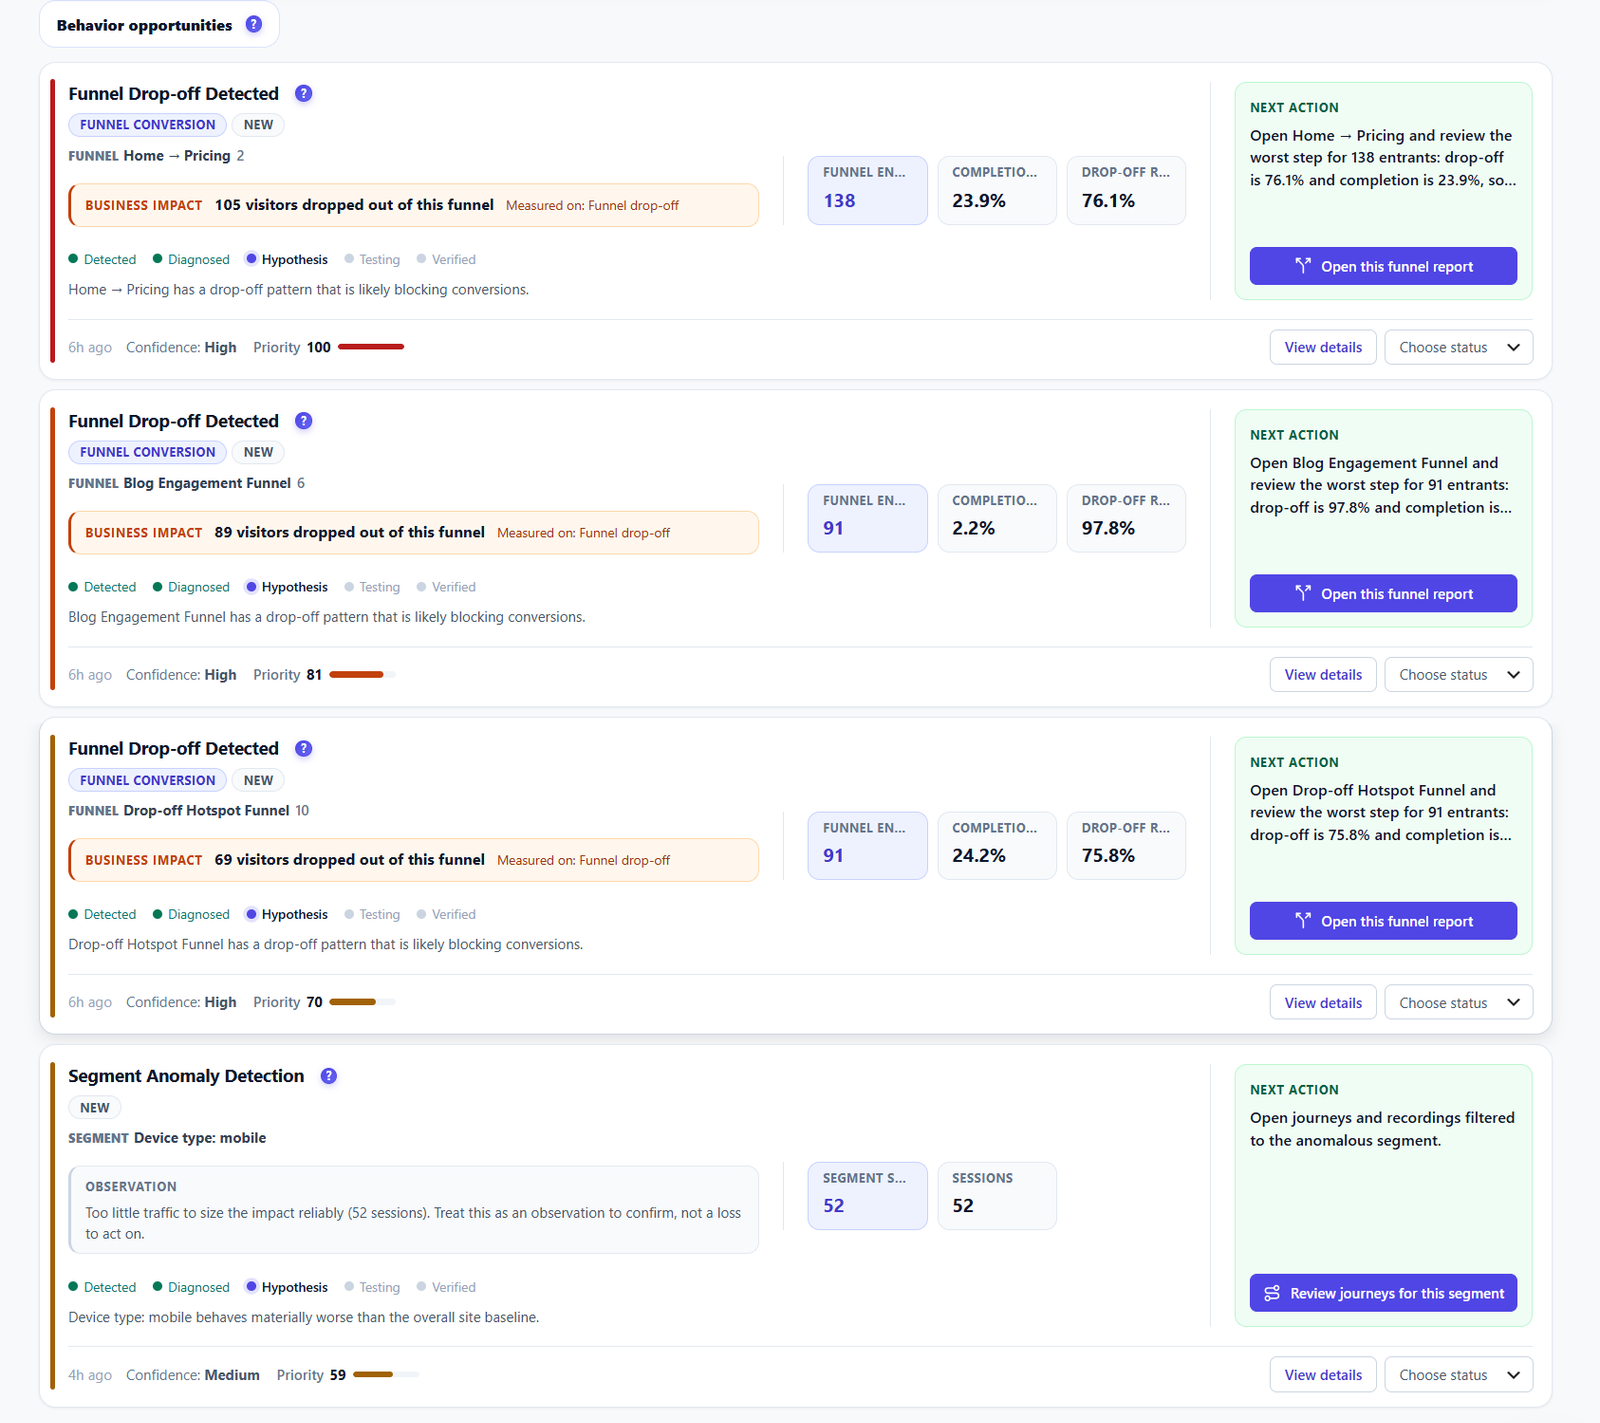
Opti-Behavior behavior opportunity cards for Funnel Drop-off Detected and Segment Anomaly Detection with business impact, a lifecycle from Detected to Verified, confidence, priority score, a next action and an Open this funnel report button

Behavior opportunities FREE PRO

Each problem comes with its cost and its next step.

A card names the problem, the category and the funnel or page, then gives the business impact in visitors lost, a lifecycle tag, confidence, a 0–100 priority and a green Next Action box with a button to the right report. Free covers page-level signals; Pro adds funnels, checkout, forms, errors, recordings, campaigns and segment anomalies.

  • Free: 6 page-level signals such as bounce, exit rate, scroll depth and traffic spikes
  • Pro: 26 more, from cart and checkout drop-off to form friction and campaign mismatch
  • Thin data is labelled an observation, not a loss
  • Status menu to track each insight through your work

Fix itWork top to bottom: the list is already ordered by visitors lost.

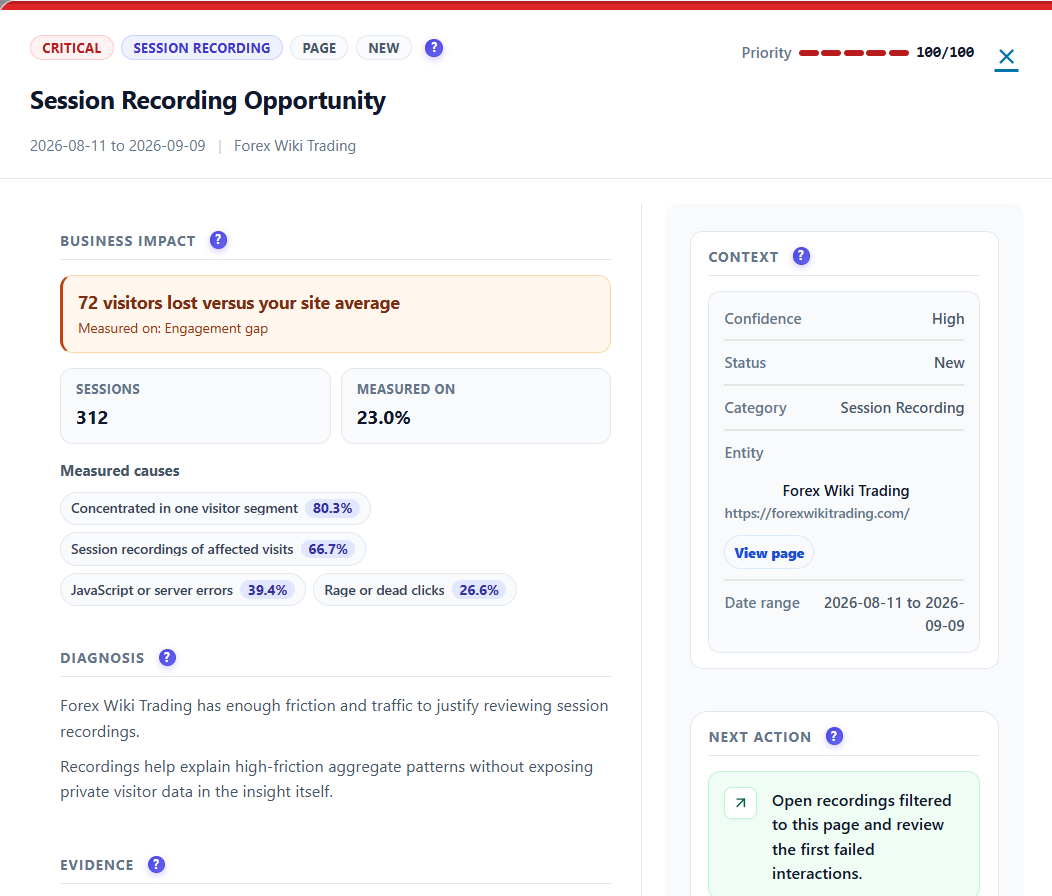
Opti-Behavior Smart Insights detail drawer for a Session Recording Opportunity with priority 100 out of 100, business impact of 72 visitors lost, measured causes with percentages, a diagnosis, context and a next action

Diagnosis FREE PRO

Open an insight and read the why, not just the what.

The detail view opens with the priority and the business impact, then lists the measured causes with their share — for example a concentration in one visitor segment, recordings of affected visits, JavaScript errors, rage or dead clicks. A plain-language diagnosis, the context and the next action complete it.

  • Priority out of 100 and confidence, side by side
  • Measured causes with percentages, not guesses
  • Diagnosis in plain language, with the entity and date range as context
  • A next action that opens the right filtered report

Fix itRead the top measured cause first: it is usually where the fix lives.

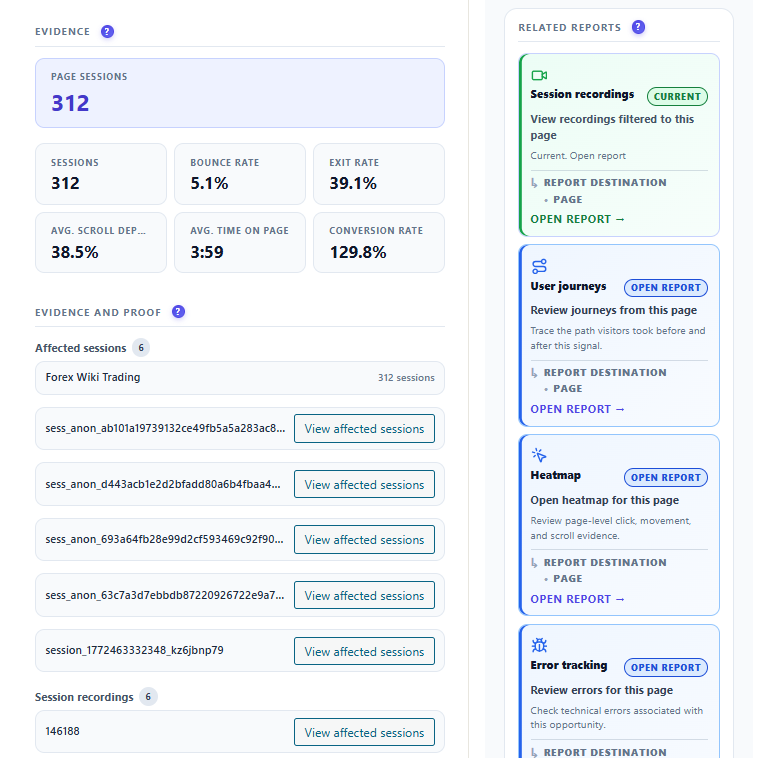
Opti-Behavior Smart Insights evidence with page sessions, bounce rate, exit rate, average scroll depth, time on page and conversion rate, affected sessions with View affected sessions buttons, and related reports for session recordings, user journeys, heatmap and error tracking

Evidence & related reports PRO

Every claim comes with proof, and a door to the right report.

Under the diagnosis, an evidence panel shows the numbers behind the insight: sessions, bounce and exit rate, average scroll depth, time on page and conversion rate. Affected sessions and recordings are listed with buttons to open them, and a Related Reports column links straight to session recordings, user journeys, the heatmap and error tracking for the same page.

  • Six evidence KPIs for the page behind the insight
  • Affected sessions and session recordings, one click away
  • Related reports: recordings, journeys, heatmap, error tracking
  • Aggregate evidence only, no private visitor data in the insight itself

Fix itWatch two affected sessions before you decide anything.

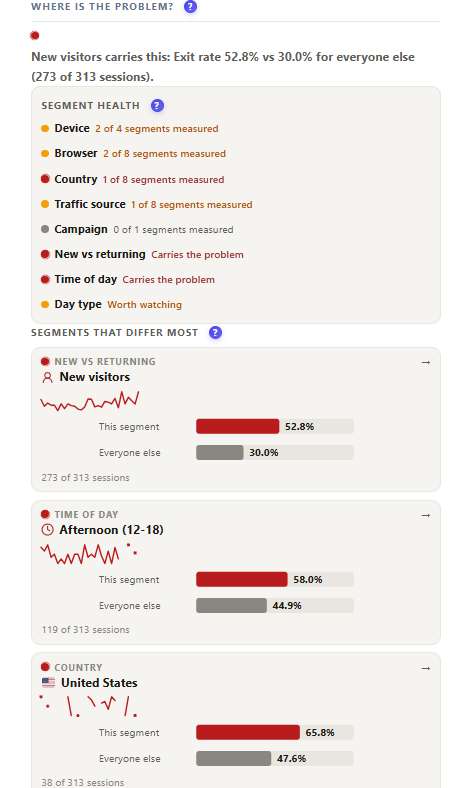
Opti-Behavior Where is the problem panel with segment health for device, browser, country, traffic source, campaign, new versus returning and time of day, and segments that differ most with bars comparing this segment with everyone else

Where is the problem? FREE PRO

Find the audience that carries the problem.

A segment health list shows which dimensions were measured — device, browser, country, traffic source, campaign, new vs returning, time of day, day type — and which ones carry the problem. Below it, the segments that differ most are compared bar to bar with everyone else. Free tells you which audience carries it; Pro breaks it down fully.

  • Segment health across eight dimensions
  • This segment vs everyone else, in the same metric
  • Session counts shown, so a thin segment is visible as thin
  • Pro: full breakdown and drill-down for each segment

Fix itNew visitors quit at 52.8% vs 30.0%? Check the landing page for first-time clarity.

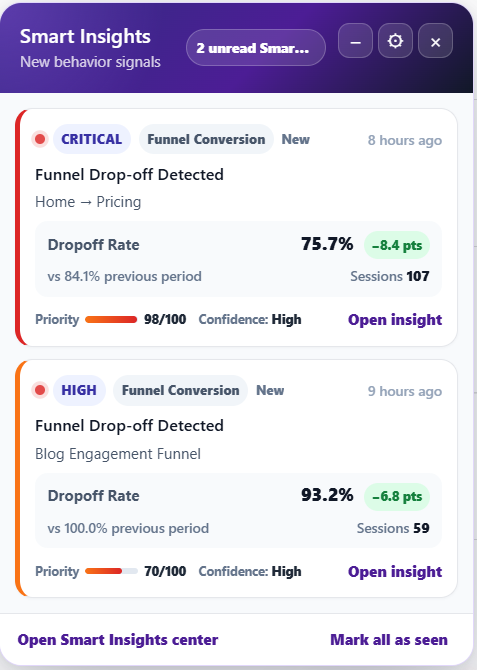
Opti-Behavior Smart Insights notification panel listing new behavior signals with a Critical Funnel Drop-off Detected card showing dropoff rate 75.7 percent, a change against the previous period, priority and confidence, and Open Smart Insights center and Mark all as seen links

Notifications FREE

New signals find you, wherever you are in WordPress.

A compact launcher in the admin surfaces unread high-priority opportunities. Open it to see each card with its severity, the metric that changed against the previous period, sessions, priority and confidence — then jump to the full Smart Insights center or mark everything as seen. Generation runs on a schedule you control.

  • Unread count on the launcher, cards with Critical or High severity
  • Change against the previous period, in points
  • Open Smart Insights center or Mark all as seen
  • Automatic generation daily by default, or hourly or twice a day, plus a manual refresh

Fix itClear the launcher once a day: unread critical cards first.

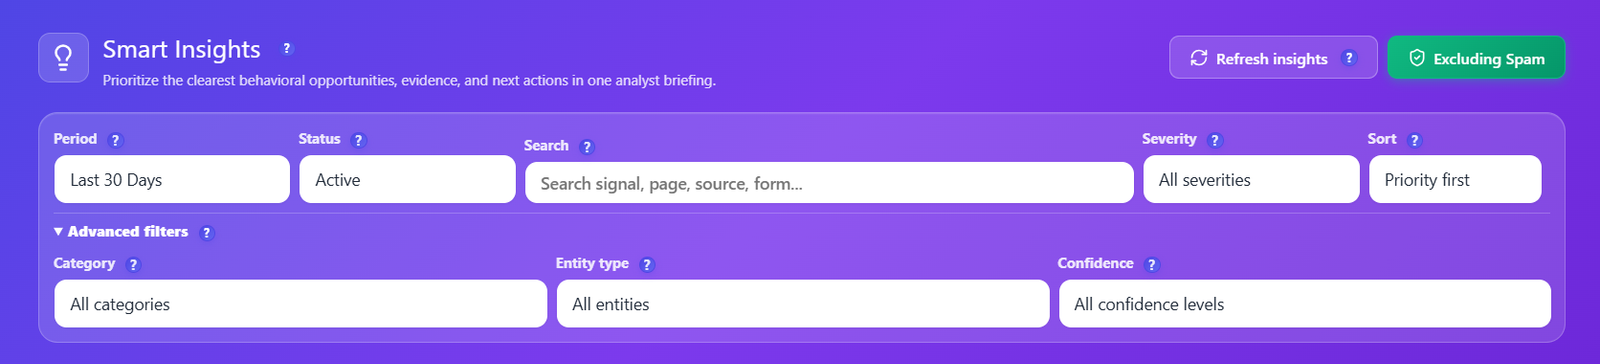
Opti-Behavior Smart Insights filter bar with period, status, search, severity and sort, and advanced filters for category, entity type and confidence, plus Refresh insights and Excluding Spam

Filters FREE

Filter down to the fixes that matter this week.

Narrow the list by period, status, keyword, severity and sort order, then open Advanced filters for category, entity type and confidence. Refresh insights runs a new pass on demand, and Excluding Spam keeps bot sessions out of every number.

  • Period, status, search, severity and sort in one bar
  • Advanced: category, entity type and confidence
  • Refresh insights on demand
  • Spam excluded from the numbers

Fix itFilter to High confidence and Critical first, and ignore the rest until they are done.

Did the fix work? PRO

Close the loop: did the fix actually work?

Mark an insight resolved and the metric that defined the problem is frozen. Once a full post-fix window exists, a daily check re-measures the same signal on the same page and records a verdict — improved, unchanged or worse. Only aggregate numbers are stored, never visitor-level data.

  • The before value is captured the moment you mark it resolved
  • The same signal is re-run on the same entity after a full window
  • A verdict on the metric that defined the problem
  • Aggregate numbers only

Fix itDo not celebrate a shipped fix until the verdict says improved.

Watch Smart Insights in action

A short tour of the Smart Insights center inside a real WordPress admin.

How It Works

1

It reads data you already collect

Install Opti-Behavior and Smart Insights starts from the behavior data on your own server. A scheduled run, daily by default, plus a manual refresh, generates the insights.

2

Signals are scored and ranked

Each signal gets a priority from 0 to 100, a confidence level and a business impact in visitors lost, so the largest leak comes first — with plain arithmetic you can check.

3

Diagnose with evidence

Open an insight for the measured causes, the segment that carries the problem, the evidence KPIs and links to the recordings, journeys, heatmap or errors behind it.

4

Act, mark it, verify it

Follow the next action, update the status as work moves on, and in Pro let the outcome check tell you whether the metric really moved.

Who Uses Smart Insights?

Store Owners

Get a ranked list of checkout, cart and product-page problems without opening ten reports.

Marketing & Growth Teams

Spot the campaign whose landing page does not match its promise, and the segment that carries the loss.

Agencies & Consultants

Start every client review from the weekly briefing, with evidence and a next step for each item.

Free core, Pro evidence

Smart Insights works on the free plugin. Pro adds more signals and richer evidence on top — here is exactly what changes.

Opti-Behavior FreeOpti-Behavior Pro
Smart Insights center, filters & status workflow✓✓
Page-level signals: bounce, exit rate, scroll depth, traffic✓ 6 signals✓
Business impact in visitors lost, largest leak first✓✓
Priority, confidence & observation labels✓✓
Notification launcher & scheduled generation✓✓
Funnel, checkout, cart & campaign signals✗✓ 26 signals
Recordings, errors, forms & journeys evidencePreview✓
Full weekly CRO briefingPreview✓
Segment breakdown & anomaly detectionWhich audience carries it✓ Full drill-down
“Did the fix work?” outcome check✗✓
PriceFree€89/yr

Smart Insights FAQ

What is Smart Insights?
A workspace inside WordPress that turns the behavior data Opti-Behavior already collects into a ranked list of problems. Each item has a category, the visitors it costs, evidence, a confidence level, a 0–100 priority and one recommended next action.
Is it AI?
No. Everything is deterministic and explainable: each number is a documented arithmetic step over stored aggregate metrics, not an estimate from a model. There are no third-party AI calls, and nothing leaves your server.
What is included for free, and what is Pro?
The free plugin includes the Smart Insights center, filters, status workflow, notifications and 6 page-level signals: bounce, mobile bounce, exit rate, low scroll depth, high traffic with low engagement and traffic spikes. Pro adds 26 more, such as funnel and checkout drop-off, form friction, error impact, dead or rage clicks, campaign mismatch and segment anomalies, plus the full weekly briefing and richer evidence.
How is the business impact calculated?
As visitors lost during the analysis window, which ranks the largest leak first. A 50% drop on 100 sessions loses 50 visitors; a 10% drop on 10,000 sessions loses 1,000. When a WooCommerce order history is readable, revenue exposure can be shown as well.
What does Observation mean?
It marks an insight with too little traffic to size the impact reliably. It is shown as something to confirm, not a loss to act on, so a small sample does not look like an emergency.
What is in the Weekly CRO Summary?
The top issues with visitors at risk and whether each got better or worse, counts of active, high-priority and recurring issues, the biggest mover, a trend watch and one recommended action. Free sites see a preview; Pro shows the full briefing.
How often are insights generated?
On a schedule you control: daily by default, or twice a day or hourly, with a processing profile for the size of your site. You can also click Refresh insights at any time.
Can I get notified?
Yes. A compact launcher in the admin lists unread high-priority opportunities, and you can open the full center or mark everything as seen. Notification behavior is set in the settings.
How do I know a fix worked?
Mark the insight resolved. The metric that defined the problem is frozen, and once a full window has passed a daily check re-measures it and records a verdict. This outcome check is part of Pro.
Is my data safe?
Insights are built from aggregate numbers stored on your own WordPress server. No visitor-level data is placed in an insight, and no external service is involved.

Get the Next Fix, Not Another Chart

Install Opti-Behavior for free and let Smart Insights rank what to fix first. Add Pro for the full weekly briefing and deeper evidence. All data stays on your server.

Explore
Drag