User Journey Analytics: See the Real Paths Visitors Take on Your WordPress Site

Lea runs an online shop that sells cooking classes. She drew the perfect path on a piece of paper: Home, then Classes, then a class page, then Checkout. Simple.
When she finally looked at how visitors really moved through her site, the paper went straight into the bin. Many people went Home, then FAQ, then Shipping, then left. Others went from a class page to the Contact page, then back, then left. Almost nobody followed her perfect path.
That picture is what user journey analytics gives you: the real routes visitors take, not the one you planned. This guide explains how to read it, what to look for, and how to turn what you see into fixes. We use Opti-Behavior Pro’s User Journeys report for the screenshots.
In one sentence: Funnels check the path you planned. User journey analytics shows the paths people actually take, including the detours that hide their questions.
Contents
Funnels vs user journeys
Both are useful. They answer different questions.
| Funnel | User journey analytics | |
|---|---|---|
| Question | How many follow my planned steps? | Which paths do people really take? |
| You define | The steps | Nothing, the paths come from the data |
| Best for | Measuring a known process (checkout, sign-up) | Discovering unexpected routes and detours |
| Shows | Drop-off between your steps | Every route, loops and exits |
A good habit: use journeys to discover the real path, then turn it into a funnel to measure it every week.
The four views of user journeys
In Opti-Behavior Pro, User Journeys has four tabs:
| Tab | Question it answers |
|---|---|
| Journey Flow | What are the main routes, step by step? |
| Top Paths | Which exact sequences are most common? |
| Entry & Exit | Where do visitors land, and where do they leave? |
| Page Groups | How do sections (products, blog, cart) connect? |
Cards at the top show total sessions, average path length, completion rate and the step with the most drop-off.
Journey Flow: the big picture
The Journey Flow is a diagram where each column is a step and each band is a group of visitors moving from one page to the next. The thicker the band, the more people take that route. This kind of chart is often called a Sankey diagram.
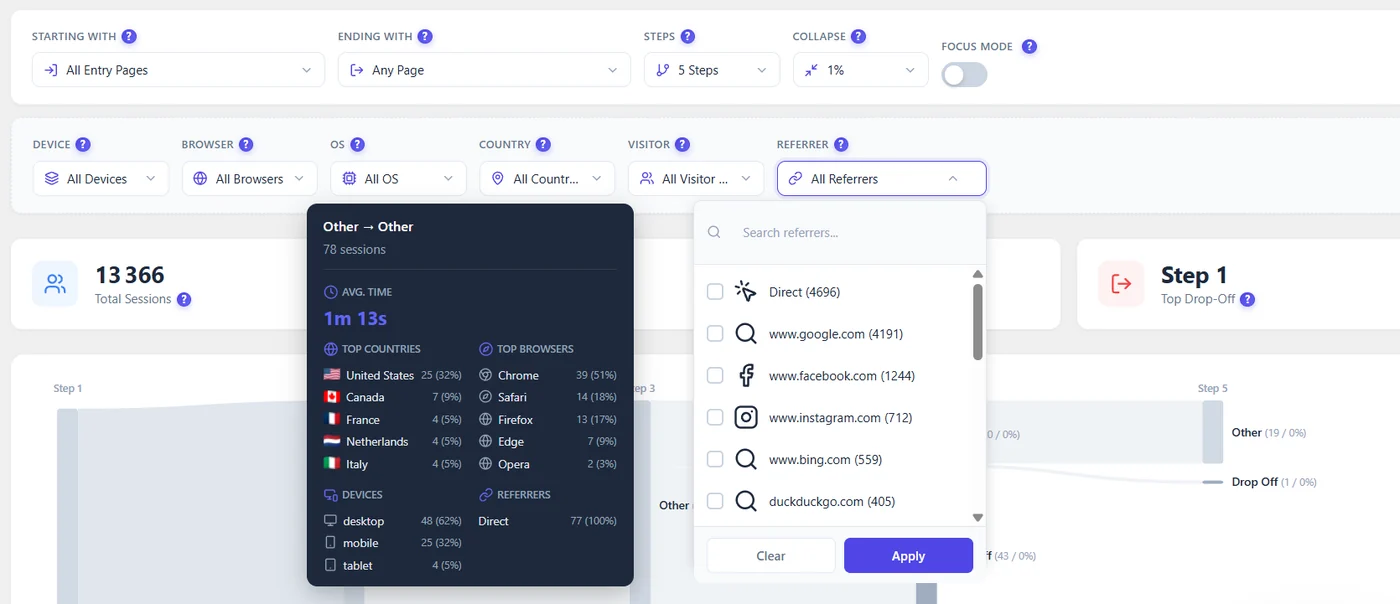
You can choose where the flow starts (all entry pages or one page), where it ends (any page or a goal page), how many steps deep to go (5 by default), and hide small branches. Focus mode highlights one route.
Lea started the flow from her home page. The thickest band went to FAQ, not to Classes. That was her first surprise.
Top Paths: the exact routes
Top Paths lists the exact sequences of pages, with the number of sessions and their share.
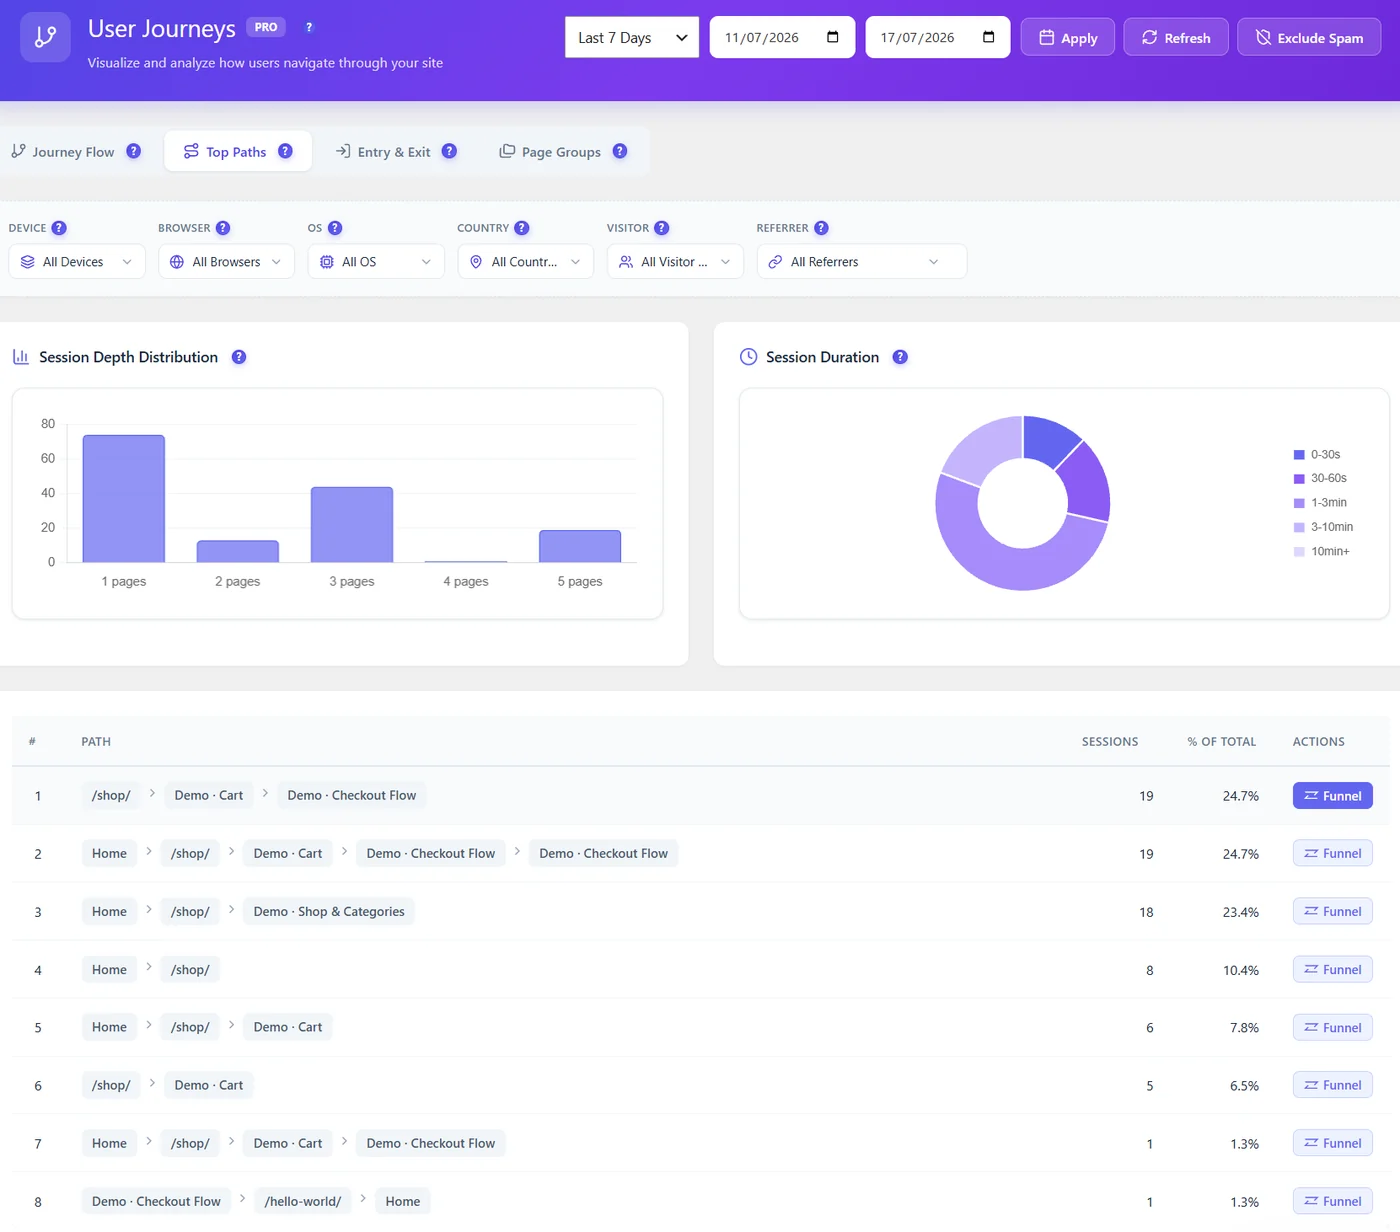
Here is an example from a shop, taken from our docs:
| # | Path | Share | What it tells you |
|---|---|---|---|
| 1 | Shop > Cart > Checkout | 25% | Direct buyers: keep this route short |
| 2 | Home > Shop > Cart > Checkout > Checkout | 25% | Checkout loads twice: an error or a payment retry |
| 3 | Home > Shop > Shop Categories | 23% | Browsing without adding to cart: product pages need work |
Look for three things:
- A path that reaches your goal. Make it easier: fewer steps, clearer buttons.
- A popular path that ends nowhere. Add a clear next step on its last page.
- Loops, where the same page appears twice. Visitors are lost, or something failed.
Every path has a Funnel button. One click creates a funnel with one step per page, already filled with past visits.
Entry & Exit: the doors of your site
Entry pages are where visits start. Exit pages are where they end.
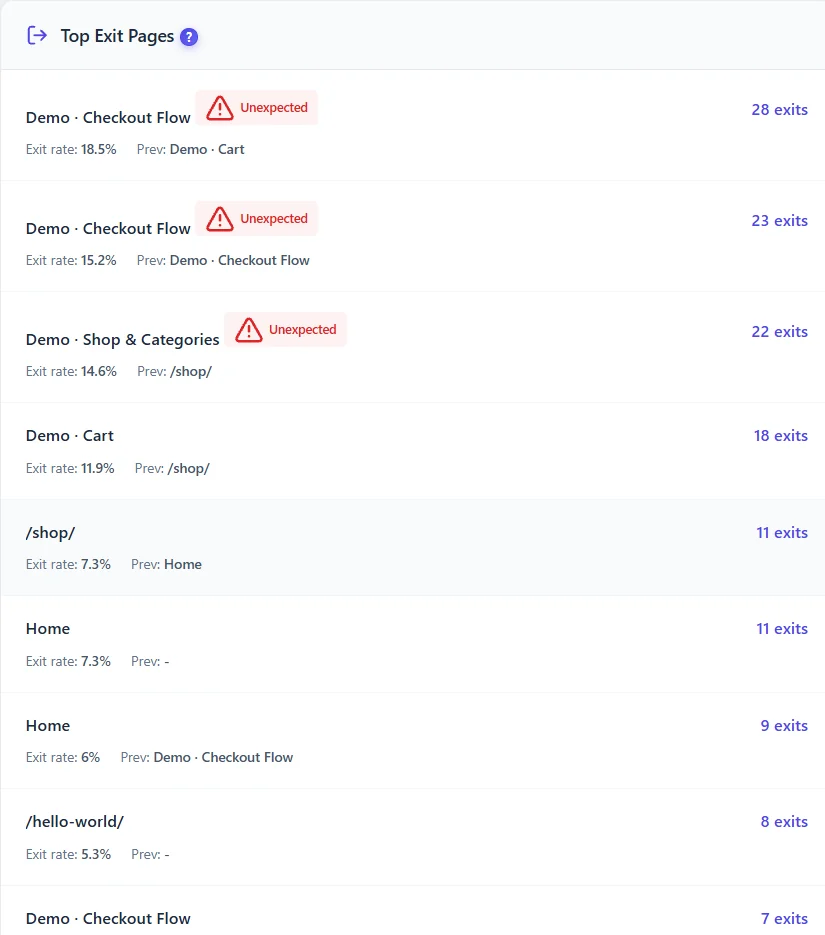
| List | Columns | What to do |
|---|---|---|
| Top entry pages | Sessions, bounce, next page, average pages | Improve the pages that start most visits |
| Top exit pages | Exits, exit rate, previous page, Unexpected flag | Fix exits on pages that should lead somewhere |
An exit is flagged Unexpected when it happens on a page that should not end a visit, like a cart, a checkout step or a category page. Exits from a thank-you page are good news. Exits from a cart are lost money.
If the "next page" of a top entry page is often the menu or the search, the page lacks a clear next step.
Page Groups: make big sites readable
On a site with hundreds of pages, the diagram becomes spaghetti. Page groups merge similar pages into one box, for example all product pages as "Products".
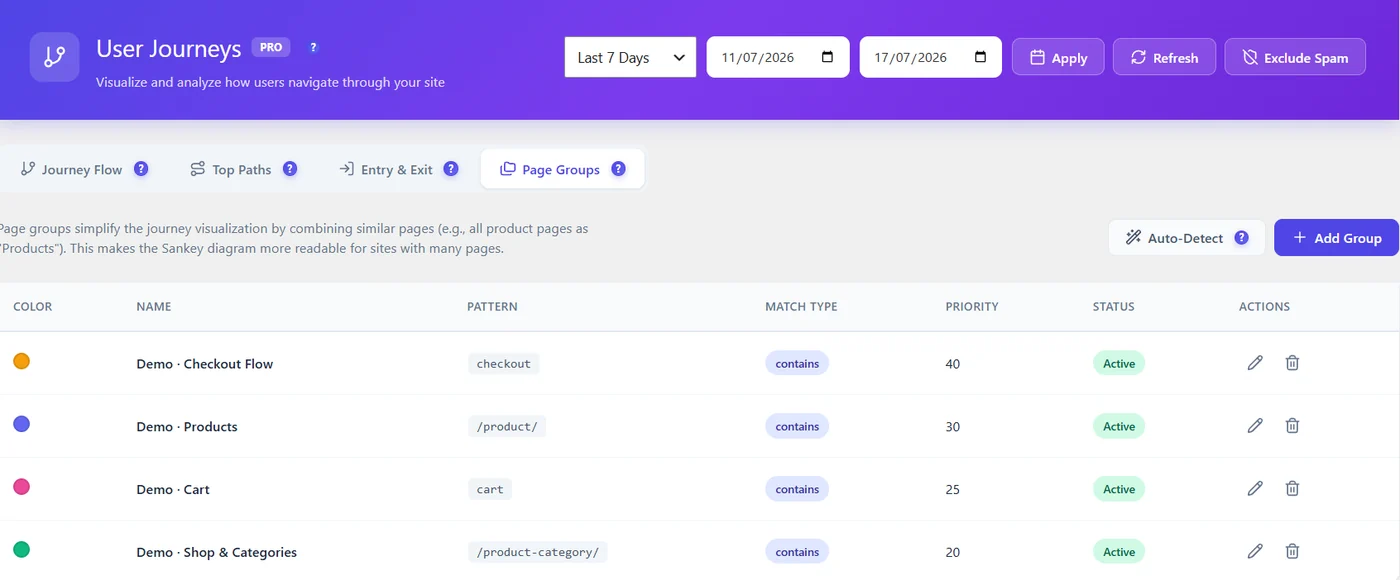
Suggested groups:
| Site | Groups |
|---|---|
| Shop | Products (/product/), Categories (/product-category/), Cart, Checkout |
| Blog | Articles (/blog/), Categories (/category/), Newsletter |
| Services | Services, Case studies, Contact |
Keep 5 to 10 groups, and give narrow groups (Checkout) a higher priority than broad ones (Shop). Groups only change how pages are shown, not your data.
Filters: whose journey?
A journey means more when you know who took it. Quick filters let you pick device, browser, OS, country, visitor type and referrer. The filter panel adds duration, number of pages, entry and exit page, channel and UTM campaign.
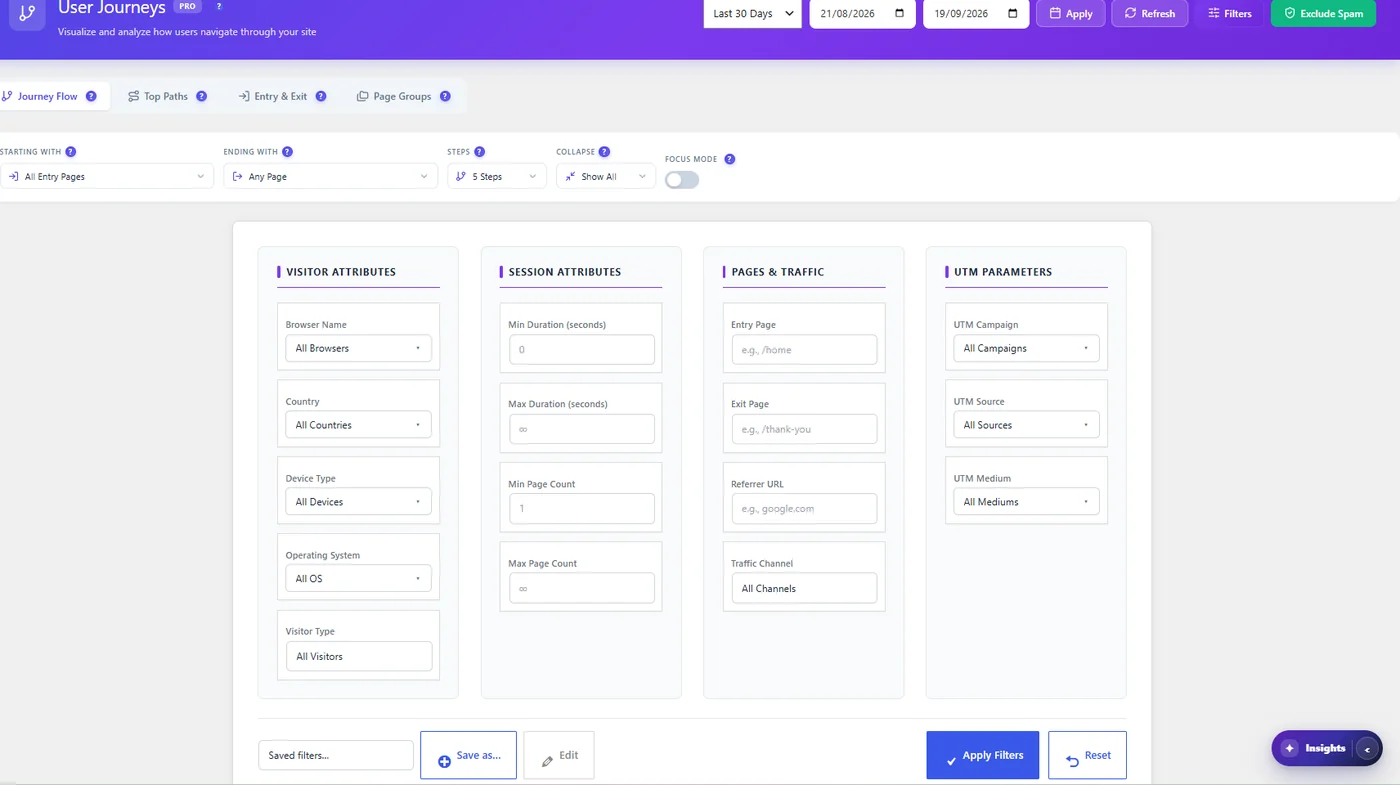
Useful comparisons:
- Google vs Facebook visitors: which group reaches the goal?
- Mobile vs desktop: are phone users stuck at a step?
- New vs returning: do new visitors wander more?
- One campaign: where do campaign visitors go after the landing page?
Depth and duration: explorers or tourists?
Two small charts in Top Paths show how many pages visits see and how long they last.
| You see | Likely meaning | What to do |
|---|---|---|
| Most visits at 1 page, under 30 s | Visitors do not find what they came for | Check top entry pages and their sources |
| Many 1-page visits of 1 to 3 min | People read and leave happy (blog) | Add a next step: related post, newsletter |
| A peak at 3 pages | A common route exists | Open Top Paths and make it shorter |
| Long visits, many pages, no conversion | People search or compare | Improve navigation, watch recordings |
What Lea found, and what she changed
Three journeys told Lea everything:
- Home > FAQ > Shipping > exit. People wanted to know if the cooking kit was shipped, and how fast. The class pages did not say. She added one line under each price: "Ingredient box shipped in 2 days, free over 50 euros."
- Class page > Contact > Class page > exit. People had a question about the date. She added a small "Next dates" list on each class page.
- Checkout > Checkout > exit. Checkout loading twice pointed to a payment retry. The error log showed a payment script failing on Safari. Her developer fixed it.
A month later, the "FAQ > Shipping" route had shrunk by more than half, and more visitors went from class pages to checkout. She turned the new main path into a funnel to track it every week.
A 15-minute monthly routine
- Journey Flow from the home page: is the thickest band going where you want?
- Top Paths: find one path that ends nowhere, and one loop.
- Entry & Exit: list the Unexpected exits.
- One filter: mobile only. Anything different?
- One action: add a missing answer or a clear next step on one page.
User Journeys is part of Opti-Behavior Pro. The funnels it creates are normal funnels, which are unlimited in the free version. For funnels, see our guide to the WordPress conversion funnel plugin.
See the paths your visitors really take
Opti-Behavior Pro adds User Journeys with Sankey flows, top paths, unexpected exits and page groups. Start with the free plugin, then try Pro free for 6 months.
User journey analytics FAQ
What is user journey analytics?
It shows the sequences of pages visitors really take on your website: where they enter, where they go next, where they loop and where they leave.
What is the difference between a funnel and a user journey?
A funnel measures how many people follow steps you defined. User journey analytics discovers the paths people take without you defining them.
What is a Sankey diagram in analytics?
It is a flow chart where bands connect pages, and the thickness of each band shows how many visitors moved from one page to the next.
Can I turn a user journey into a funnel?
Yes. In Opti-Behavior Pro, each path in Top Paths has a Funnel button that creates a funnel with one step per page, filled with past visits.
Why are journeys cut after one page in Anonymous Mode?
Anonymous Mode follows one session at a time and does not link visits across days. Full Tracking, with consent, can link sessions of the same visitor.