Does a WordPress Analytics Plugin Slow Down Your Site? We Measured Opti-Behavior With PageSpeed Insights

We got a perfect 100/100 speed score with heatmaps, session recording, and 9 tracking scripts turned on. Here is the real proof.
Every tracking plugin says it is “light” and “fast.” But most of them never show you a real test. They just say “trust us.”
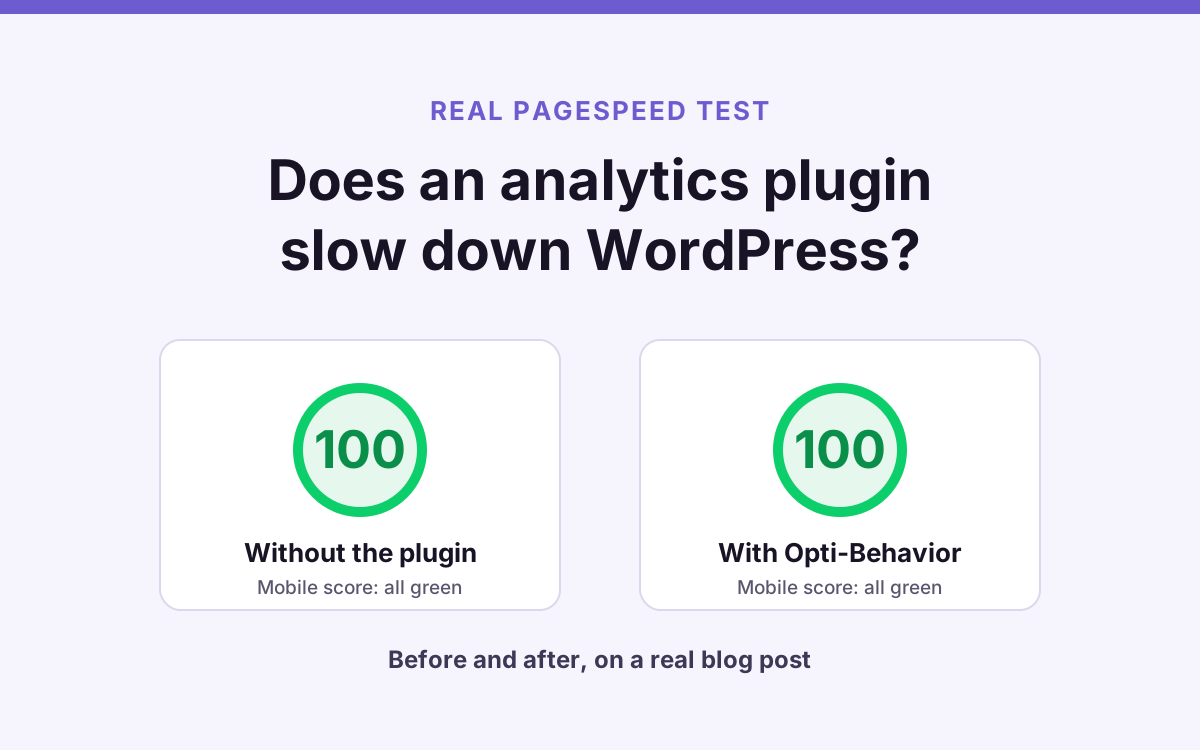
So we did something simple. We took one real page. We tested it two times. First with Opti-Behavior turned ON. Then with it turned OFF. We used the same server and the same cache plugin (WP Rocket) both times. We ran the test 3 times for each state, so it was not just luck.
The result? The score did not change. All the reports are linked in this article. You do not have to believe us — you can click and check for yourself.
Contents
- The short answer
- Why you should not just trust the word “lightweight”
- How we ran this test
- Every test result, with links
- About those small yellow warnings
- What changes when the plugin is on
- 5 things we do to keep tracking out of the way
- The one honest cost we found
- Try this test on your own website
- Questions people ask
- The bottom line
See it running on a live site
A real WordPress dashboard with real traffic. No signup, no credit card, no email.
Open the live demo →The short answer
We tested a real blog post. It had 1,053 words and 5 pictures. People could also leave comments on it. Opti-Behavior loaded 9 small scripts on this page: a heatmap tracker, a session recorder, an error tracker, a form tracker, a funnel tracker, an A/B test tracker, and 3 small helper files.
We used a real tool called PageSpeed Insights. Google made this tool. It checks how fast a page feels to a visitor, and it gives a score from 0 to 100. Here is a real screenshot from one of our tests, with Opti-Behavior turned ON:
Before and after: the same page, the same test
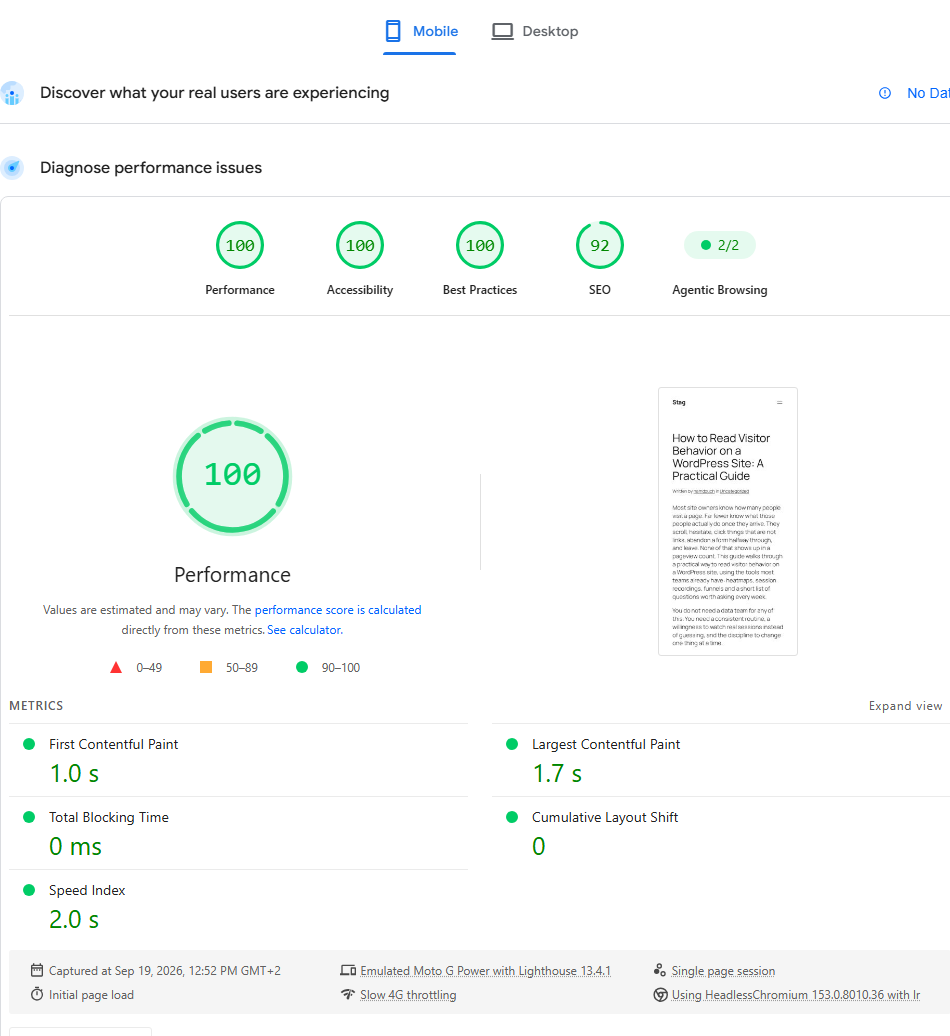
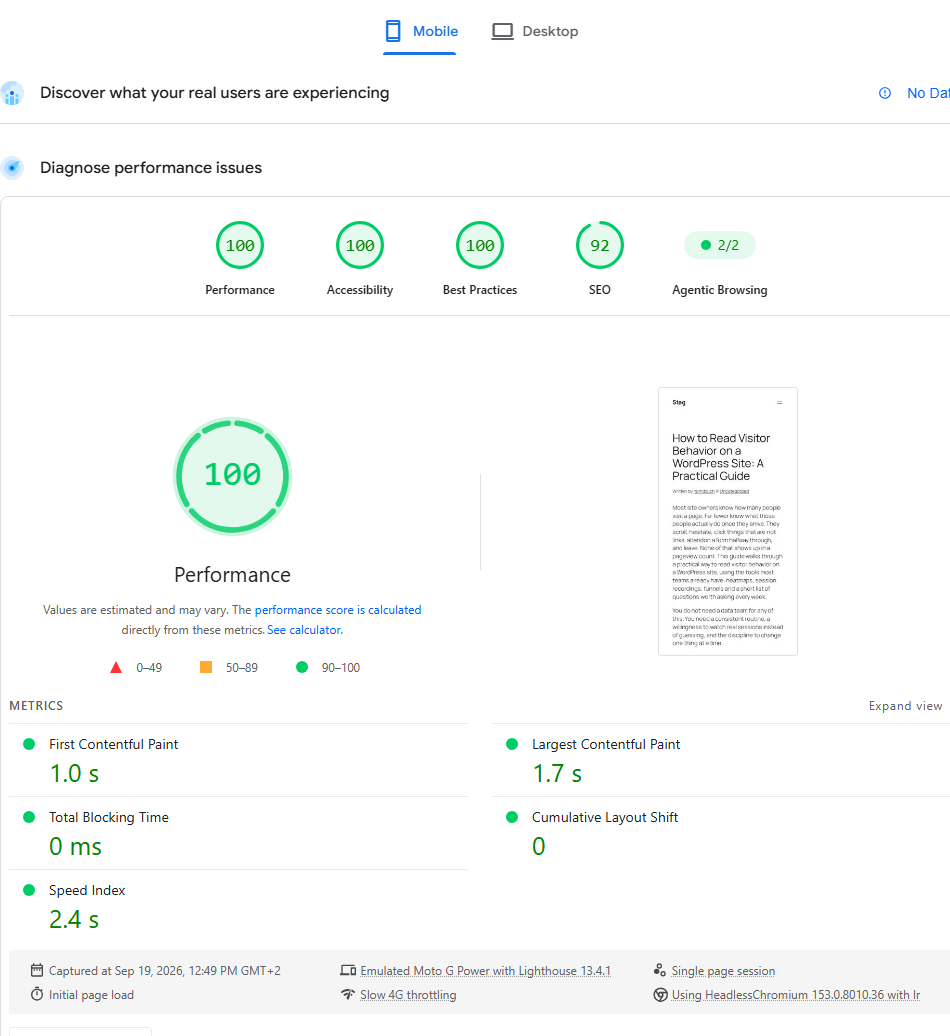
We then ran the exact same test again, on the exact same page, with Opti-Behavior fully turned OFF. It scored the same: 100. Open that report too → — compare it side by side with the screenshot above.
| What we measured (middle result of 3 tests) | Tracking ON | Tracking OFF |
|---|---|---|
| Speed score on a phone | 100 | 100 |
| Speed score on a computer | 100 | 100 |
| Time to first paint (how fast something shows up) | 1.0 s | 1.0 s |
| Time to the biggest thing on screen | 1.7 s | 1.7 s |
| Time the page freezes and ignores taps | 0 ms | 0 ms |
| Page jumping around while it loads | 0 | very tiny (0.001) |
| Total size of the page | 233 KB | 156 KB |
| Tracking scripts sent to your phone | 9 (all set to load late) | 0 |
Only one number really moved: the size of the page. It grew by 77 KB. That is the true, honest cost of running 9 tracking scripts. Everything else stayed the same.
Why you should not just trust the word “lightweight”
Lots of plugins say they are “light” or “does not slow you down.” Almost none of them show you a real before-and-after test. There is a reason for that.
One quick test on a fast page can still get a good score, even if the plugin is doing something slow. That is because the test looks at the WHOLE page, not just the plugin. A bad script can hide behind a fast page.
The only fair way to check is the slow, boring way: test the same page twice, with the plugin on and with it off, more than once, and compare the middle results. That is exactly what we did here.
How we ran this test
- The page: a real blog post with 1,053 words, 5 pictures, and a comment box — not a tiny empty test page.
- The server: a real WordPress website using WP Rocket (a caching plugin many sites use to load faster). We cleared the cache before every single test, so no test used old, saved data.
- The tool: Google PageSpeed Insights. We tested as a normal visitor, not logged in to WordPress. This matters: a logged-in visit skips the cache and skips some tracking scripts.
- How many tests: 3 tests on phone, 3 tests on computer, for each state (ON and OFF). That is 12 tests in total, and every report is linked in this article.
- How we checked it was fair: before each set of tests, we looked at the real page code. With tracking ON, we saw exactly 9 scripts, all set to load late. With tracking OFF, we saw 0.
Every test result, with links
Here are the phone scores, in the order we ran them:
| Test number | Tracking ON | Tracking OFF |
|---|---|---|
| 1 | 100 | 100 |
| 2 | 100 | 100 |
| 3 | 100 | 99 |
Click any link below to see the real, full report. Nothing is hidden or changed:
- Tracking turned ON: test 1, test 2, test 3 (this is the one in the screenshot above)
- Tracking turned OFF: test 1, test 2, test 3
Want to see the computer version of any report? Just change mobile to desktop at the end of the link.
About those small yellow warnings
If you open the real reports above, you will see a few small yellow boxes. These are not big problems. Google calls them “opportunities” — tiny ways a page could be even better. Let’s explain the ones that mention our files.
“Use efficient cache lifetimes” (about 9 KB). This one says our script files could be saved for longer in your browser, so a second visit loads a little faster. We checked this closely before writing about it. We looked at the actual server settings for these files. Every script on the whole website — ours, WordPress’s own jQuery file, even the cache plugin’s own file — is set to be saved for exactly 7 days. Not just Opti-Behavior’s files. All of them.
That number (7 days) comes from the web hosting company’s server settings, not from Opti-Behavior. A plugin cannot change how long a static file is cached — that is a job for the server or the cache plugin. So this small warning is not a bug in Opti-Behavior. It also does not slow down anyone’s first visit. It only affects how long a saved copy lasts for a returning visitor.
What changes when the plugin is on
Page size is the one number that really moves, so let’s look at where those extra KB come from. The biggest part is the session-recording tool. And it used to be much bigger than it is now.
The tool we use to record sessions is called rrweb. It is a free, open-source library. It used to come in one big file that could BOTH record a visit AND play it back later. But a visitor’s browser only ever needs to record — the “play it back” part only runs later, inside your WordPress dashboard, for you. So we split it into two pieces and only send visitors the recording piece.
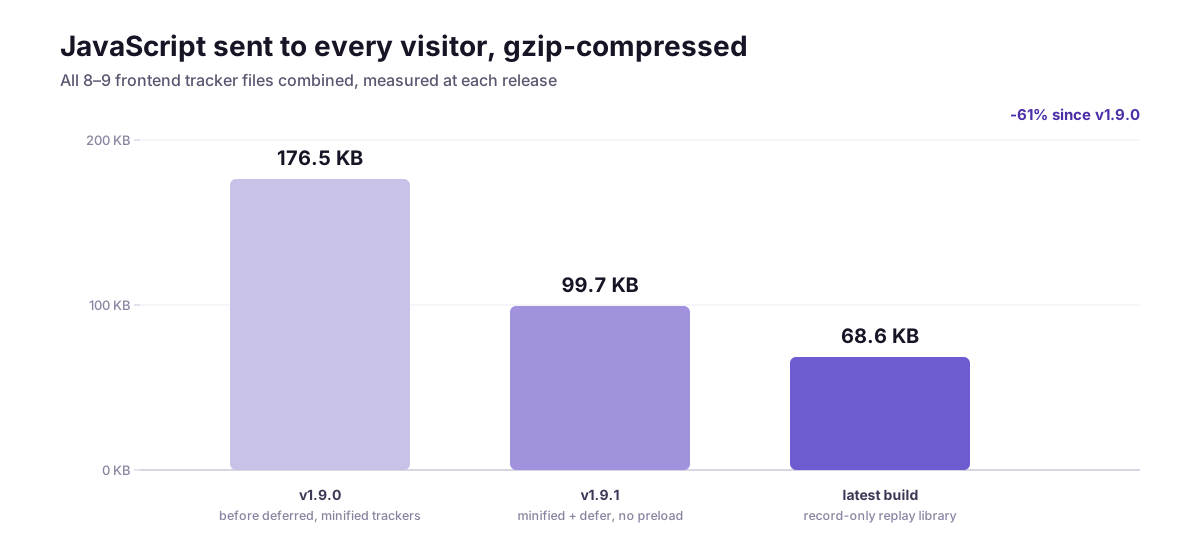
All of the tracking scripts together went from 176.5 KB down to 68.6 KB. That is 61% smaller, with nothing removed and nothing turned off.
5 things we do to keep tracking out of the way
A perfect score does not happen by luck. Here is exactly what we do.
1. Every script waits its turn
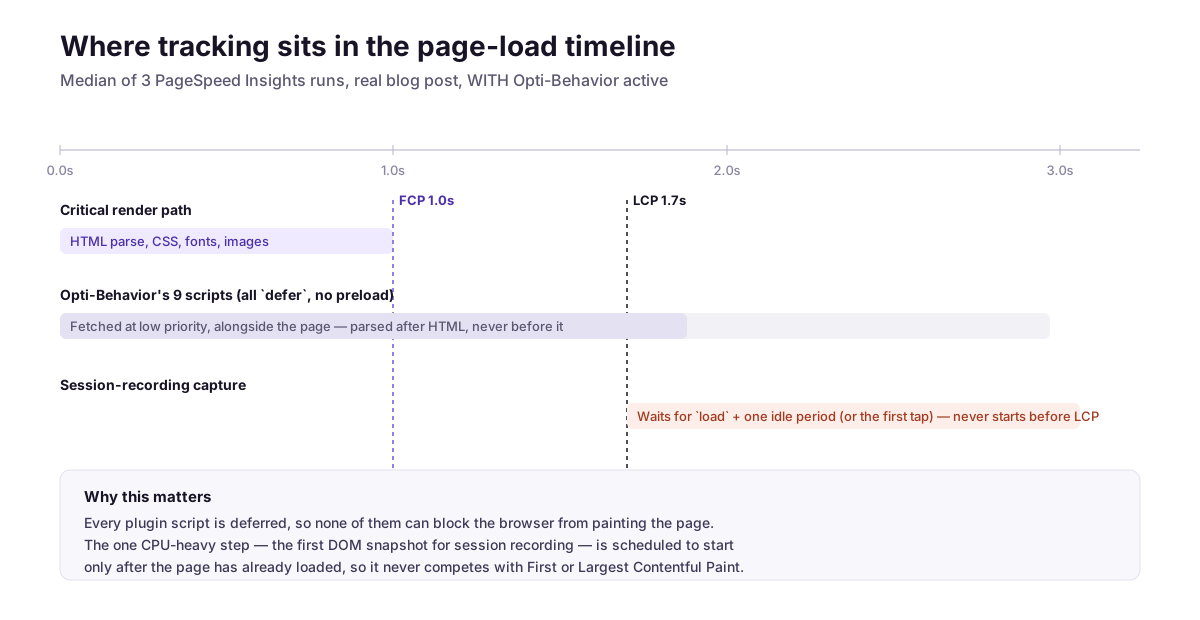
All 9 tracking scripts are marked “load me later” (the technical word is defer). This tells the browser: finish showing the page first, then load me. We also removed an old setting that told the browser “grab this file right now, before anything else.” That old setting was actually slowing things down, because it made the browser rush to fetch our files instead of your images and text.
2. We only send the code your visitor needs
As we said above, the session-recording tool used to include the “replay” code too, even though a visitor’s browser never plays anything back. Splitting it in two means visitors now download 68 KB instead of 165 KB for this one file. Nothing about the recording itself changed.
3. We wait to start recording until the page is ready
Taking the very first “snapshot” of a page for a recording is real work for the browser. It has to look at the whole page at once. If it does this the moment the page starts loading, it can slow down that very first moment — right when the visitor is waiting for the page to appear.
So we wait. The recorder waits until the page has fully loaded AND the browser has a free moment — or until the visitor taps or types something, whichever comes first. Nothing about WHAT gets recorded changes. We just moved WHEN the one heavy step happens, to a moment when the browser is not busy.
4. We shrink the data before sending it, and never make anyone wait
Recorded events are collected in the browser, then squeezed smaller (compressed) right there, using a tool built into modern browsers. This does not use up your visitor’s CPU the way an old-style JavaScript compressor would. When it is time to send the data, we use a special browser feature made exactly for this job — it sends the data in the background, even if the visitor closes the tab right away. Nobody has to wait for anything to finish sending.
5. We work WITH your cache plugin, not against it
Cache and speed plugins — like WP Rocket, LiteSpeed Cache, and others — often rewrite or reorder scripts to make pages load faster. If they are not told about our tracking scripts, they can accidentally break the order our scripts need to run in. So Opti-Behavior tells each of these plugins exactly which of its own files to leave alone. This is why our whole test ran WITH WP Rocket turned on. We wanted the real, everyday situation, not an easy one.
The one honest cost we found
We would rather tell you the one real cost than pretend there is none. On the page we tested, starting the session recorder used a tiny bit of the phone’s processor: about 159 thousandths of a second (159 ms) in total, and 57 ms of that was just running the code. On this page, that was small enough that Google’s tool did not even count it as a “slow task.” And it happened after the page had already shown its first content, not before.
On a much heavier page — our own product page, which has a YouTube video and 158 pictures — that same starting step did count as one slow task: 83 ms. For comparison, the YouTube video alone caused 698 ms of slow tasks on that same page — more than 8 times as much. Neither number is zero. Both are real, and both are linked here so you can see them yourself: with tracking and without it.
Try this test on your own website
You do not have to trust us. You can run this exact same test yourself, in about 10 minutes:
- Pick a normal page on your site. Not your fastest page and not your slowest one.
- Go to PageSpeed Insights and test that page 3 times. Write down the phone score each time.
- Turn off Opti-Behavior (and any other analytics plugin, if you want a clean test). Clear your cache.
- Test the same page 3 more times.
- Compare the middle score from each set, not just one lucky test.
- Turn the plugin back on and clear your cache again — do not forget this step!
Questions people ask
Do heatmaps and session recording slow down my website?
In our test, no. The speed score was the same with tracking on and with tracking fully off, across 3 tests each. The page did get a little bigger (77 KB), but nothing that changed how fast it felt to load.
Will this hurt my Core Web Vitals? (Google’s speed scores)
In our test, the two most important timing scores were exactly the same with and without the plugin, and page-jumping was almost zero in both cases. Every script loads late, so none of them can block the page from showing up. The one bit of real work — the first recording snapshot — only happens after the page has already loaded.
If the score stays the same, why does the page get bigger?
Because the speed score measures what a visitor FEELS — how fast something appears, how fast they can tap something, whether the page jumps around. 77 KB, sent late and quietly, does not slow any of that down. It is still a real cost in file size, so we tell you about it instead of hiding it.
Does session recording stop the page from loading?
No. The script itself loads late, and then it waits even longer — until the page has fully loaded and the browser is free, or until the visitor taps or types something. The plugin still logs that someone visited the page right away, so short visits are never missed. Only the heavy recording step waits.
Is this test like my website?
It is like a normal blog page: some text and a few pictures. We also tested a much heavier page with a video and 158 pictures, and we linked those reports too, because a fair test should also show the harder case, not just the easy one.
Does this work with WP Rocket or LiteSpeed Cache?
Yes. Our whole test ran with WP Rocket turned on, and we cleared its cache before every single test. Opti-Behavior also works safely with LiteSpeed Cache, Autoptimize, SG Optimizer, and other popular speed plugins.
Where can I see the real numbers myself?
Every single report we used in this article is linked above, exactly as Google’s tool made it. Nothing was edited. You can open any of them, or run the same page again right now.
The bottom line
Recording sessions and building heatmaps is real work. It has to catch events, shrink them, and send them — all without the visitor noticing. The real question is not whether that work happens. It does. The question is WHEN it happens. On the page we tested, it happened at moments when the browser was not busy anyway: same score, same speed numbers, and a script file that is 61% smaller than it used to be. Every report is linked above, so you never have to just take our word for it.
Start Tracking Every Visitor — No Cookies, No Consent Banner Required
Install Opti-Behavior free and get complete WordPress analytics that respects your visitors and complies with GDPR — out of the box, in under 5 minutes.
See it running on a live site
A real WordPress dashboard with real traffic. No signup, no credit card, no email.
Open the live demo →