
Conversion analysis means finding the step where visitors stop moving toward your goal, then the reason they stop there. If your stats say 300 visits and 0 sales, the site average will not help: list your pages by the visitors they lose, open the worst one, and cross-check its funnel, clicks, forms and errors until one cause explains the drop.
Below: the method by hand with any tool, the same analysis done by Smart Insights in WordPress, a real reading from our own site, and what to check one week after the fix.
Contents
What conversion analysis measures
The conversion rate is the share of visits that complete your goal: conversions ÷ visits × 100. 300 visits and 3 orders give 1 %. 300 visits and 0 orders give 0 %, and the rate cannot tell you where the visitors went.
That is why a conversion analysis follows the small steps before the goal (micro conversions): reaching the product page, adding to cart, reaching the checkout, starting a form. The goal itself (an order, a sent contact form) is the macro conversion. You look for the step where the count falls, then for the reason on that page.
| Question | Data that answers it |
|---|---|
| Which step loses the most visitors? | A funnel: visits at each step, and the drop between two steps |
| Do visitors see and click the main button? | Click heatmap, scroll depth |
| Does a form stop them? | Form analytics: the field where people quit |
| Is something broken? | JavaScript errors, failed payments, broken links |
| Are these the right visitors? | Traffic source of the visits that leave |
Our own reading: 14 carts, 5 checkouts, 0 orders
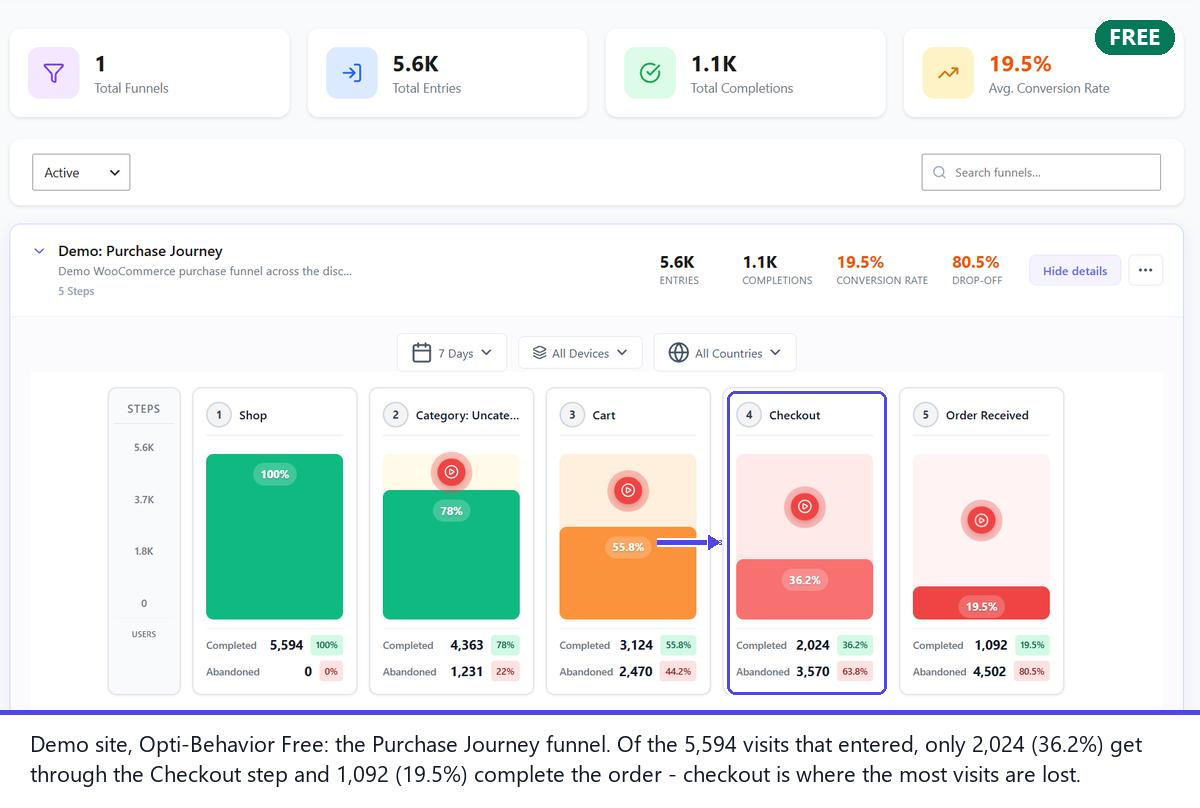
On optiuser.com, Smart Insights read our purchase path over the 30 days to 8 October 2026: 14 carts, 5 checkouts, 0 orders. Our traffic report only said that visits were up. The funnel said where the path stopped: 9 of the 14 carts never reached the checkout, and none of the 5 checkouts ended in an order.
These are small numbers. 14 carts is not a statistic, and we do not read a rate from it. What it gives is an order of work: look at the cart page first, then the checkout, before touching the home page or the blog. We will publish the follow-up reading of the same funnel.
Website conversion analysis by hand, in 6 steps
You can do this with any analytics tool that counts page visits. Allow about an hour for one funnel.
- Write the goal of each key page. One action per page: “add to cart” on a product page, “send” on a contact page, “place order” on the checkout.
- List the steps of the path. For a shop: product page → cart → checkout → order received. For a lead site: landing page → contact form → thank-you page.
- Count the visits at each step over the same period, then compute the drop between two steps. Look at the number of visitors lost, not only the percentage: 60 % of 20 visits matters less than 30 % of 800.
- Open the page of the leaking step and check, in this order: can visitors see the main button (click map, scroll depth)? Does a form field stop them? Is something broken (open the browser console, place a test order)? Do the visitors who leave come from one source?
- Write one hypothesis per cause, with the figure behind it: “the shipping cost appears only at checkout; 9 of 14 carts stop before it”.
- Rank the causes by visitors lost and fix the first. One change at a time, so you can measure it.
The method works. Its cost is the cross-checking: four reports for one page, and the same again for the next page.
Common causes a conversion analysis finds, and how to confirm each
Most drops between two steps come from a short list of causes. Each one leaves a trace you can check before you change anything.
The main button is not seen
Sign: the page gets visits but few clicks on its goal. Confirm: on a click heatmap, look for clicks on images, headings or the menu instead of the button; in the scroll data, check how many visitors reach the button. If most visitors stop above it, move the button up or repeat it, then measure the same step again.
A cost or a condition appears too late
Sign: visitors reach the cart or the form, then stop. Confirm: place a test order or fill the form yourself on a phone and write down every surprise: a shipping cost shown only at checkout, a forced account, a minimum order, a delivery date you only see at the end. If one of these sits exactly at the step that leaks, show it earlier.
A form asks too much
Sign: many forms started, few sent. Confirm: find the field where people quit. A phone number, a company size or a long message box are the usual suspects. Make the field optional or remove it, and keep the rest of the form unchanged so you can read the effect.
Something is broken for some visitors
Sign: one browser, one device or one payment method converts much worse than the others. Confirm: open the browser console on the page, test it on a phone, and try each payment method. A JavaScript error on the checkout or a gateway that refuses cards stops the order whatever the design.
The visitors are not the right ones
Sign: the drop comes mostly from one traffic source. Confirm: split the leaking step by source. If visitors from one campaign or one search phrase leave at once, the page may be fine and the promise that brought them is wrong: fix the ad, the title or the search snippet, not the page.
Write the cause you confirm next to the step it explains. When two causes touch the same step, fix the one that costs the most visitors first.
The same analysis with Smart Insights
Smart Insights does the cross-checking for you, inside WordPress, from the data your modules already collect. The chain is always the same: your modules collect, Smart Insights compares them, and you get a list of problems with the fix for each one.
1. The modules collect
In the free plugin: traffic, click heatmaps, funnels (on a WooCommerce site the plugin proposes the purchase funnel built from your own pages) and, on WooCommerce, the Shop screen with product views, adds to cart, checkouts and paid orders for the shop, and the visits each product loses. In Pro: session recordings, scroll heatmaps, JavaScript errors, form analytics, user journeys and payment errors.
2. Smart Insights writes one card per problem
Each card says what is wrong, on which page or funnel step, how many visitors it costs, how sure it is (from the visits measured) and the next action. Cards are ranked by visitors lost, so the first card is your first fix. The free plugin raises cards on page behaviour, such as a high exit rate, a low scroll depth or high traffic with low engagement. Pro adds cards built from funnels, forms, errors and rage or dead clicks.
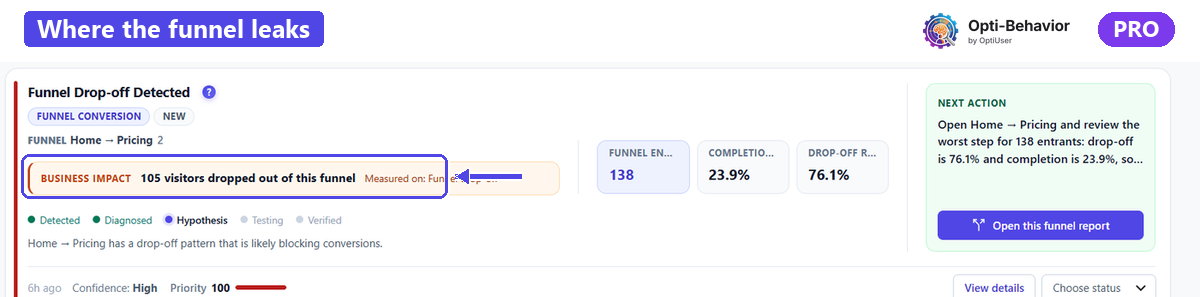
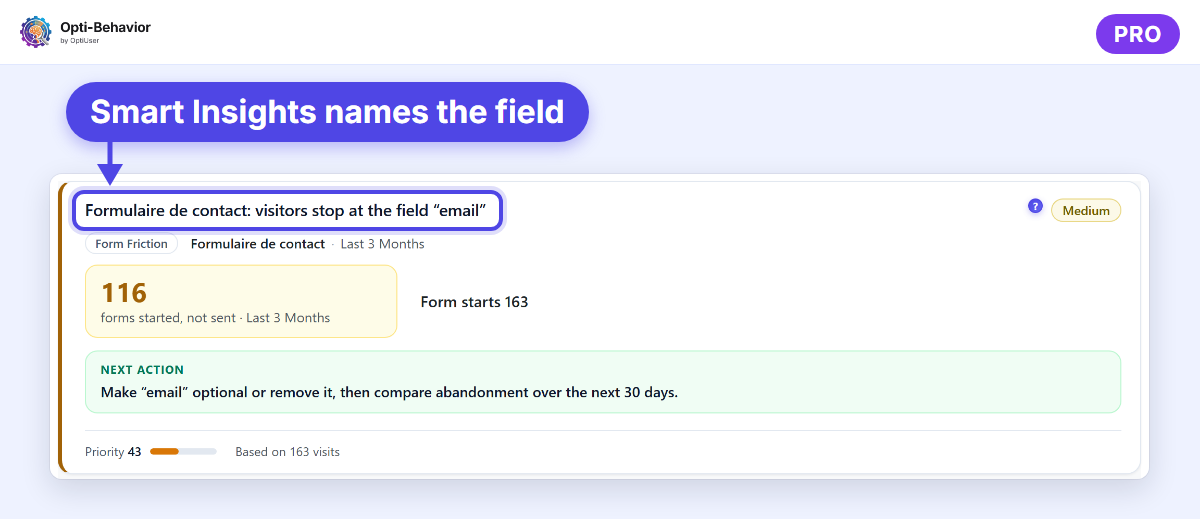
On a form, the card goes down to the field. On our test site, 116 of the 163 contact forms started were never sent, and the card named the field people quit on.
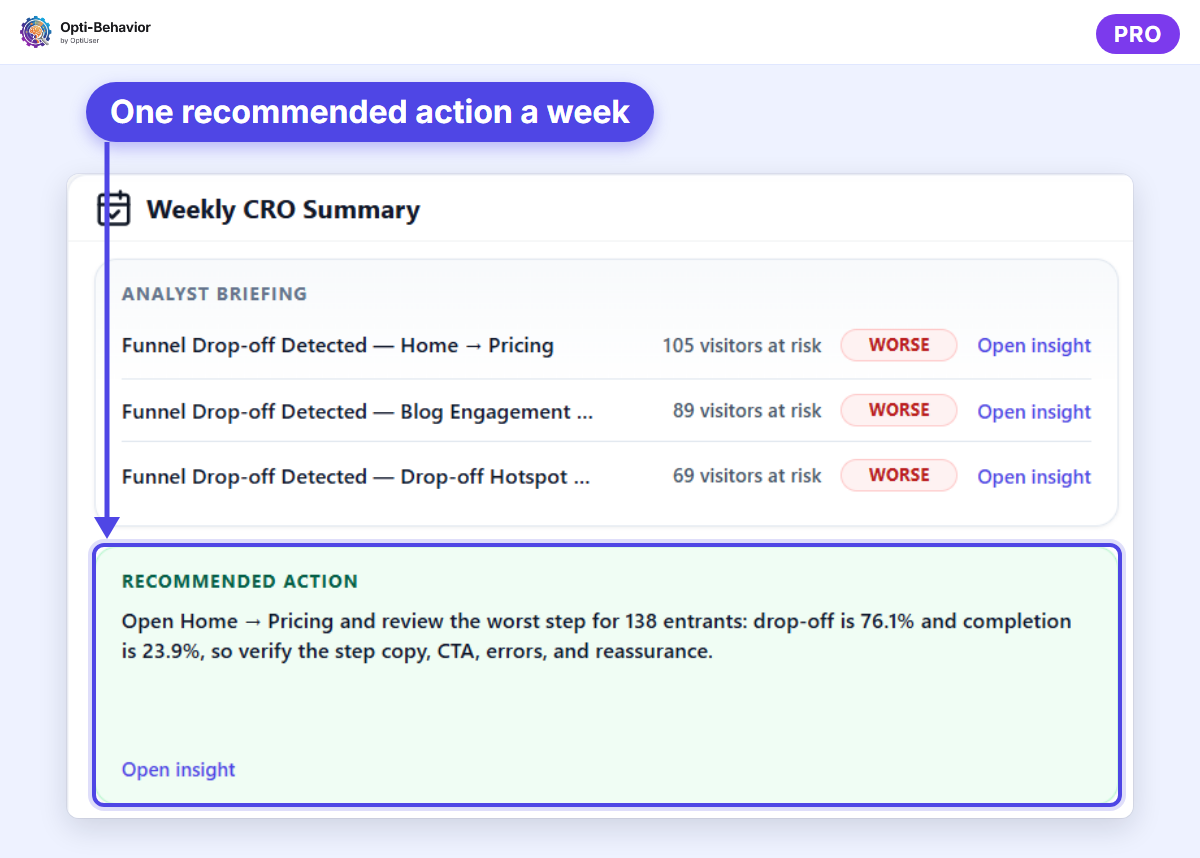
3. The weekly summary gives one action
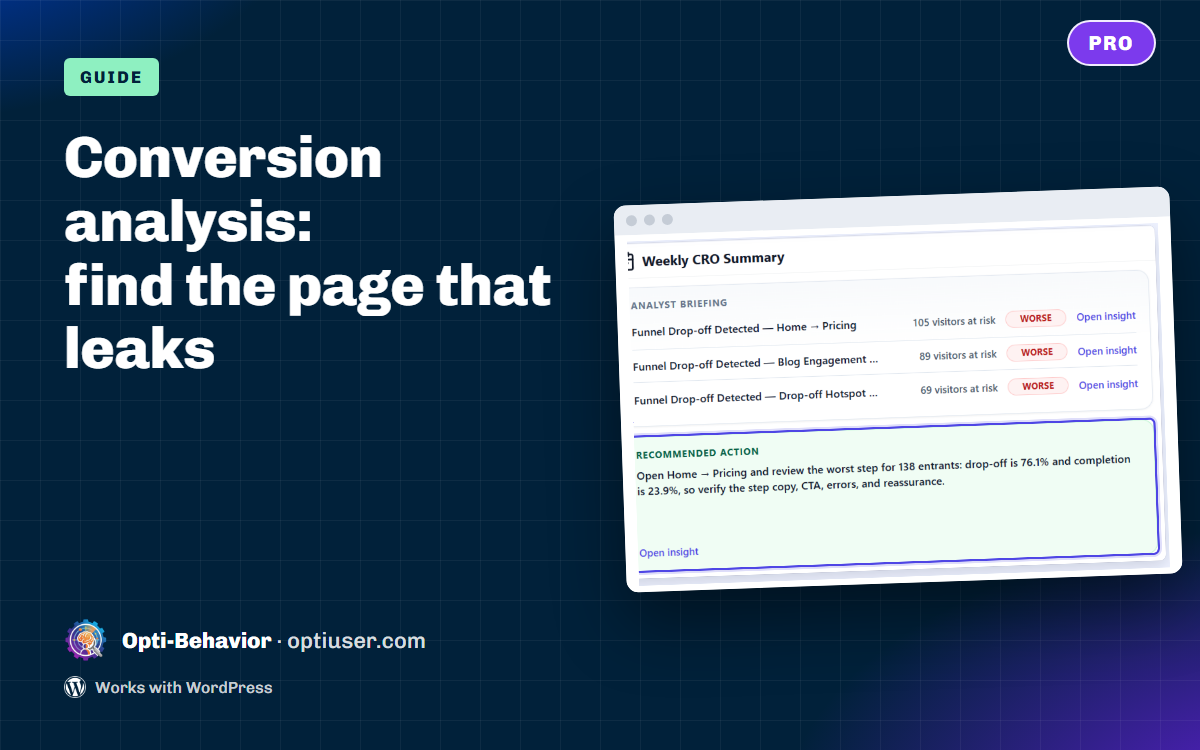
The Weekly CRO Summary (Pro) opens with the three costliest problems, each marked new, worse, better, unchanged or resolved compared with the previous reading, and ends with one recommended action for the week.
4. Open the page that leaks
When a problem sits on one page, Page X-Ray (Pro) reads every module for that page and ranks what to fix by the visits it costs. The free plugin shows a preview of your three most visited pages, each with a health score and its first problem. The full walk-through is in why your landing page is not converting.
5. Share the result
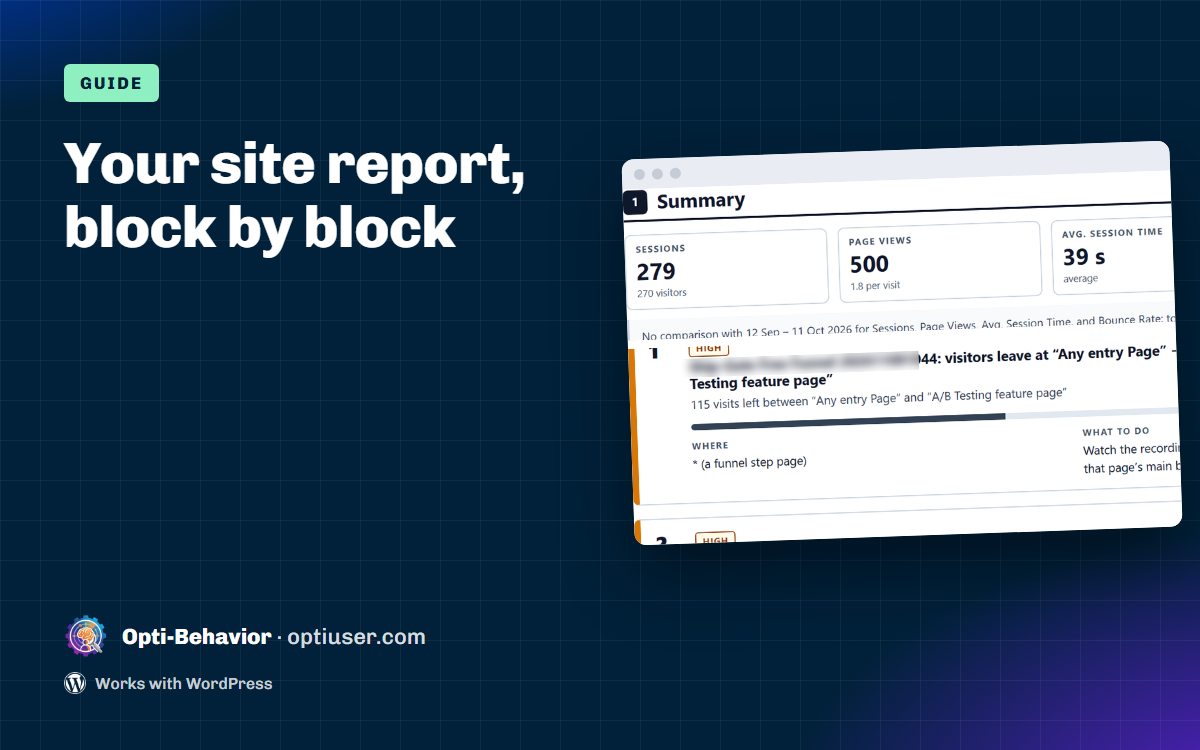
The site report (free) prints the period with the three most costly issues and what to do for each. If you report to a client or a team, start from our analytics report template.
Smart Insights is part of the free Opti-Behavior plugin, and visitor data stays on your own WordPress server. See what Smart Insights checks on your site.
What to check one week after the fix
- Same step, same length of period. Compare the visits that reach the next step for 7 days before and 7 days after the change. Not the site average.
- Mark the card as fixed. Smart Insights then compares the period before and after your change and shows the result.
- Respect the sample size. The first cards usually come after about 100 visits on a page. Under that, read a change as a hint, not a result.
- Look for a new leak. A fix can move the drop one step further: check the next step of the funnel and the errors on the page.
- Bigger change? Test it. Run an A/B test. If the step converts at 0 %, a test has nothing to compare: change the page and compare 14 days before and after.
FAQ
What is conversion analysis?
Conversion analysis is the study of the path visitors take to your goal (an order, a sign-up, a sent form) to find the step where they stop and the reason why. It starts with the conversion rate, then breaks the path into steps.
What is the difference between conversion analysis and a conversion rate?
The conversion rate is one number for a period. Conversion analysis explains it: which page, which step, which cause, and how many visitors each cause costs.
How many visits do I need?
Enough for each step to count. Smart Insights usually shows its first cards after about 100 visits on a page, and marks how confident it is from the visits measured.
Is Smart Insights free?
Yes, Smart Insights is in the free plugin, with cards on page behaviour, funnels you can create in one click and a site report. The Weekly CRO Summary, Page X-Ray and the cards built from recordings, forms and errors are in Opti-Behavior Pro.
Where should I start if I have very little traffic?
Start with the path, not the rate. Under about 100 visits a week, read counts, not percentages: how many visitors reached the cart, how many reached the checkout, how many orders. Then run the checks that need no traffic at all: place a test order on a phone, send your own contact form, and open the browser console on the cart and the checkout. These three checks find a cost shown too late, a required field that stops people and a script error, three of the causes listed above. When traffic grows, the funnel and the Smart Insights cards confirm or correct what you found.
Which conversion analysis tools do I need?
At minimum, a tool that counts the visits of each page and of each step of your path. A click heatmap, form analytics and an error log then tell you why visitors stop there. You can use separate tools, or one WordPress plugin that keeps them together, with the visitor data on your own server.
The Opti-Behavior Team