WordPress Error Tracking: Find the JavaScript Errors That Silently Cost You Sales

On a Tuesday, Paul updated three plugins on his furniture shop. Everything looked fine on his laptop. On Friday, he noticed that sales had dropped by a third. No customer had complained. No email. No warning.
It took him two days to find the cause. After the update, the "Add to cart" button on product pages did nothing on iPhones. A JavaScript error in one plugin stopped the button from working on Safari. Customers tapped, nothing happened, and they went to another shop.
This is the problem with website errors: they are silent. Your visitors see them. You do not. WordPress error tracking fixes that by recording the errors that happen in your real visitors’ browsers, and telling you which ones matter. This guide explains how it works, what to look for, and a weekly routine that takes ten minutes.
In one sentence: Error tracking records the problems your visitors hit (script errors, broken links, clicks that fail) and shows you which page, browser and plugin they come from, so you fix the ones that cost money first.
Contents
Why you never see these errors yourself
- You test on one browser. Your visitors use dozens: old iPhones, Samsung phones, Firefox, Safari.
- You are logged in. Admins often see a different version of the page, and skip the cache.
- Errors come from updates. A plugin, a theme or WordPress itself changes, and something breaks somewhere else.
- Visitors do not report problems. They leave.
What WordPress error tracking records
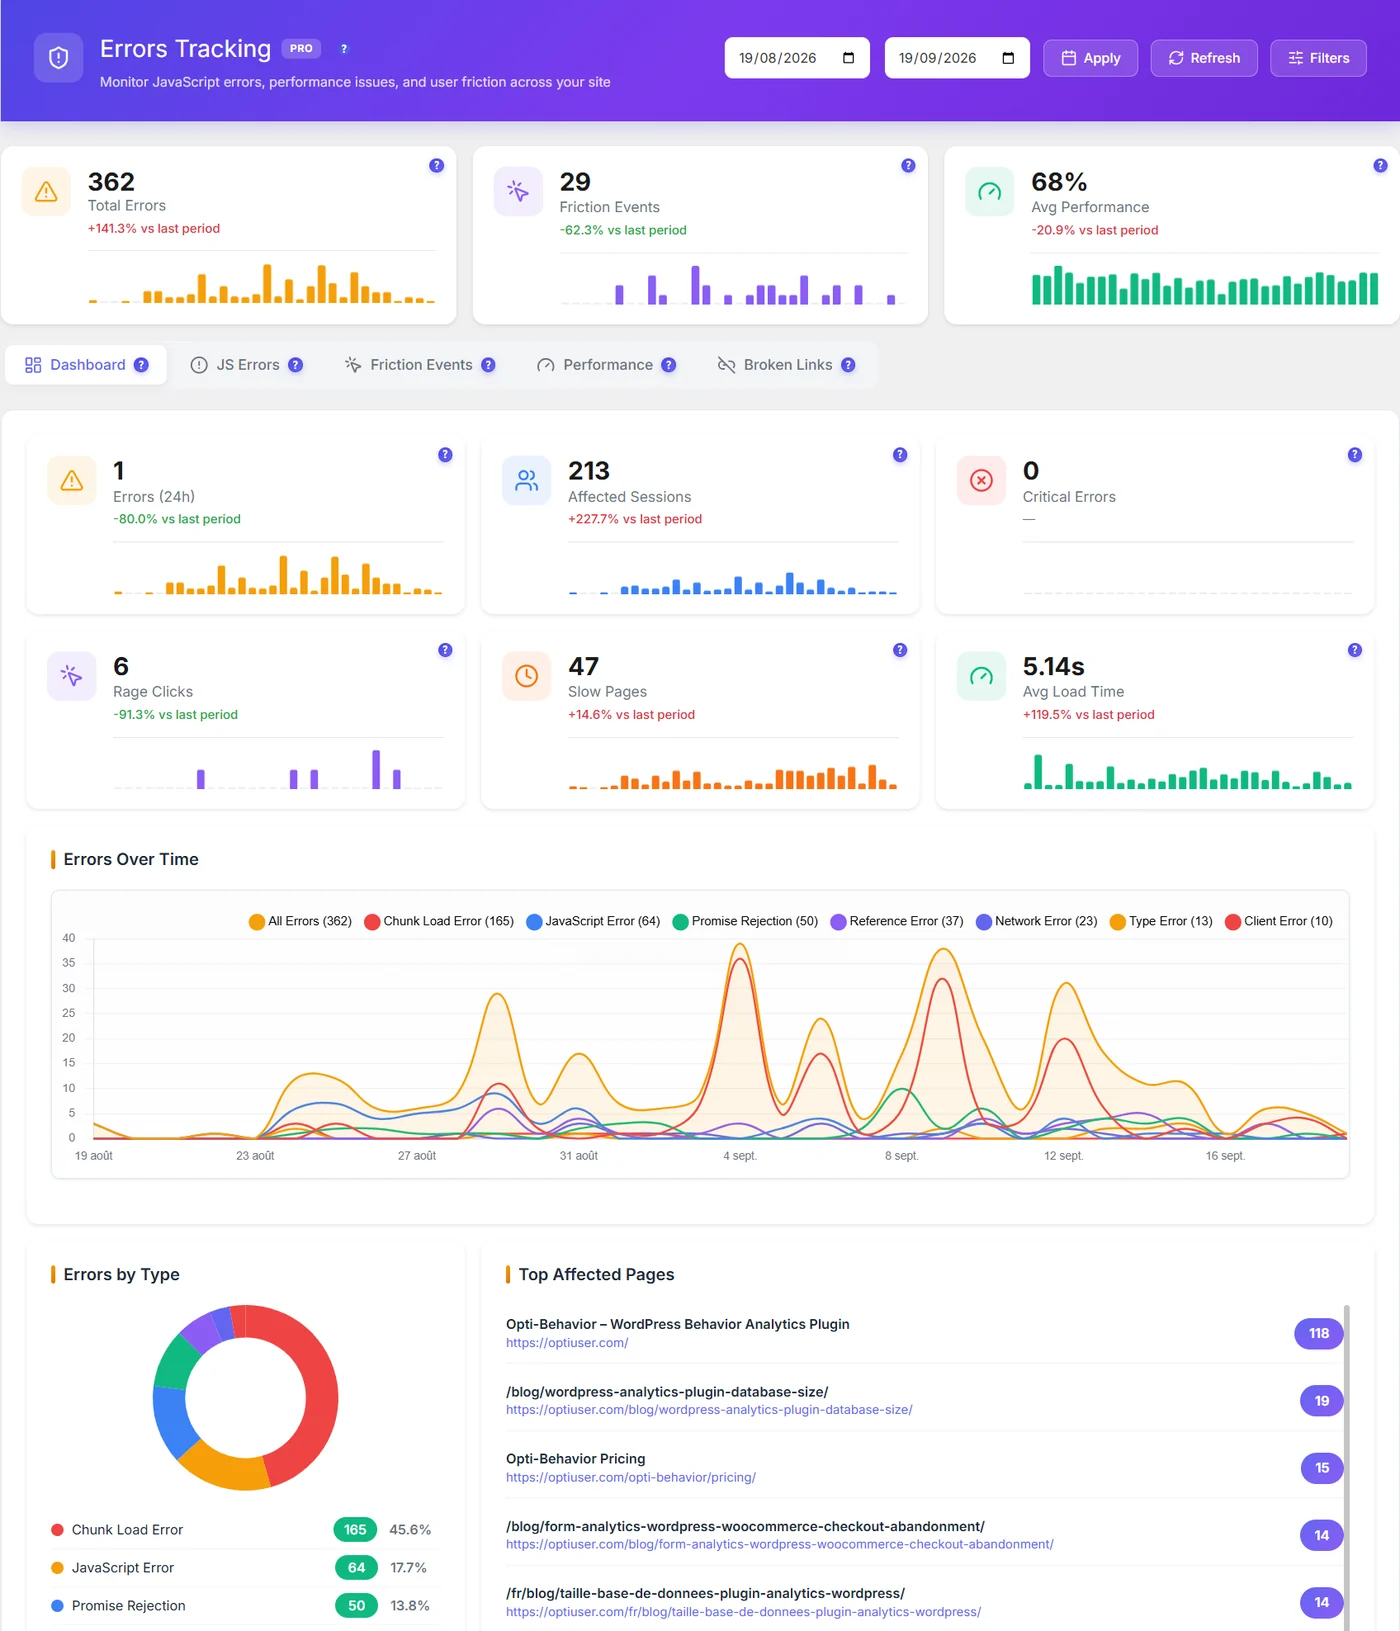
Opti-Behavior Pro’s Errors Tracking has five tabs:
| Tab | What it shows |
|---|---|
| Dashboard | Totals, trends, errors by type, most affected pages |
| JS Errors | Each script error with its file, line and context |
| Friction Events | Rage clicks, dead clicks and error clicks, with a verdict |
| Performance | Score, load time and Core Web Vitals per page and device |
| Broken Links | Links and files that return errors |
JavaScript errors
For each error, you get:
- The message and type (TypeError, ReferenceError, promise rejection, chunk load, network).
- The full script address, line and column, and the plugin or theme that ships the file.
- The first lines of the call stack.
- The browsers and devices affected, the number of visits, and the first and last time it was seen.
- The element clicked just before the error.
That last point is gold. Paul would have seen: "TypeError in variation-swatches.min.js, after a click on Add to cart, Safari iOS only, 212 visits." Two minutes, not two days.
Friction events
Not every problem is a script error. Friction events catch what people feel:
| Type | What happened |
|---|---|
| Rage click | Several fast clicks on the same spot |
| Dead click | A click on something that looks clickable and does nothing |
| Error click | A click followed by a script error |
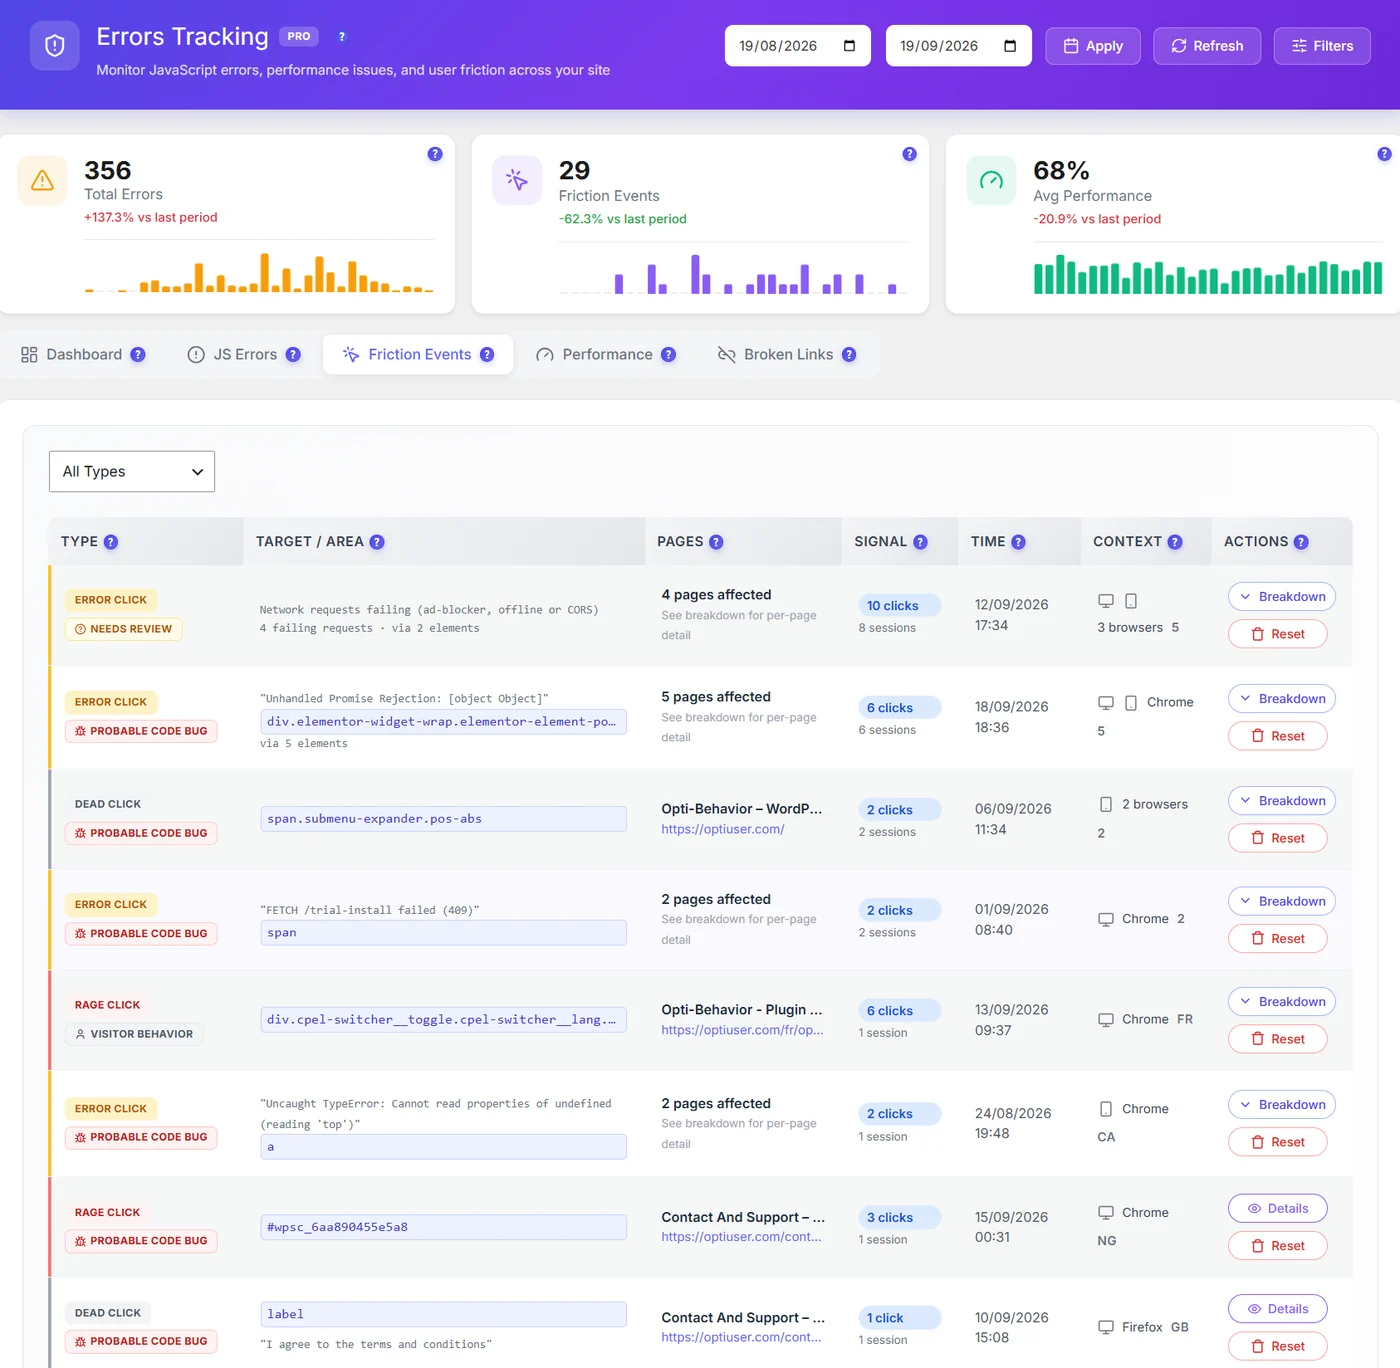
Each group gets a verdict: Probable code bug (the clicks trigger an error), Needs review (could be a bug or the network), or Visitor behavior (normal impatient clicking). Details show if an overlay, like a cookie banner or pop-up, was covering the element. We wrote a whole guide on rage clicks and dead clicks.
Broken links
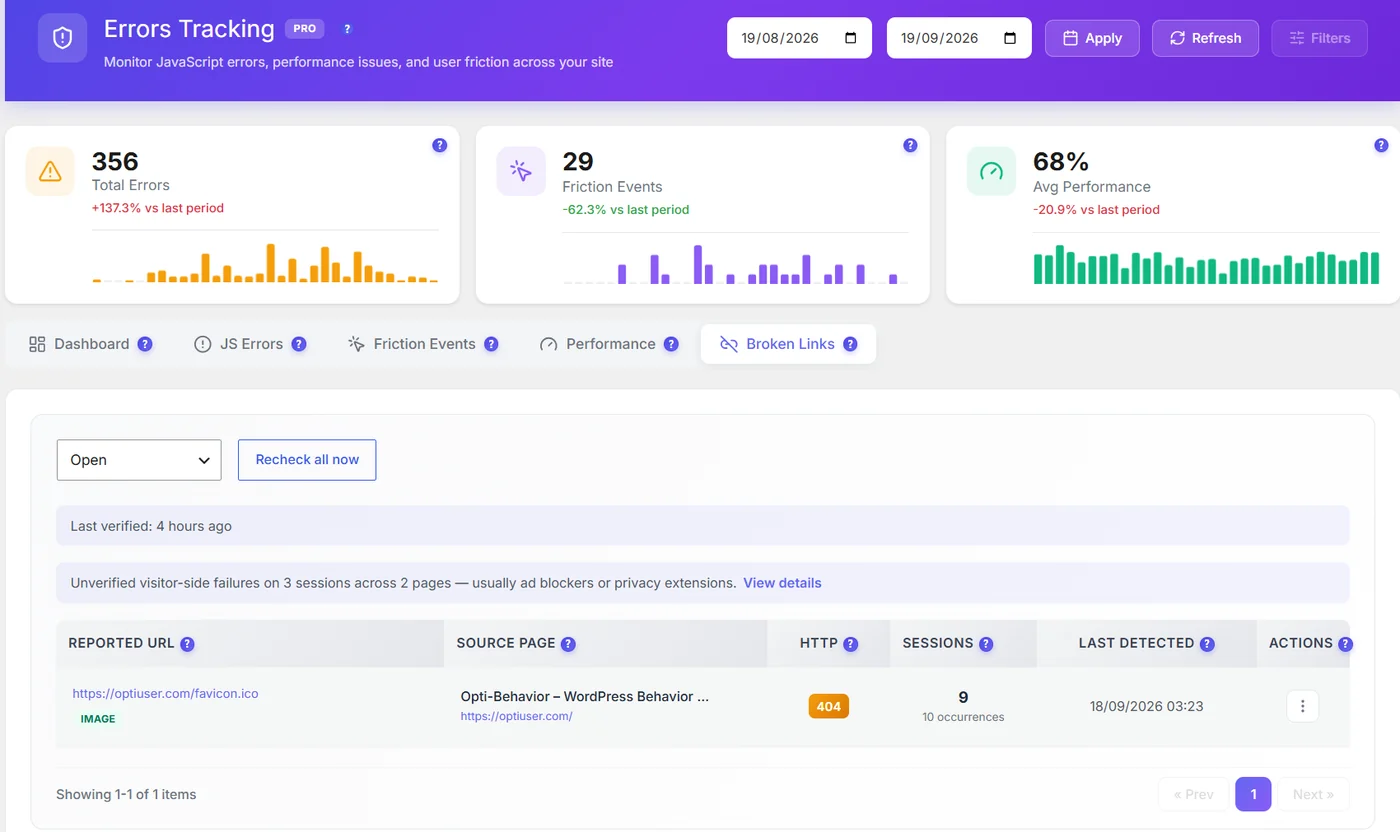
Visitors’ browsers report links and files that fail. Opti-Behavior then checks them again from your server, so a broken link is only listed when it is really broken. Failures that could not be confirmed (usually ad blockers or privacy extensions) are counted separately.
| Common case | Fix |
|---|---|
| Old address after changing a permalink | Add a 301 redirect to the new address |
| Deleted product or post still linked | Remove the link or redirect to a similar page |
| Missing image or favicon | Upload the file again |
| Typo in a menu link | Fix it in Appearance > Menus |
After fixing, click Recheck. Fixed links close on their own.
Performance
The Performance tab scores each page from 0 to 100 and shows load time and Core Web Vitals on real visitors, split between desktop and mobile. A slow page is not an "error", but it loses people just as surely. More in our Core Web Vitals guide.
How to find the errors that cost money
You will see many errors. Most do not matter. Here is how to sort them.
- Sort by visits affected. An error that hits 300 visits beats one that hit 2.
- Start with pages that make money. Checkout, cart, product pages, contact and quote forms.
- Read the owner. The file tells you which plugin or theme is responsible. Update it, change a setting, or contact its author.
- Check the browsers. An error only on Safari or old browsers often means code those browsers do not support.
- Watch one recording of an affected visit to see the real consequence.
- Ignore the noise. Errors from browser extensions (the file is not on your site) and "network requests failing" from ad blockers or bad connections usually are not your bugs.
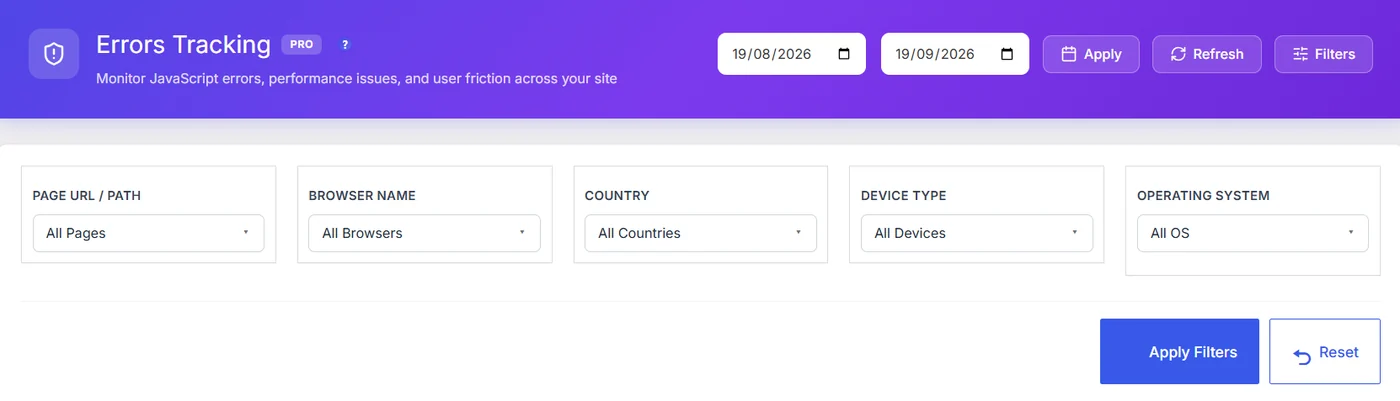
Use the dashboard chart too: a spike of errors on the day of an update points straight at that update.
Statuses: keep the list short
| Status | Use it when |
|---|---|
| Open | The problem is still there (default) |
| Fixed | You deployed a fix. Mark it Fixed and check it does not come back |
| Ignored | Harmless or outside your control |
Ignoring an error does not delete it. It just hides it from the open list, so the list stays useful.
Who does what
| Role | Task |
|---|---|
| Site owner | Reads the dashboard once a week and picks priorities |
| Developer | Fixes JavaScript errors and "probable code bug" friction |
| Content editor | Fixes broken links and dead clicks on content |
| Everyone | Ignores noise so the list stays clean |
A 10-minute weekly routine
- Dashboard: any spike since last week? Which day?
- JS Errors: fix or ignore the top 3 by visits.
- Friction: check the "probable code bug" groups.
- Broken Links: recheck and fix.
- Performance: one slow important page per week.
And always after updating plugins: open the dashboard the next day.
What Paul does now
Paul still updates his plugins every week. But now, the next morning, he opens the Errors dashboard with his coffee. Last month it caught a gallery script failing on Firefox after an update, affecting 40 visits a day on product pages. He rolled back the plugin the same morning. Sales did not even notice.
Errors Tracking is part of Opti-Behavior Pro. For the full picture of how visitors use your pages, see our WordPress heatmap guide.
Catch the errors your visitors see
Opti-Behavior Pro records JavaScript errors, friction clicks, broken links and page speed on real visits. Try it free for 6 months.
WordPress error tracking FAQ
What is WordPress error tracking?
It records problems that happen in your real visitors’ browsers, such as JavaScript errors, broken links and clicks that fail, and shows which page, browser and plugin they come from.
How do I find JavaScript errors on my WordPress site?
You can open the browser console on your own device, but that only shows your errors. An error tracking tool records the errors of all real visitors, with the file, the plugin and the browsers affected.
Should I fix every JavaScript error?
No. Start with errors that affect many visits on pages that make money, like checkout and forms. Errors from browser extensions and ad blockers are usually noise.
Can a plugin update break my site without me noticing?
Yes. An update can break a button or script on some browsers only. Checking your error dashboard the day after updates catches these problems early.
Does error tracking slow down my site?
A light tracker adds very little. Opti-Behavior’s trackers are small, loaded with defer and send data in batches.