
A good conversion rate is not a number you copy from a benchmark. It is the rate of one clear action, measured the same way every month, for one type of page and one type of visitor. Averages mix sites, prices and devices that have nothing to do with yours.
Our own site shows why. In Smart Insights on optiuser.com (2–31 October 2026), the conversion rate of mobile visitors was 4.9%, against 9.6% for all visitors. Same site, same month: one overall rate would have hidden that gap. It is a small sample from our own site, not a benchmark. In this guide we work out what a good rate means for your site, then how to find and fix the weakest step.
Short answer: A good conversion rate is one that is better than your own rate last month, measured the same way. Industry averages are rough hints, not goals. Measure one clear action, per visitor, for each type of page, and improve the weakest step first.
Contents
- What is a conversion, exactly?
- How to calculate your conversion rate
- So what is a good conversion rate?
- Split the rate into steps
- Measure what counts as a win
- Careful: a higher conversion rate is not always better
- Know what one conversion is worth
- 8 ways to raise your conversion rate
- What our own numbers told us
- Good conversion rate FAQ
What is a conversion, exactly?
A conversion is when a visitor does the thing you want. It can be big or small:
| Type | Examples |
|---|---|
| Big (macro) conversion | A purchase, a paid sign-up, a booked call, a quote request |
| Small (micro) conversion | Adding to cart, starting a form, signing up to a newsletter, watching a demo |
Small conversions matter because they lead to big ones. If nobody adds to cart, nobody buys.
How to calculate your conversion rate
The formula is simple:
Conversion rate = conversions ÷ visitors × 100
For example: 20 conversions ÷ 1,000 visitors × 100 = 2%.
But watch out. Tools do not all divide by the same thing:
- Per visitor: people who converted, divided by the people who came. This is the honest one for sales.
- Per session: conversions divided by visits. The rate looks lower, because many people visit twice before buying.
- Per page: conversions on one page divided by that page’s visitors. Best for comparing pages.
When you compare numbers, always use the same method. Many "benchmark" articles do not say which one they used.
So what is a good conversion rate?
Here are ranges you often see quoted in marketing reports. They come from different studies and change every year, so treat them as rough hints:
| Type of page or site | Often quoted range |
|---|---|
| Online shop (all visitors) | 1% to 3% |
| Shop, visitors who add to cart | 30% to 60% reach checkout |
| Lead form on a service site | 2% to 5% |
| Dedicated landing page from an ad | 5% to 15% |
| Newsletter sign-up box on a blog | 1% to 3% |
| Free trial sign-up (software) | 3% to 10% |
Why are the ranges so wide? Because a "good" rate depends on:
- Price. A $5 ebook converts more than a $900 course.
- Traffic source. Visitors from your newsletter already trust you. Visitors from a cold ad do not.
- Device. Mobile visitors often browse and buy later on a computer.
- Intent. Someone searching "buy yoga class online" is ready. Someone searching "is yoga good for back pain" is learning.
So the real question is not "is my rate good?" but "which step of the journey is weak, and for which visitors?"
Split the rate into steps
One big conversion rate hides where the problem is. Split the path into steps. This is called a funnel.
A typical path for a paid product is: Sales page, Pricing, Checkout, Thank-you page. In Opti-Behavior, you can create this funnel in a minute: go to Opti-Behavior > Funnels, click Build New Funnel, and add each step with a URL rule, like "URL Contains /pricing/". Opti-Behavior also suggests funnels built from the pages of your site.
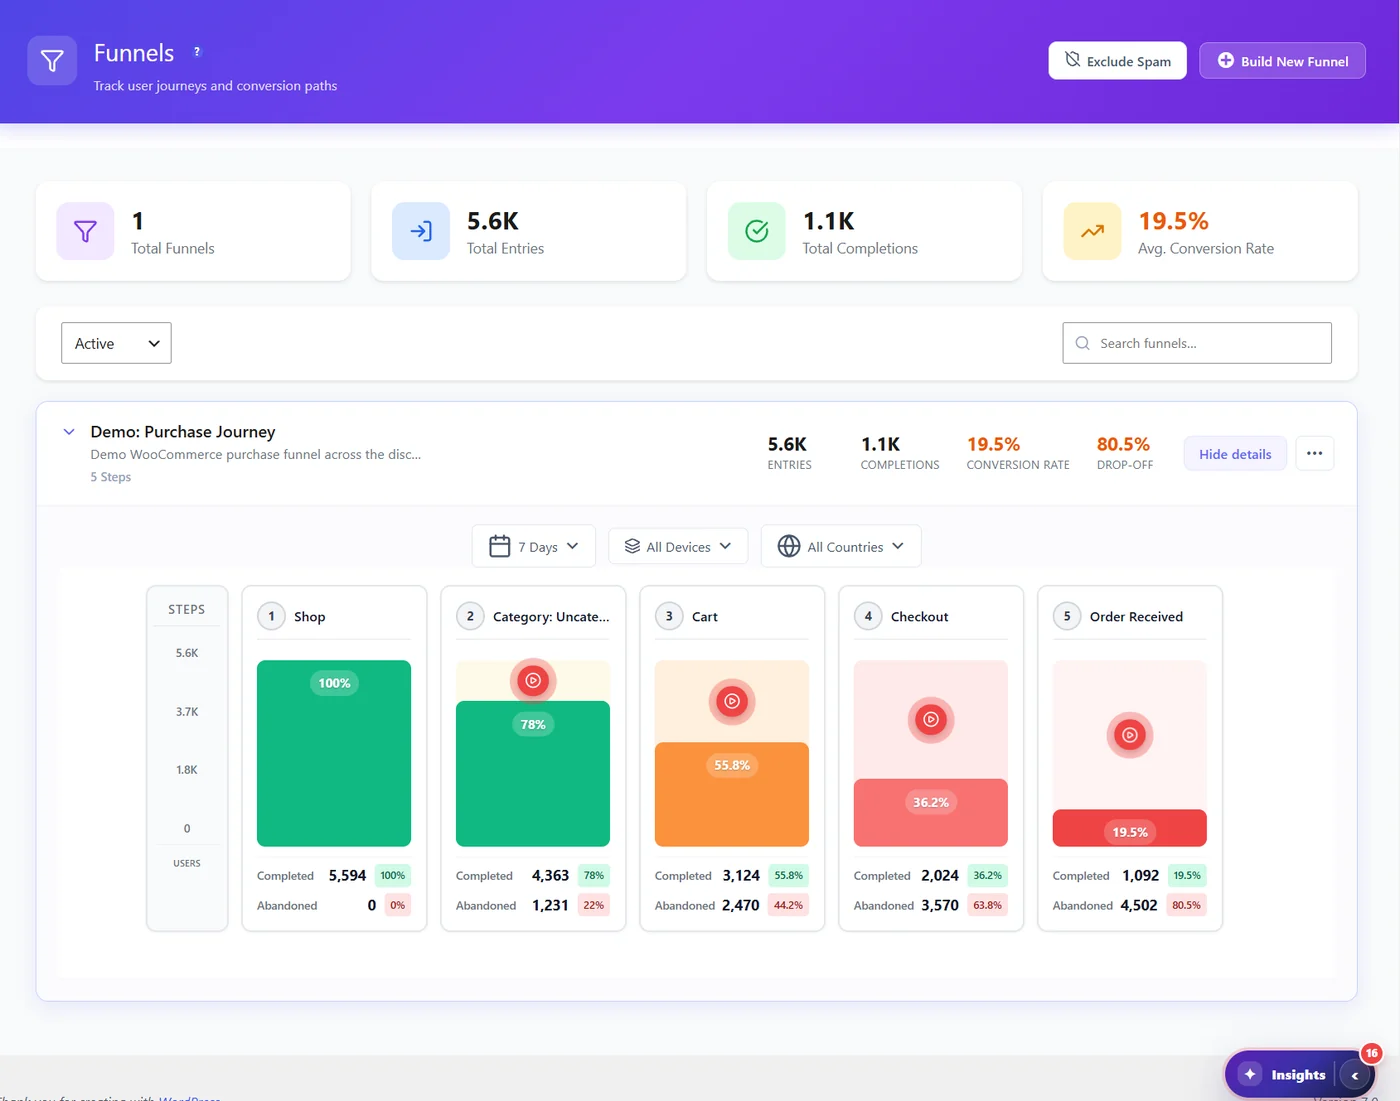
Read the funnel from top to bottom and look for the step with the lowest "continue" percentage: that is your weakest step. If many people reach pricing but few finish checkout, you have a checkout problem, not a traffic problem.
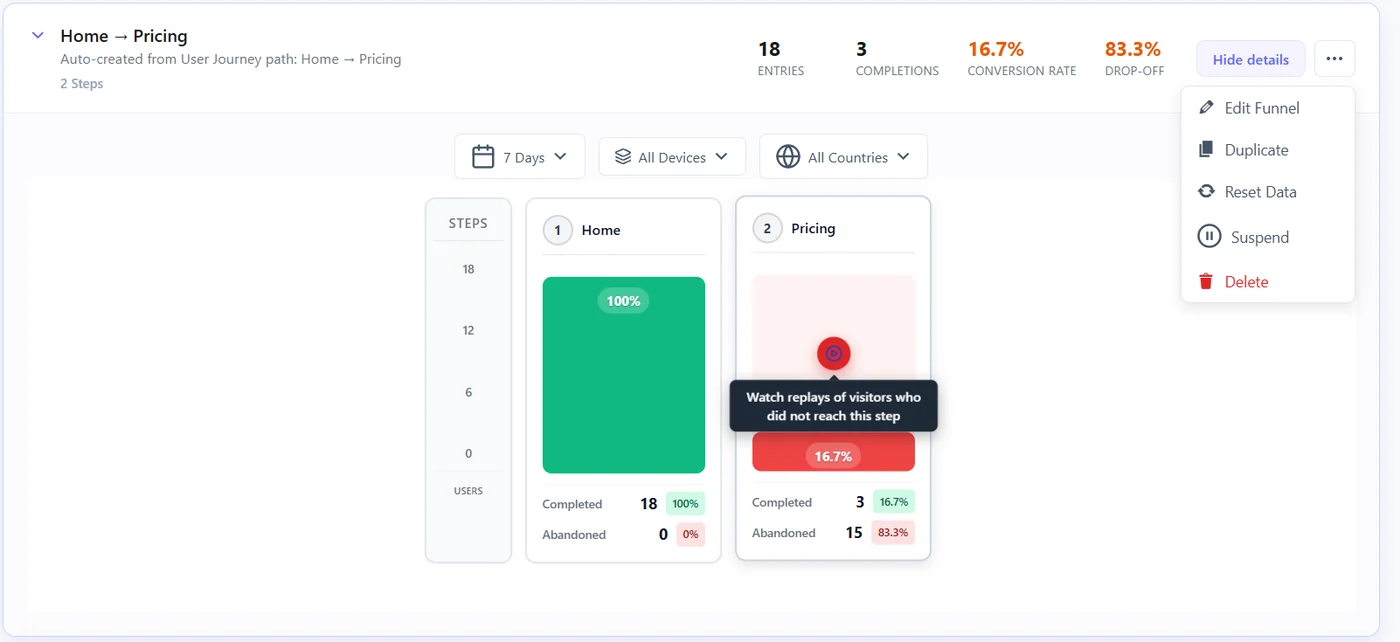
With Pro, each funnel step links to the recordings of the people who left right there. Watch a few of them on the weakest step, on mobile and on desktop: the cause is often visible in seconds, such as a forced account, a field that rejects input or a button below the fold.
Measure what counts as a win
When you change something, you want to know if it worked. That is what A/B tests are for: half your visitors see the old version, half see the new one, at the same time.
In Opti-Behavior, a test has goals. The first goal is the one that picks the winner.
| Goal | Counts a conversion when | Plan |
|---|---|---|
| Page visit | The visitor reaches a page, like a thank-you page | Free |
| Click | The visitor clicks an element you pick on the page | Free |
| Form submit | A form on the page is sent | Free |
| Scroll depth | The visitor scrolls to a depth you set | Pro |
| Time on page | The visit lasts longer than a threshold | Pro |
| Revenue | WooCommerce orders from the test | Pro |
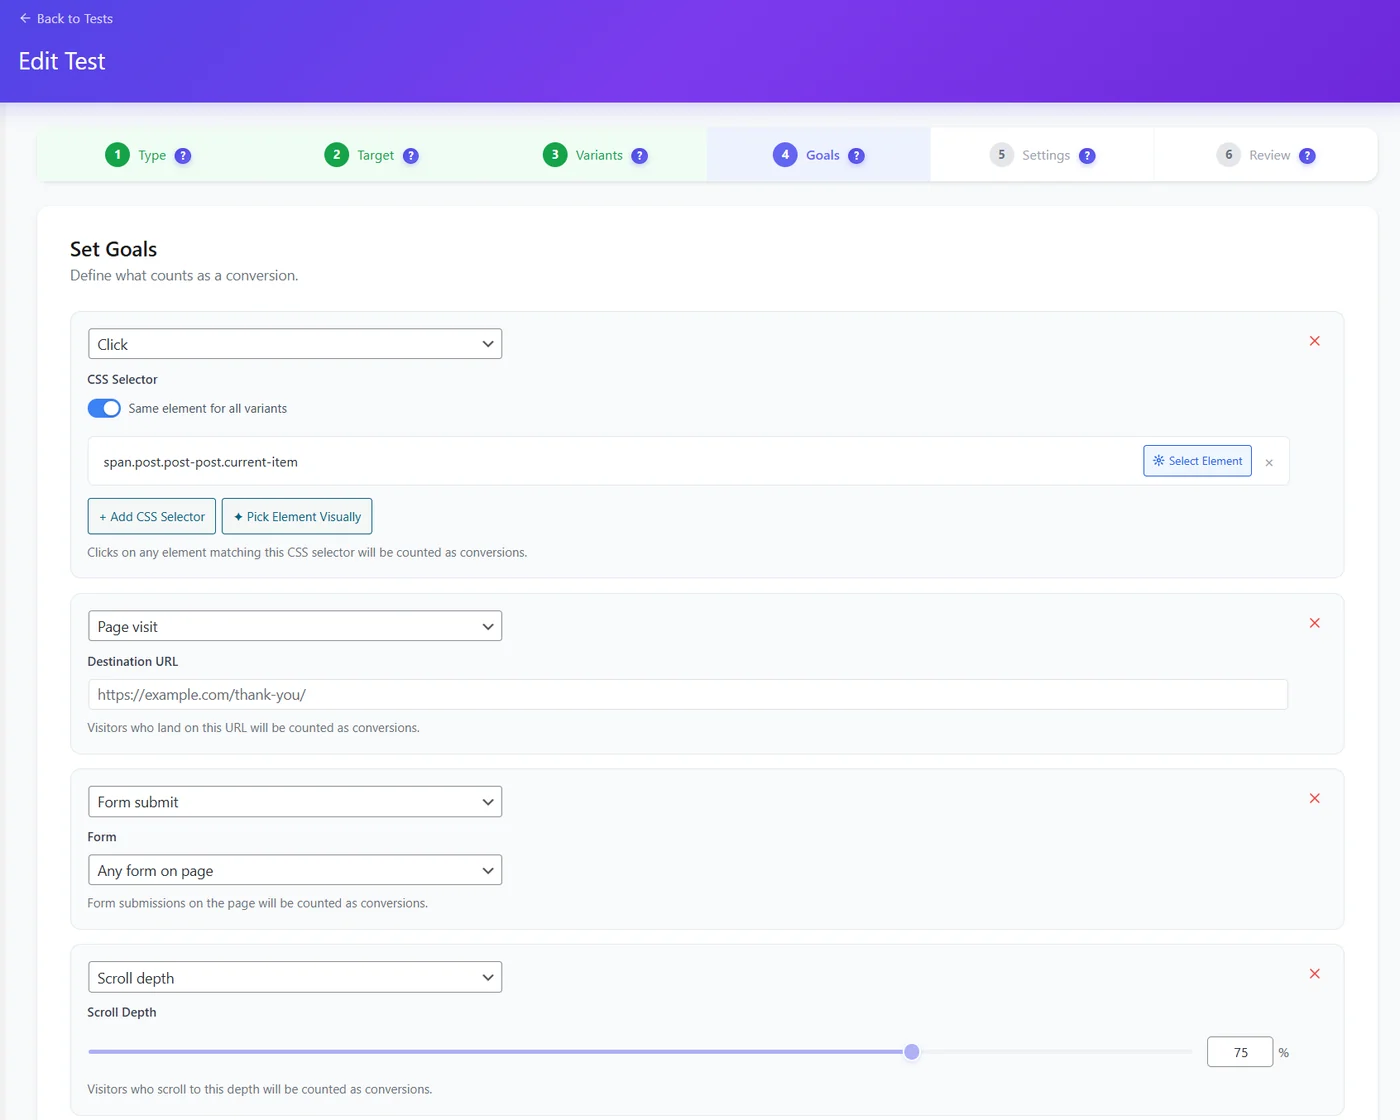
The free version runs up to 3 tests at the same time, with up to 3 versions each.
Careful: a higher conversion rate is not always better
This surprises a lot of people. Look at this worked example (illustrative numbers) from our A/B testing docs:
| Version | Visitors | Orders | Conversion rate | Average order | Revenue per visitor |
|---|---|---|---|---|---|
| A (current) | 1,000 | 30 | 3.0% | 60 € | 1.80 € |
| B (free shipping over 50 €) | 1,000 | 27 | 2.7% | 78 € | 2.11 € |
Version B has a lower conversion rate, but people spend more, so it earns 17% more per visitor. If you only looked at the conversion rate, you would pick the wrong version. For shops, watch revenue per visitor too. Pro can measure it with a Revenue goal.
Know what one conversion is worth
Once you know the value of one conversion, every leak has a price. In Smart Insights settings, you can type the value of one conversion (Free and Pro). Smart Insights then estimates what a problem costs you. With Pro, WooCommerce orders set that value for you.

Once each leak has a price, you stop asking whether your rate is "good" and start fixing the step that costs the most.
8 ways to raise your conversion rate
- Fix the weakest step first. A 10% gain on your worst step beats a 10% gain on your best one.
- Remove forced account creation. Let people buy as guests. Offer an account after payment.
- Show the price and what is included early. Surprises at checkout kill sales.
- Make the main button obvious. One clear action per page, visible without scrolling on mobile.
- Answer doubts next to the button. Refunds, delivery time, support. One line each.
- Speed up mobile. A slow checkout on a phone loses people fast.
- Check for broken things. Rage clicks and JavaScript errors on a checkout page are pure lost money. Read our guide on rage clicks.
- Test, do not guess. Run an A/B test on one change at a time. Our WordPress A/B testing guide shows how.
What our own numbers told us
On optiuser.com, Smart Insights split our visitors by device over 2–31 October 2026. Two gaps stood out: the conversion rate was 4.9% on mobile against 9.6% for all visitors, and button clicks were 49.2% on mobile against 70.2% on desktop.
This is a small sample from our own site, so we do not treat it as a rule for anyone else. What it gave us is a place to look first: our pages and buttons on mobile. That is the point of measuring your own rate. You do not need to know whether a figure is "good" for your industry; you need to know which step and which device to work on next.
Find your weakest conversion step
Opti-Behavior is free: funnels, click heatmaps and A/B tests on WordPress. Pro adds drop-off recordings and revenue goals, with a 6-month free trial.
Good conversion rate FAQ
What is a good conversion rate?
It depends on your site, price and traffic. Rough ranges often quoted are 1% to 3% for online shops, 2% to 5% for lead forms and 5% to 15% for focused landing pages. The best benchmark is your own rate last month, measured the same way.
How do I calculate my conversion rate?
Divide the number of conversions by the number of visitors and multiply by 100. For example, 20 sales from 1,000 visitors is a 2% conversion rate.
Is a 2% conversion rate good?
For an online shop with mixed traffic, 2% is often considered solid. For a landing page that only receives ad visitors, it may be low.
Why is my conversion rate low?
Usually one step loses most people: an unclear offer, a hidden button, a surprise cost, a long form or a broken checkout. A funnel shows which step, and recordings show why.
Should I trust average conversion rate benchmarks?
Only as a rough hint. Studies measure different sites in different ways. Track your own rate per page and per step, and try to beat it.
The Opti-Behavior Team