
A website analytics report answers three questions: what changed, what to fix first, and where it happens. Read it in this order: the Summary, then the 3 issues to look at first, then the block of issue n°1. Fix that one thing, then compare the next period of the same length.
The website analytics report example used in this guide
This guide walks through every block of the Opti-Behavior site report (version 1.11.0), in the order the report prints them. The example is one of our test WordPress shops with simulated visits (its pages are named “QA Sim”), over 30 days (12 October to 10 November 2026): test data, not a customer. A block with no data is left out of the report, and the numbers of the next blocks follow.
In this article
- How to read a website analytics report in 5 steps
- Header and client name
- The “report incomplete” notice
- Contents
- Summary
- The 3 issues to look at first
- Shop and carts without an order
- Forms with problems
- Clicks and errors
- Traffic
- AI robots and visitors sent by AI assistants
- Journeys and funnels
- Busiest time
- A/B tests
- Signals by module
- One card per page
- Page X-Ray appendix
- Print, save as PDF, send to your client
- What is Free, what is Pro
- FAQ
How to read a website analytics report in 5 steps
Most people read a report from top to bottom and stop at the traffic chart. The useful order is different:
- Summary: did the period go up or down, and against which period?
- The 3 issues to look at first: pick issue n°1, the one that touches the most visits.
- The block of that issue: Shop, Forms, Clicks and errors or Funnels, to see where it happens.
- One fix: one change, with the date it goes live.
- The next report: same length of period, same figure, before and after.
Every block of this website analytics report example ends with a “What to do” line written by the plugin. Read that line first: it is the action, the figures above it are the proof. If you want a blank version to fill by hand, use our analytics report template.
1. Header and client name (Pro)
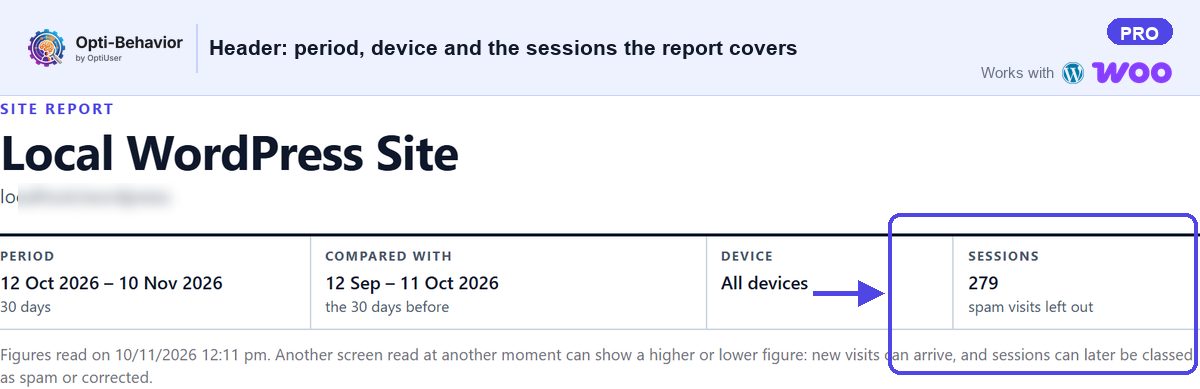
Role: it says which site, which period and, for an agency, which client the report is for.
How to read it: check the dates first. Every figure below is counted on those days only. In our example: 12 Oct 2026 – 10 Nov 2026 (30 days), compared with 12 Sep – 11 Oct 2026, all devices, 279 sessions with spam visits left out. With a Business or Agency licence, the header can show “Prepared for” with your client’s name and your agency notes.
Common mistake: sending a report whose period does not match the one you discussed with the client.
Action: write two lines in the agency notes: what you changed since the last report, and what you will check next.
2. The “report incomplete” notice
This notice only appears when a Pro module is missing.
Role: it tells you which blocks are not included, so you do not read an absent block as “no problem”.
How to read it: the notice names what is missing. The rest of the report is complete and can be read as usual.
Common mistake: concluding “no form problems” when the forms module was simply not running.
Action: turn on the missing module, or tell your reader which block is absent and why.
3. Contents (Pro)
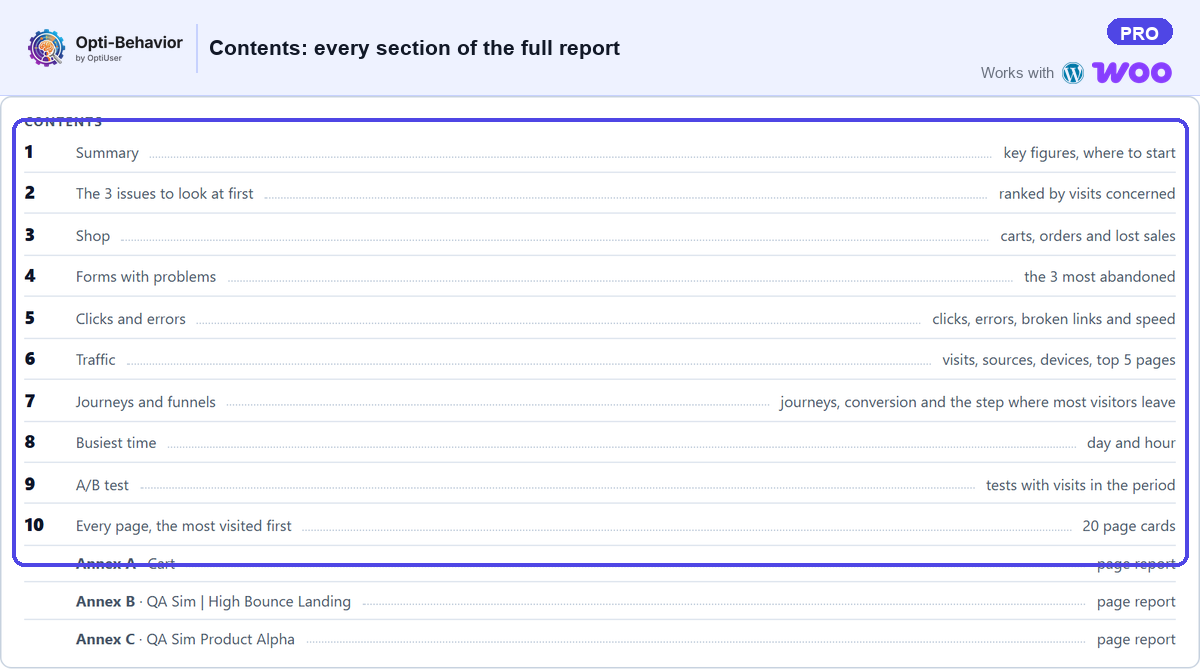
Role: the full version lists every section with its number, so a client can jump to the part they care about.
How to read it: the numbers follow the blocks that have data. A missing number is a block left out because it was empty, or hidden by you.
Common mistake: looking for a section that was hidden in the agency settings.
Action: before sending, read the Contents as your client will: is the block that matters to them there?
4. Summary (Free)
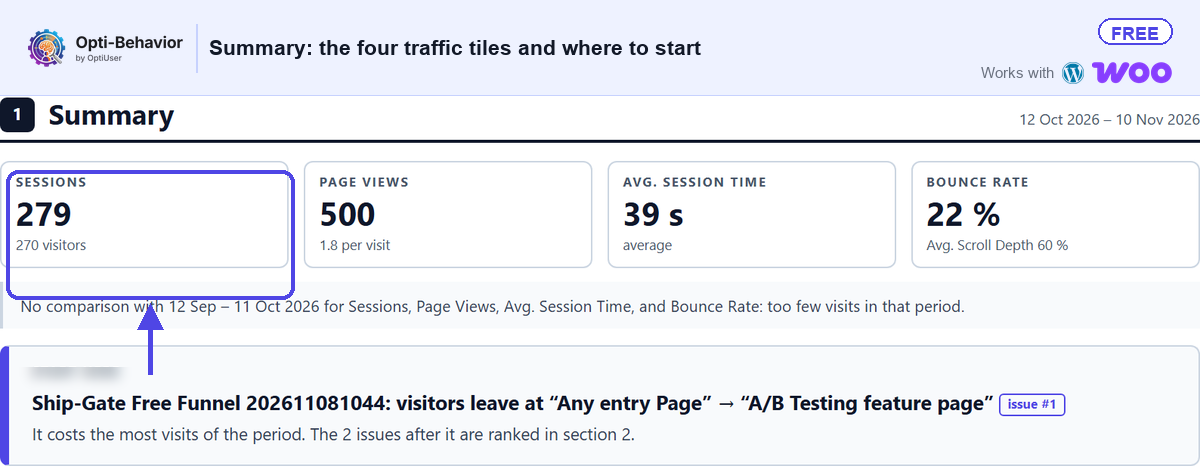
Role: the key tiles of the period with their change, and a “Start here” box that says where to begin.
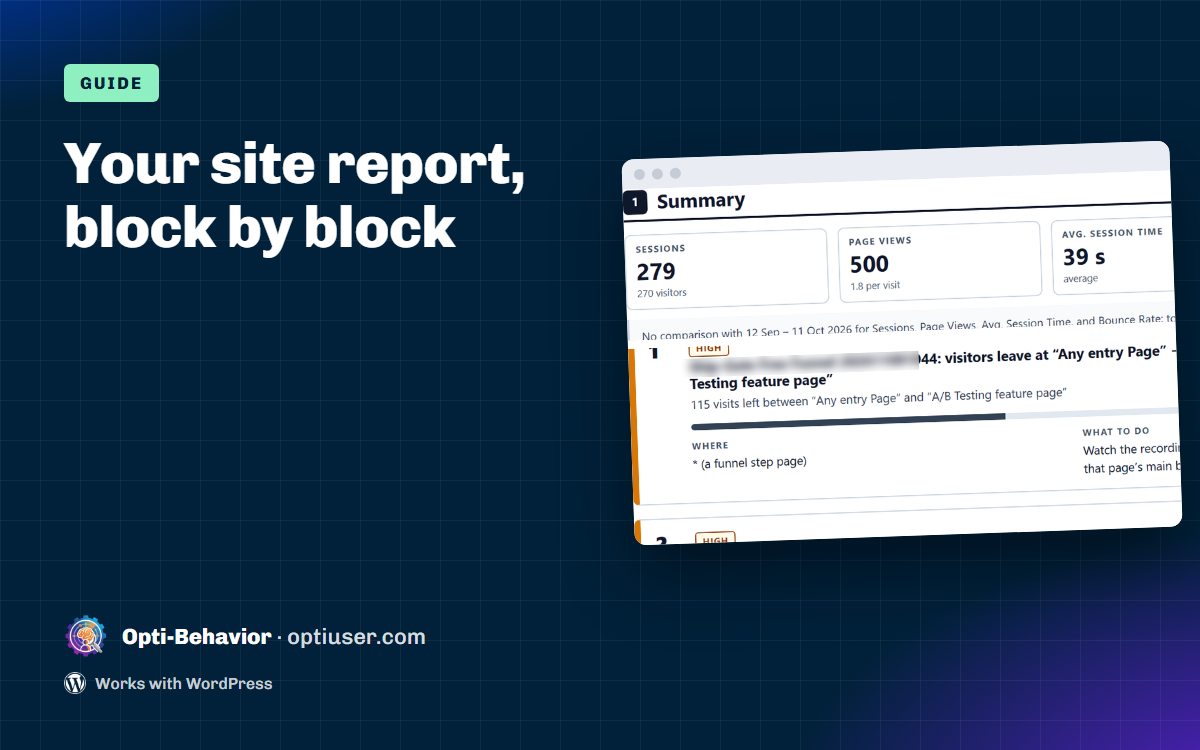
How to read it: read the change, not only the figure. In our example: 279 sessions, 500 page views, 39 s average session time and a 22 % bounce rate, with no change shown because the 30 days before had too few visits. The change is counted against the previous period of the same length.
Common mistake: comparing with a period that cannot be compared. The report says so itself: “No comparison with … : that period is incomplete (too few days with data)”, or “too few visits in that period”. When you see that line, do not quote a change.
Action: follow the “Start here” box. It points to the block to open first.
5. The 3 issues to look at first (Free)
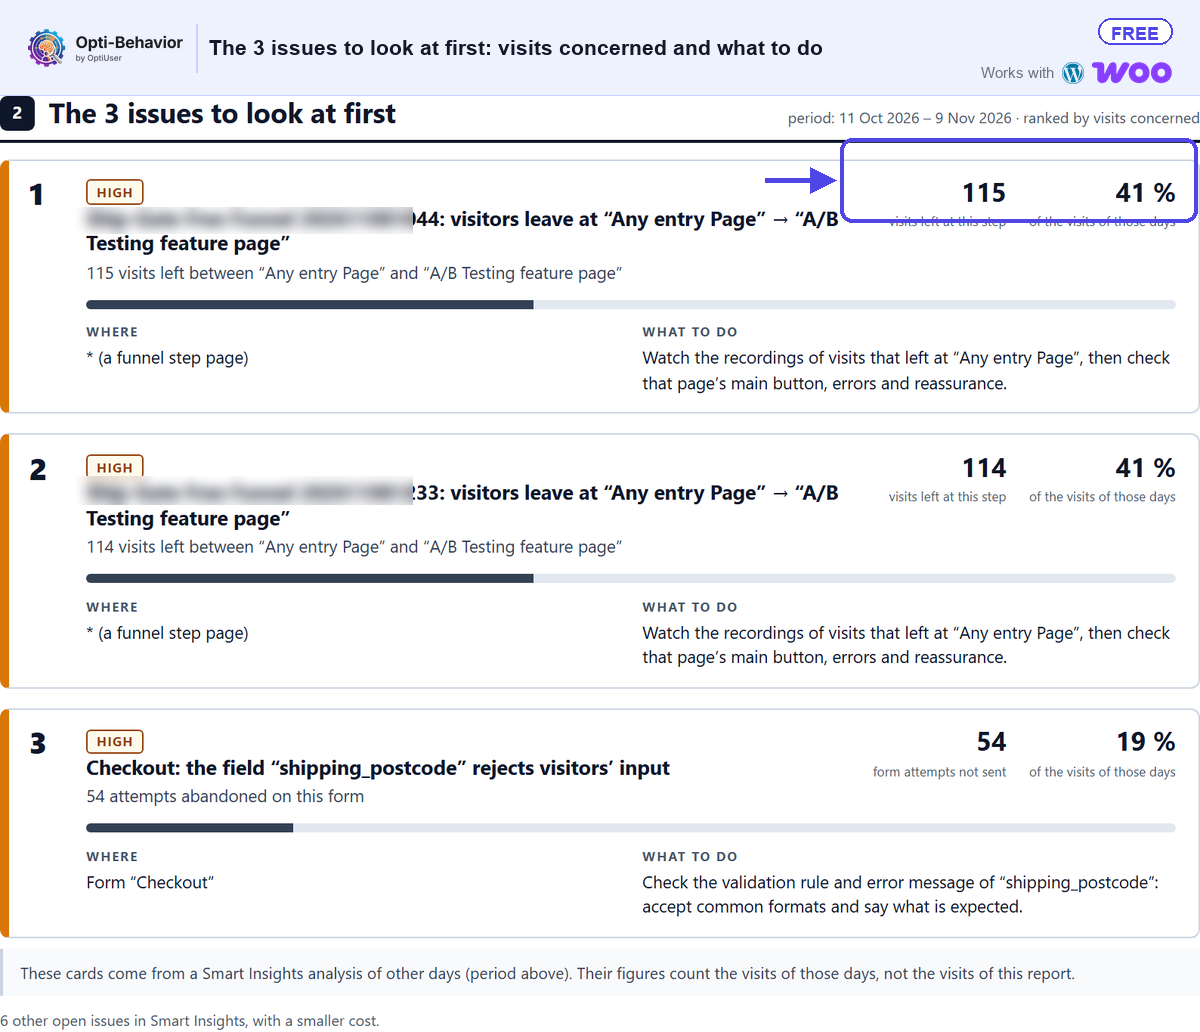
Role: the three problems found by Smart Insights, ranked so that the one touching the most visits comes first, each with a “What to do” line.
How to read it: look at the share of visits each issue concerns (“of all visits”, or “of the visits of those days” when the issue was seen on fewer days). In our example, issue n°1 is a funnel step: 115 visits left between “Any entry Page” and “A/B Testing feature page”, 41 % of the visits of those days. Issue n°3 is a checkout field, “shipping_postcode”: 54 form attempts not sent.
Common mistake: acting on a figure measured on a handful of visits. In 1.11.0 the report no longer shows such a figure as a result: it says which threshold is missed.
Action: take issue n°1 only. Write the fix and its date. Leave issues 2 and 3 for the next report.
6. Shop and carts without an order (Free, WooCommerce)
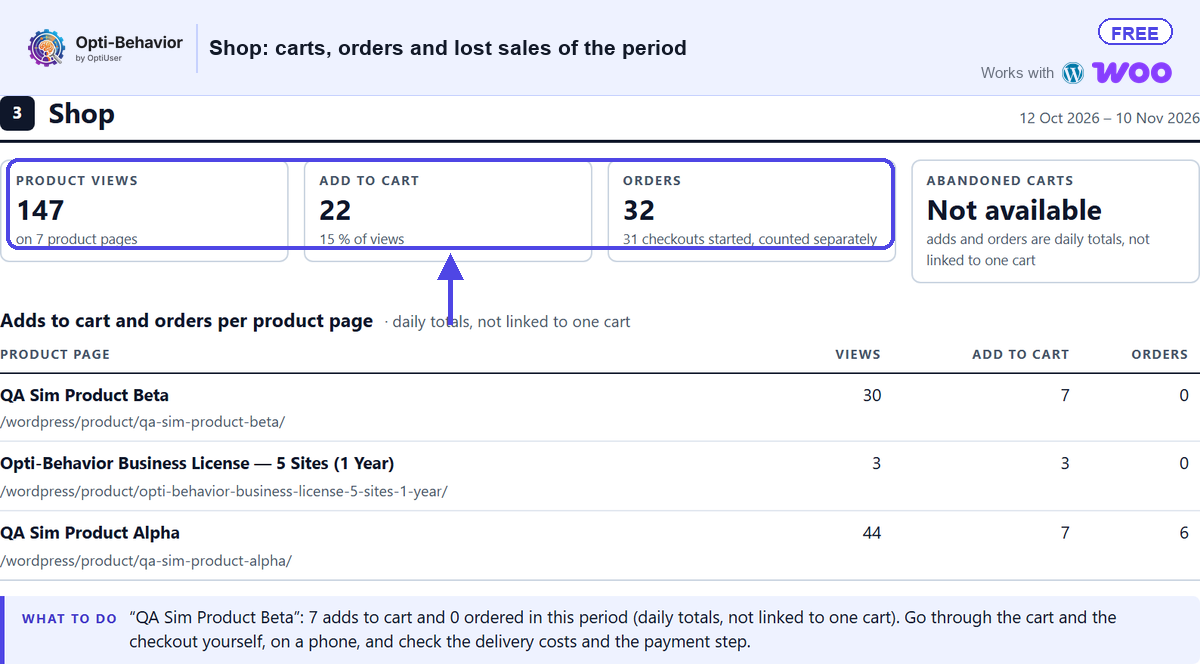
Role: on a WooCommerce site, the shop counters of the period and the products whose carts end without an order.
How to read it: start with the product that has adds to cart but no order. In our example: 147 product views on 7 product pages, 22 adds to cart and 32 orders; “QA Sim Product Beta” got 7 adds to cart and 0 orders. The Abandoned carts tile says “Not available”: adds and orders are daily totals, not linked to one cart. Adds to cart can come from any page (category, home), so the report says “added from any page” instead of a share above 100 %.
Common mistake: blaming the product page when the loss happens later, at checkout.
Action: for the first product, check shipping costs, the payment step and the checkout on a phone. The full report (Pro) adds the Estimated lost sales, an indicative range, for the products that lose the most.
7. Forms with problems (Pro)
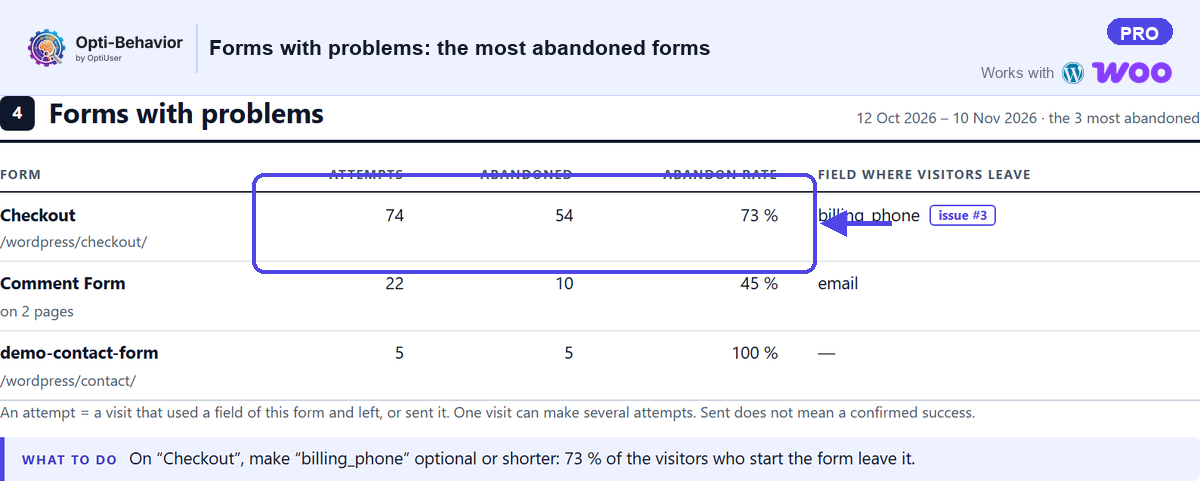
Role: the 3 most abandoned forms and the field where visitors leave. In Free, the report shows one line saying this block is available with Pro.
How to read it: read the field, not only the form. In our example, the Checkout form: 74 attempts, 54 abandoned (73 %), and visitors leave at the field “billing_phone”. Issue n°3 above names another field of the same checkout, “shipping_postcode”, which rejects what visitors type: the two lines point to the same form. When few visitors left the form, the report says “weak signal”.
Common mistake: removing a field because it “loses” visitors. The advice never suggests removing an essential field such as a login or a password.
Action: watch a few recordings of that form before you change it.
8. Clicks and errors (Free + Pro lines)
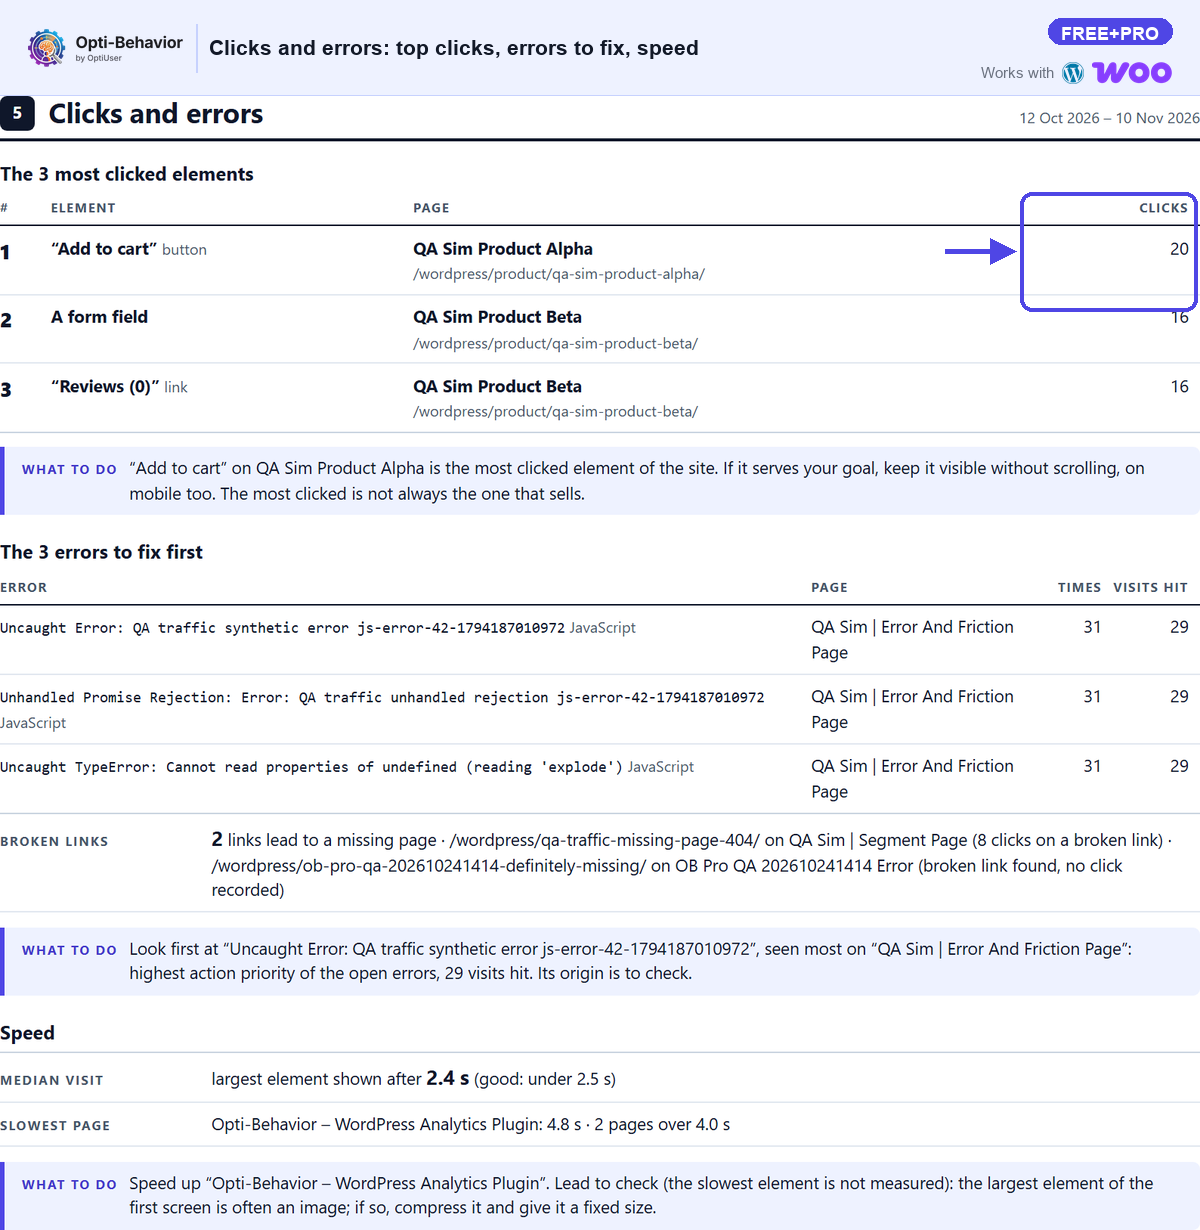
Role: the 3 most clicked elements of the site (Free), plus, with Pro, JavaScript errors and broken links in the same order as the Errors Tracking screen.
How to read it: is the most clicked element the action you want? In our example, the most clicked element is the “Add to cart” button of “QA Sim Product Alpha”, 20 clicks. The first error to fix was seen 31 times, on 29 visits. On the error lines, a group seen on few visits carries a low-priority badge.
Common mistake: fixing the error with the scariest name instead of the one seen on the most visits.
Action: if the top click is not your main button, open the heatmap of that page. If a checkout error is listed, fix it first.
9. Traffic (Free)
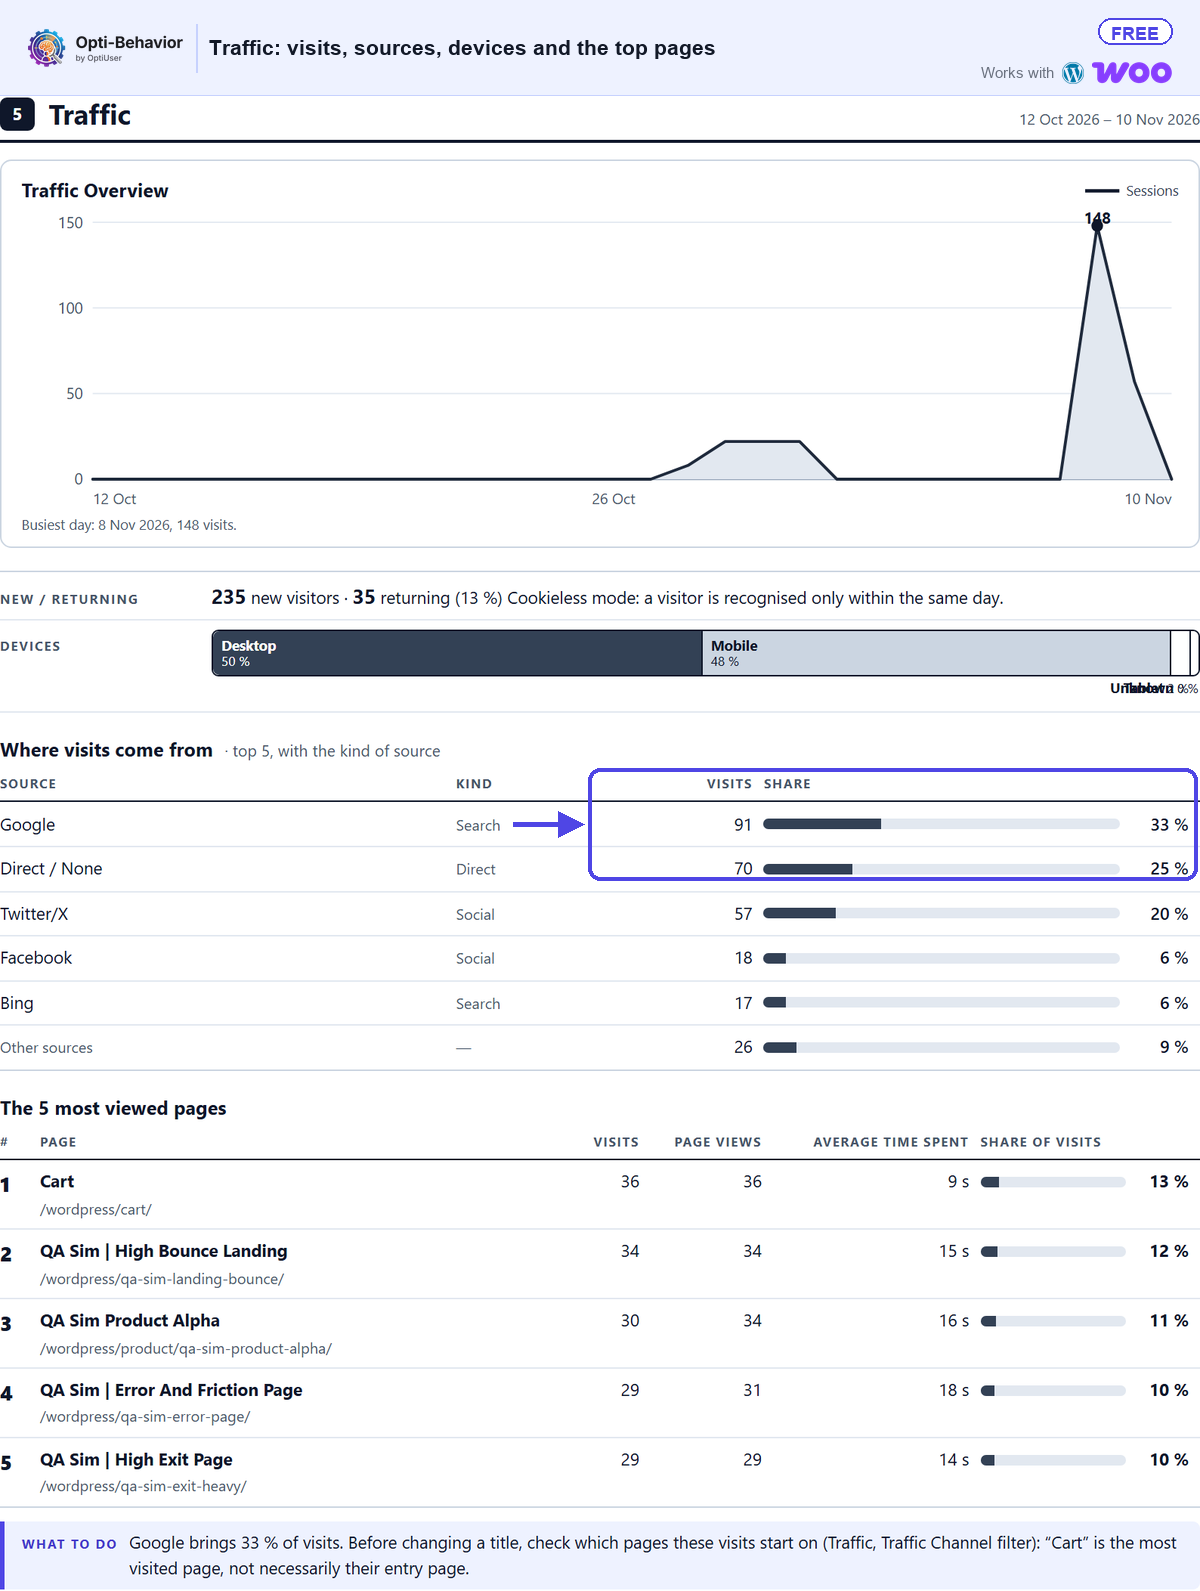
Role: visits per day, sources, devices, new versus returning visitors and the 5 most viewed pages.
How to read it: the curve names the busiest day. In our example, the busiest day is 8 Nov 2026 with 148 visits, Google brings 91 visits (33 %), and “Cart” is the most viewed page with 36 visits. Then look at the top pages: the page with the most views is often your real home page, not “/”.
Common mistake: celebrating a peak without checking its source. A single referral or a bot burst can make one day.
Action: make sure the most viewed page leads to your goal, with one clear next step.
10. AI robots and visitors sent by AI assistants (Free)
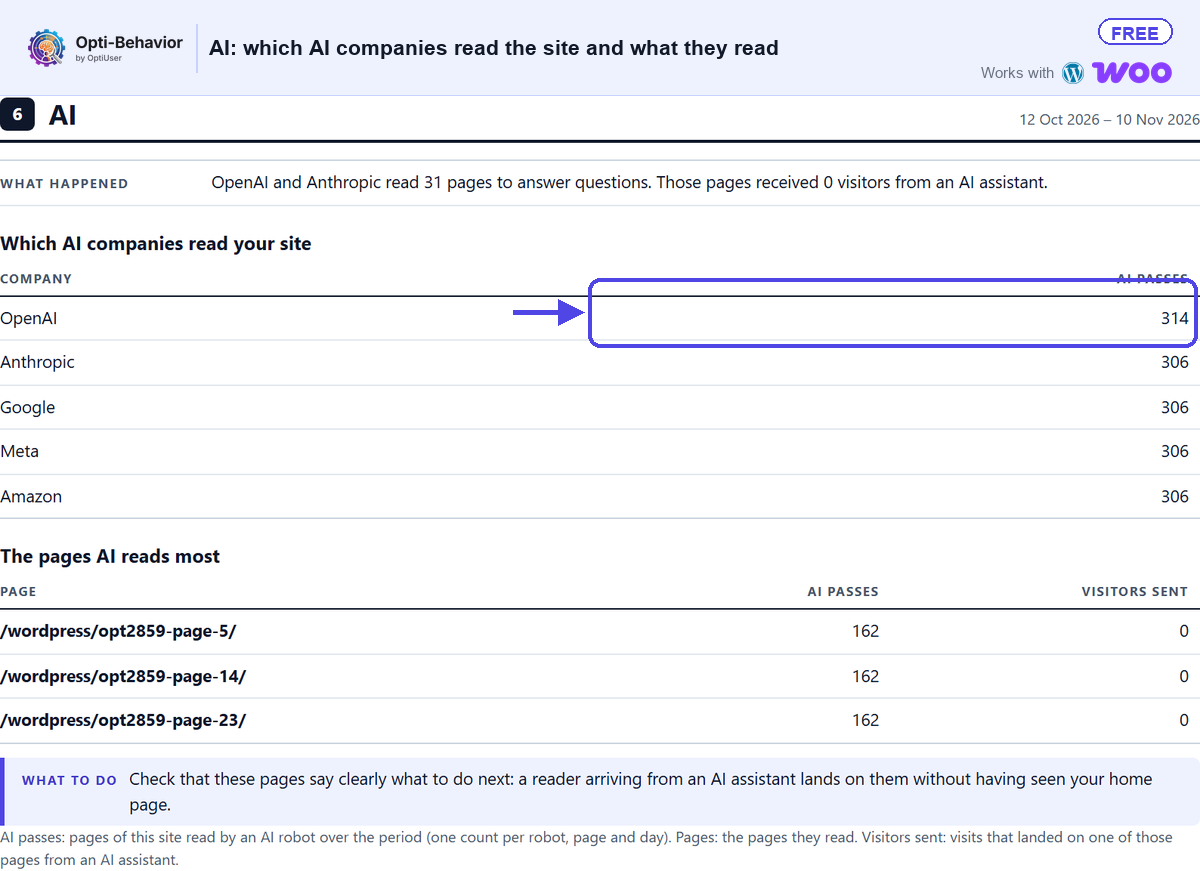
Role: which AI robots read your pages (one count per robot, page and day, called “AI passes”), which pages, and how many visits landed on those pages from an AI assistant.
How to read it: compare “AI passes” with “Visitors sent” on the same page. In our example, OpenAI and Anthropic read 31 pages to answer questions, and those pages received 0 visitors from an AI assistant (OpenAI alone: 314 AI passes).
Common mistake: reading “AI passes” as visitors. A robot reading a page is not a person on your site.
Action: the plugin’s advice: check that these pages say clearly what to do next, because a reader sent by an AI assistant lands on them without seeing your home page.
11. Journeys and funnels (Free)
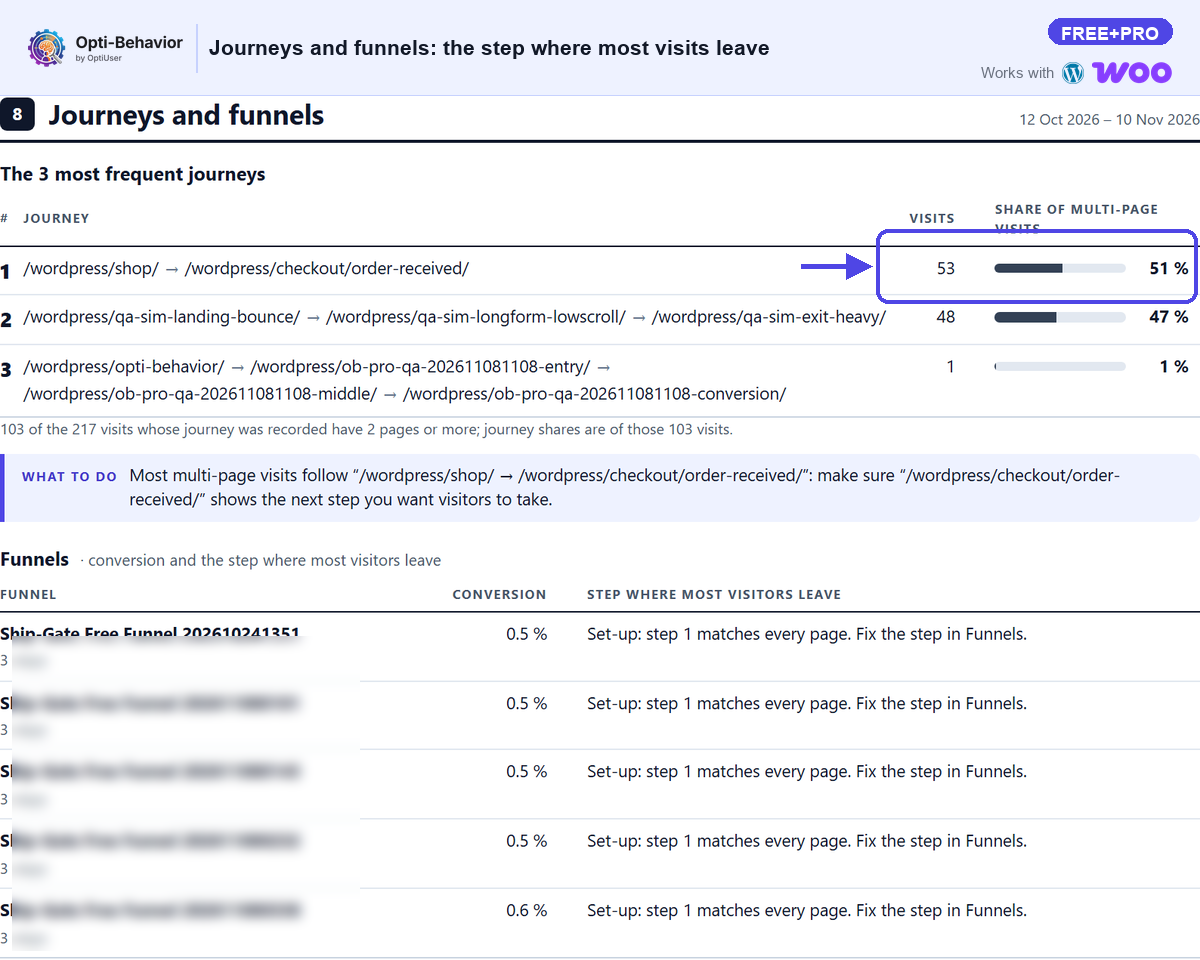
Role: your funnels with the visits at each step, and one funnel recommendation that follows the goal of the page. With Pro, the 3 most frequent journeys of your visitors.
How to read it: find the step with the most “visits left at this step”. In our example, the most frequent journey is /shop/ → /checkout/order-received/, 53 visits (51 % of multi-page visits). The funnels show 0.5 % conversion and the line “Set-up: step 1 matches every page. Fix the step in Funnels.”: the report tells you the funnel itself is badly set before you blame the page.
Common mistake: calling every visit that left a lost customer. Many were never going to buy; the report says “left at this step”, not “lost”.
Action: open the page of that step and watch what visitors see there, on a phone first.
12. Busiest time (Free)
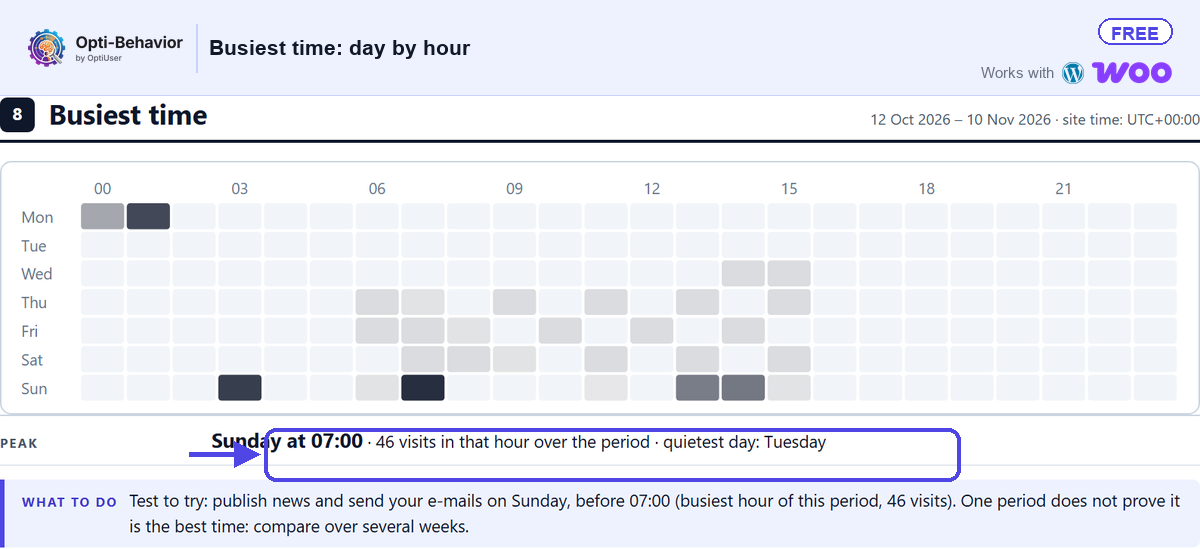
Role: a day × hour grid of visits over the period.
How to read it: the darkest cell is the busiest hour. In our example: Sunday at 07:00, 46 visits in that hour over the period; the quietest day is Tuesday. The report only advises a time to publish when that hour has enough visits.
Common mistake: treating one period as proof. The plugin says it itself: compare over several weeks.
Action: test publishing and sending e-mails just before that hour, and avoid deploying site changes during it.
13. A/B tests (Free)
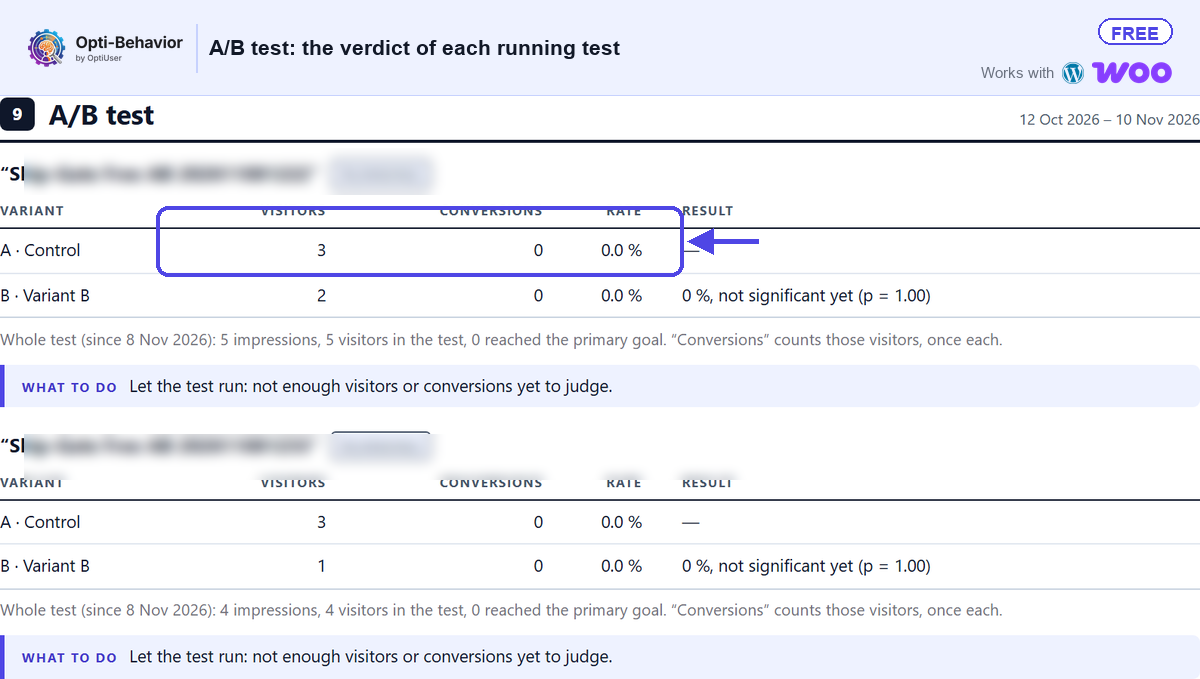
Role: each test of the period with its participants, conversions and a verdict.
How to read it: the verdict is one of: winner, loser, too few visitors or conversions to judge, or “check the goal” when the primary goal records nothing while other goals convert. In our example, two tests with 5 and 4 visitors and 0 conversions get the verdict “Let the test run: not enough visitors or conversions yet to judge.”
Common mistake: applying a variant that “looks better” before the report gives a verdict.
Action: no verdict means keep the original or run the test longer. “Check the goal” means fix the tracking first (A/B Testing › the test › Goals).
14. Signals by module (Free, Pro lines tagged)
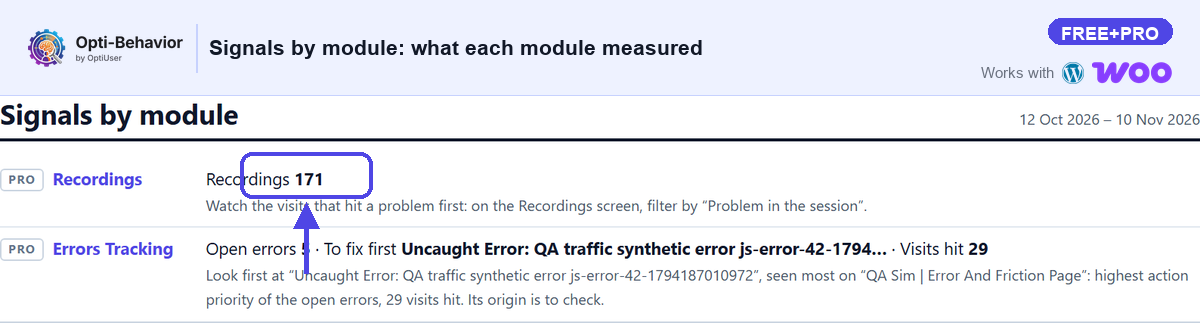
Role: the same signal blocks as the report e-mail (Recordings, User Journeys, Errors) for the days of the report, when no section above already shows them.
How to read it: each line points to a screen. Pro lines carry a Pro tag. In our example: 171 recordings (Pro), and in Errors Tracking the first error to fix, seen on 29 visits.
Common mistake: counting the same problem twice when it also appears in the 3 issues.
Action: use it as a to-do list of screens to open, after issue n°1.
15. One card per page (Pro)
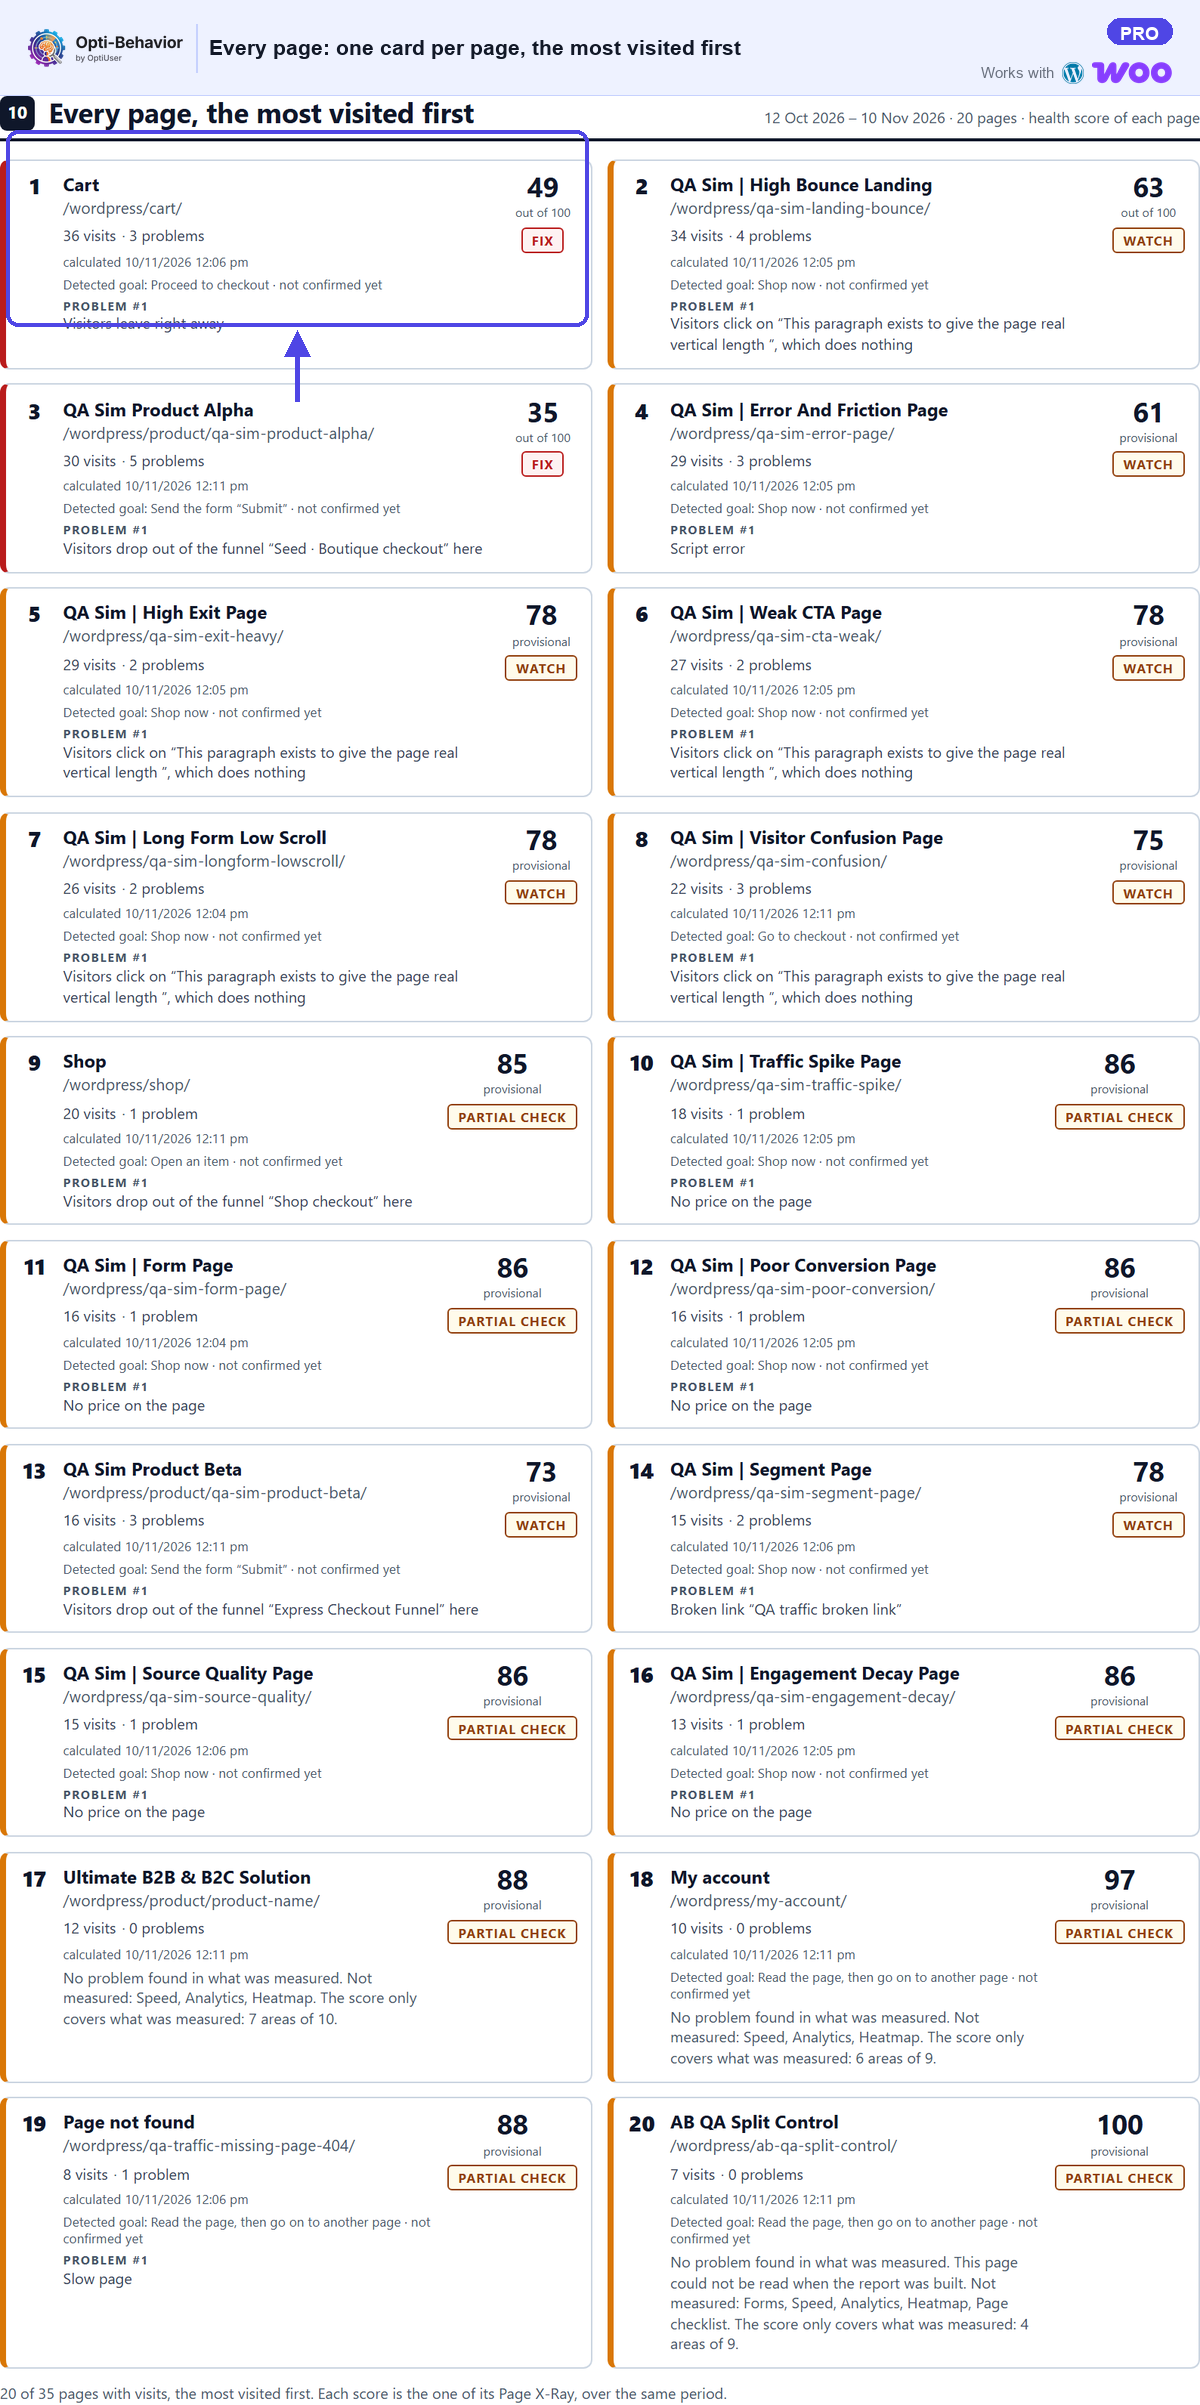
Role: “Every page, the most visited first”: one card per page with its health score, its visits and its first problem.
How to read it: start with a page that has many visits and a low score. In our example, 20 cards: “Cart” comes first with 36 visits, 3 problems and a score of 49 out of 100, and its problem n°1 is “Visitors leave right away”. A page not measured yet shows a dashed score, and the score says how many areas it covers.
Common mistake: fixing the page with the lowest score when it gets almost no visits.
Action: pick one page, then open its appendix.
16. Page X-Ray appendix (Pro)
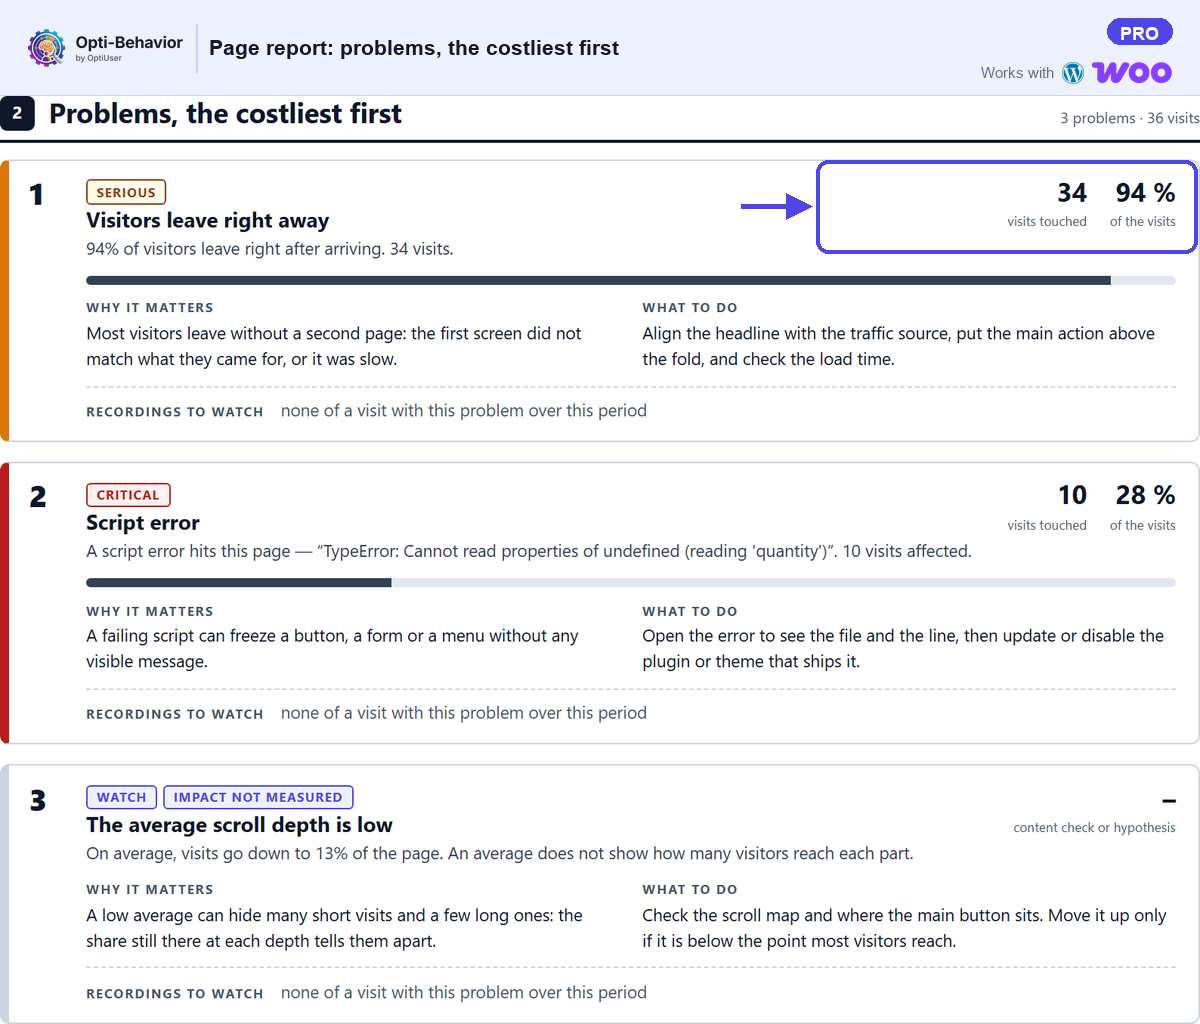
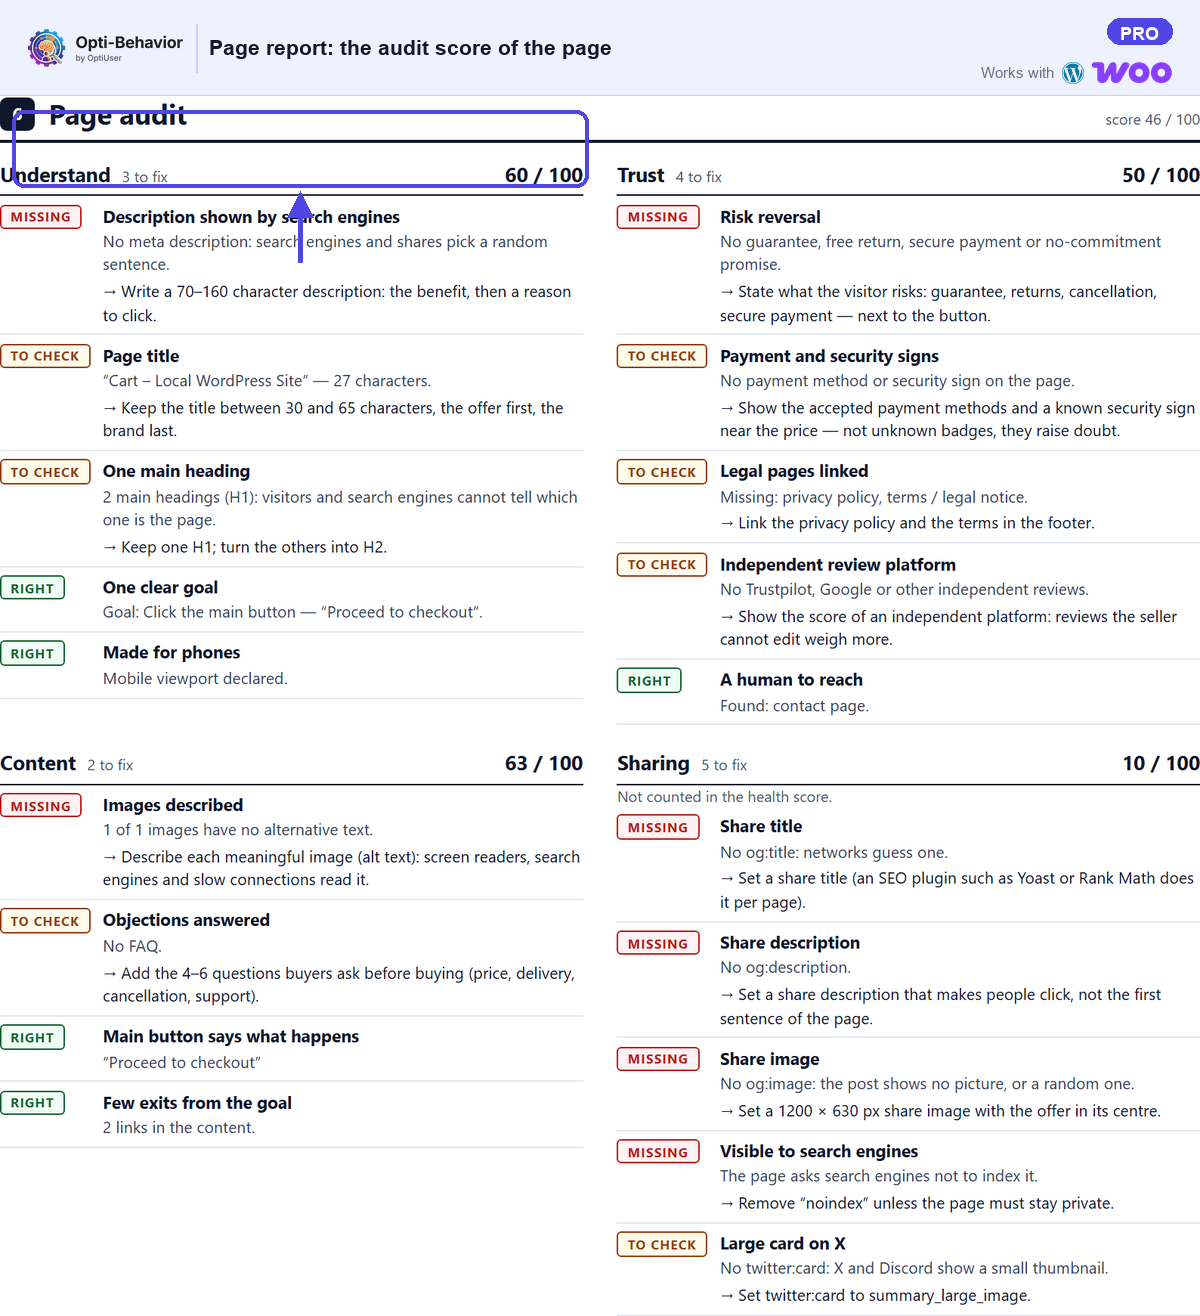
Role: up to 10 page reports in annex, chosen from any page of the site: one page, one score, and the list “What to fix, most costly first”.
How to read it: read problem n°1 and its “why it matters”. In our example, the Cart page report: problem n°1 “Visitors leave right away”, 34 visits touched (94 % of the visits); problem n°2 is a script error on 10 visits. The page audit below lists each fix, such as the missing meta description. The annex says on which base each funnel figure is counted.
Common mistake: trying to fix the whole list in one go. You will not know which change worked.
Action: fix problem n°1, note the date, check the same page in the next report. For a site-wide review beyond one page, see our WordPress UX audit.
17. Print, save as PDF and send the website analytics report to your client
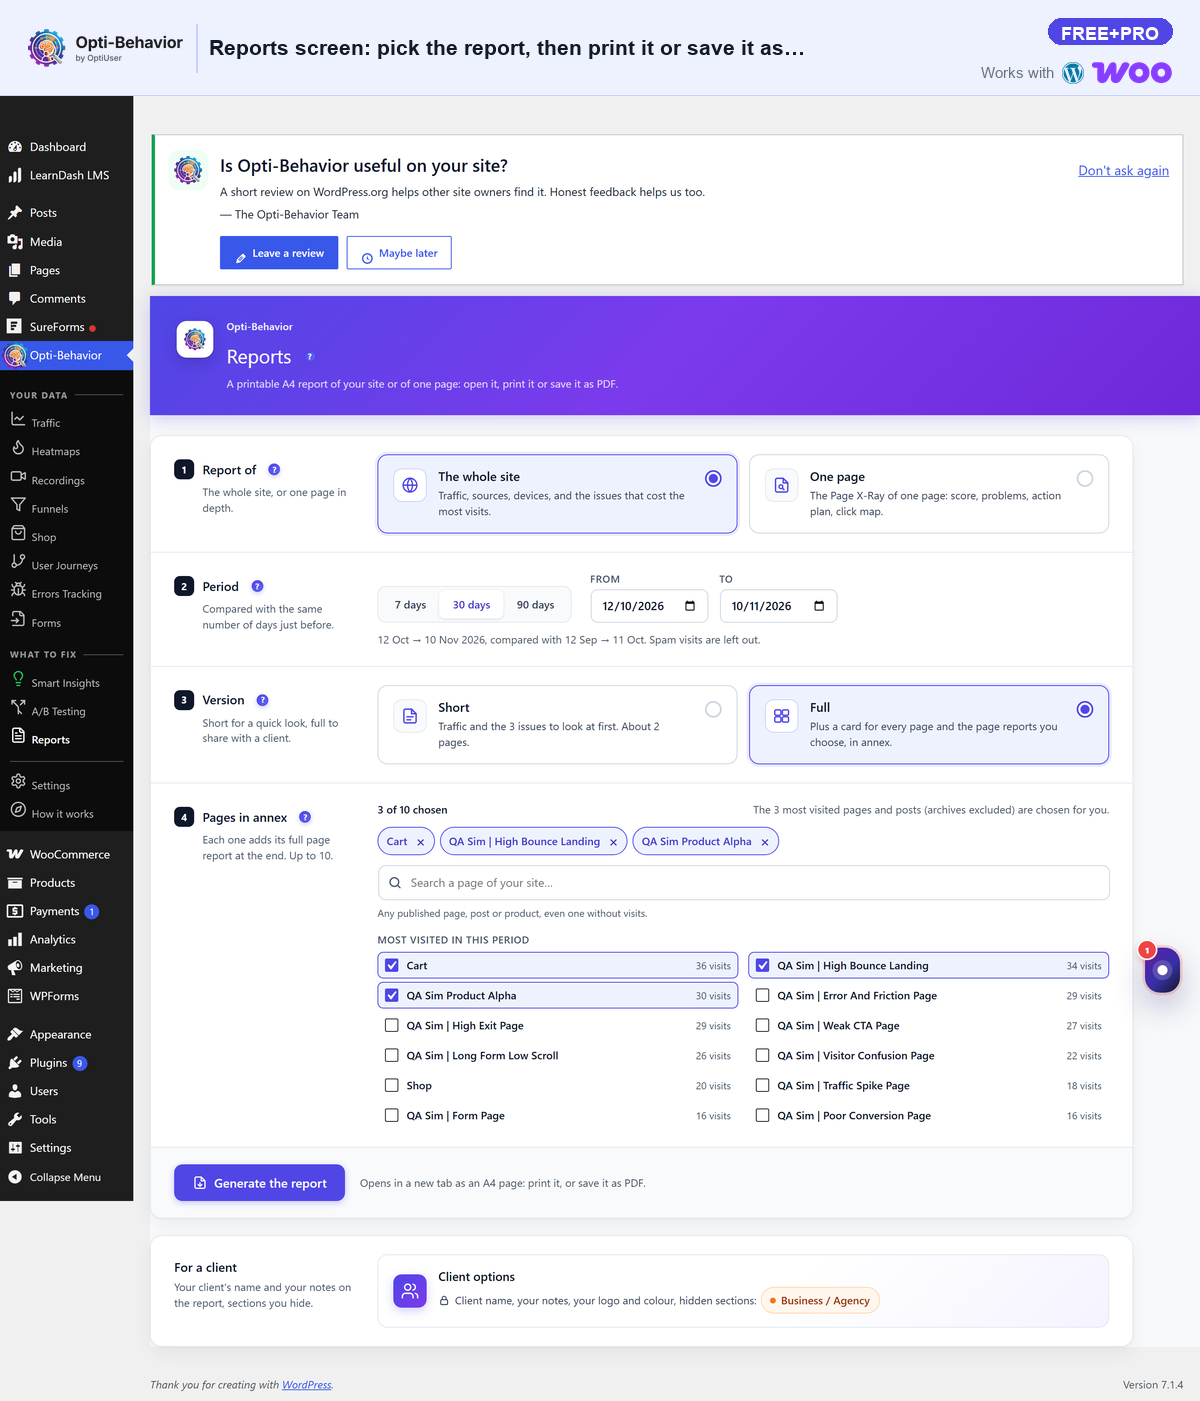
Role: the report is a document you print or save as PDF from Opti-Behavior › Reports.
How to read it: for the full report, the waiting page shows “Page N of M” while page scores are computed, and the document opens only when they are done. A page that could not be measured is named. The 3 most visited pages are chosen for the annex for you; you can pick up to 10.
Common mistake: closing the waiting page too early and sending a partial PDF.
Action: pick the period, generate, check the Contents, then save as PDF. With a Business or Agency licence, add the client name and hide the sections your client does not need.
What is Free, what is Pro
The short site report is in the free plugin: Summary, the 3 issues, Shop, Clicks, Traffic, AI, Journeys and funnels, Busiest time, A/B tests and Signals by module. Pro adds the full version: Contents, Forms, error lines, one card per page and the Page X-Ray appendix. Client name, agency notes and hidden sections need a Business or Agency licence. You can open a report on our demo site first.
Every block in one place: see the Opti-Behavior Reports feature.
Turn your data into a list of fixes
Connect the modules, let Smart Insights analyse your data, and get a report where each problem comes with its page, the visits it touches and what to change.
FAQ
What should a website analytics report include?
The change of the key figures against a comparable period, the few problems that touch the most visits, where each one happens, and one action per problem with a date to check it.
Why is a block missing from my report?
A block with no data on the period is left out, and the numbers of the next blocks follow. Pro blocks are not in the free version, and with a Business or Agency licence you can hide sections. If a Pro module is missing, a notice at the top of the report says which blocks are not included.
Can I send the report to a client?
Yes. Generate it from Opti-Behavior › Reports, save it as PDF and send the file. With a Business or Agency licence you can add the client name and your notes, and hide sections.
How often should I read a website analytics report?
Once per period you can act on: every month for most sites, every week for a busy shop. Always compare with a period of the same length.