In-Page Analytics: What Happened to Google’s Version, and How to Get It Back on WordPress

Short answer: Google’s In-Page Analytics and its Page Analytics Chrome extension belonged to the old Universal Analytics, which stopped collecting data in July 2023. GA4 has no page overlay. To see numbers on top of your real pages again, use a heatmap tool, or a WordPress plugin that shows stats directly on your pages.
Contents
- What was In-Page Analytics?
- Why it disappeared
- Three ways to get in-page analytics back
- Way 1: A click heatmap (in-page analytics, but better)
- Way 2: A stats bar on your own pages
- Way 3: Stats right inside the editor
- In-page analytics vs reports: when to use which
- What we saw on optiuser.com: Search Console vs the stats bar
- Five mistakes when you read in-page numbers
- In-page analytics FAQ
What was In-Page Analytics?
In-Page Analytics was a report in the old Google Analytics. It loaded your page and put a small percentage next to each link: the share of clicks that link received. Later, Google moved it to a Chrome extension called Page Analytics (by Google), which did the same thing while you browsed your own site.
People loved it for three reasons:
- No reports to read. The numbers were right where the content was.
- Quick answers. "Does anyone click the second menu item?" took one second.
- Easy to share. You could show a boss or a client, and they understood at once.
Why it disappeared
It had limits, and then its platform went away:
- It only counted clicks on links. Clicks on images, buttons with JavaScript, or plain text were invisible.
- Two links to the same address shared the same number, so you could not tell a top button from a footer link.
- It did not show scroll, so you never knew if people even saw the lower links.
- It depended on Universal Analytics, which Google shut down for standard accounts in July 2023. The Chrome extension had already stopped being maintained.
GA4 was built differently. It has powerful reports, but no view of your page. It even has a chart type called "heatmap" in Explorations, but that is a colored table, not your page. We explain this in Does Google Analytics have a heatmap?
Three ways to get in-page analytics back
| Way | What you see on the page | Cost |
|---|---|---|
| 1. A click heatmap | Every click as colors, on links, buttons, images and text | Free options exist |
| 2. A stats bar on your live pages | Visits, time, scroll and bounce of the page you are viewing | Free in Opti-Behavior |
| 3. Stats in the editor | The page’s numbers while you edit it | Free in Opti-Behavior |
Let’s look at each one.
Way 1: A click heatmap (in-page analytics, but better)
A click heatmap is the direct heir of In-Page Analytics, with fewer blind spots. Instead of percentages on links only, it paints every click on the page: links, buttons, images, icons, even text people thought was a link.
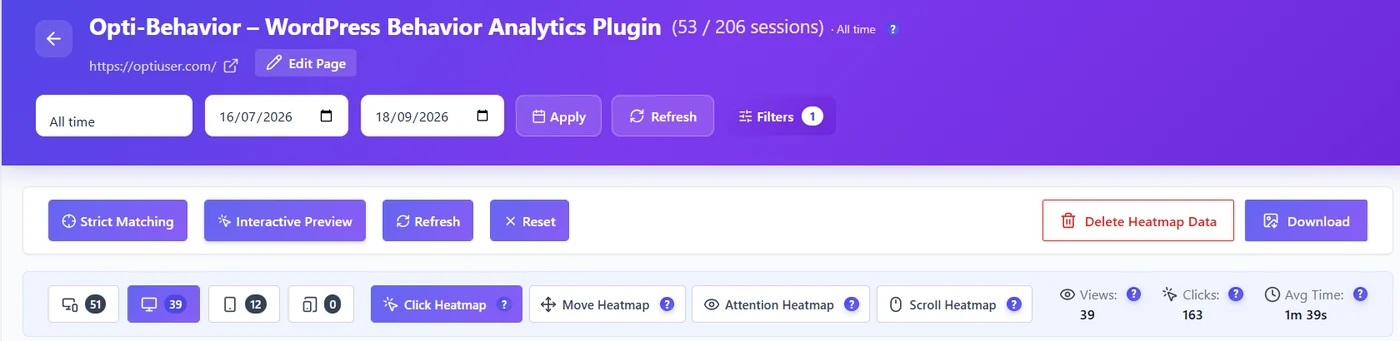
In Opti-Behavior, go to Opti-Behavior > Heatmaps. The list shows every page that received visits, with interactions, sessions and the device split. Open a page to see its heatmap. The click heatmap is free, with no limit on pages. To compare the heatmap plugins available for WordPress, see our WordPress heatmap plugins comparison.
A few details that make the reading accurate:
- Devices. Always check desktop and mobile separately. People tap very differently on a phone.
- Strict Matching (on by default) shows only clicks on elements that still exist on the page. So if you removed a banner last month, its old clicks do not confuse you.
- Filters. Look at the heatmap for new visitors only, for one country, or for one campaign.
- Download. The Download button saves a PNG of the page with the heatmap on top, for the type, device, period and filters you selected. Useful for a weekly email to a client or a partner. It contains no visitor data, only the colors.
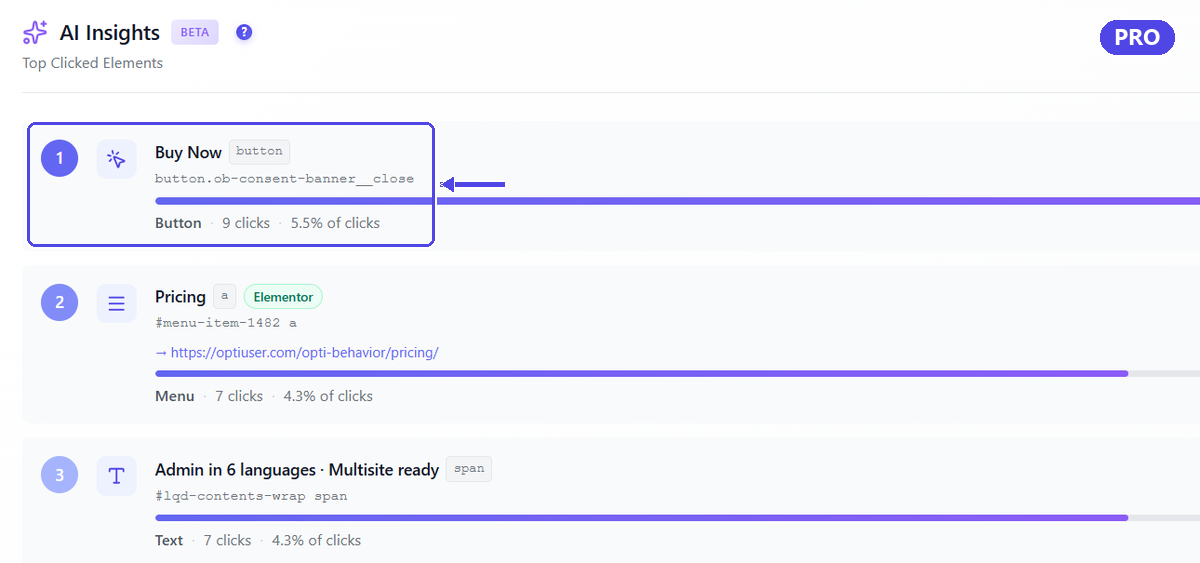
With Pro, you also get the numbers In-Page Analytics users missed most: Top Clicked Elements ranks the exact buttons, links, menu items and images by number of clicks, with their share. You can switch between a simple view and a detailed view with the CSS selector. And hovering a spot shows its click count.
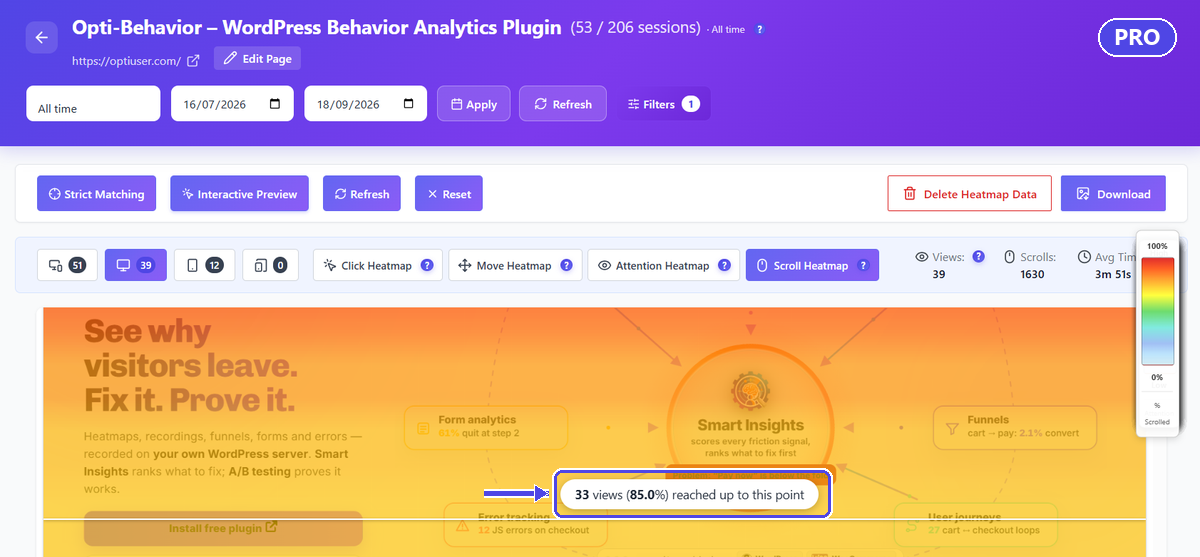
Pro also adds the scroll heatmap, which answers the question In-Page Analytics never could: did people even see that link?
Way 2: A stats bar on your own pages
This is the closest thing to the old Page Analytics Chrome extension. The Frontend Stats Bar puts the key numbers of the page you are viewing in a slim bar at the top of your site. Only administrators see it. Visitors never do.
Turn it on in Opti-Behavior > Settings > Frontend Stats Bar:
- Enable Stats Bar shows it on all front-end pages for administrators.
- Stats Period sets the default period, for example the last 30 days. A period selector in the bar lets you switch quickly.
- Color Theme offers Dark, Light, Blue, Green, Purple or Orange, with a live preview.
- Hide in Page Builders keeps it out of Elementor, Divi, Beaver Builder and other builders while you edit.

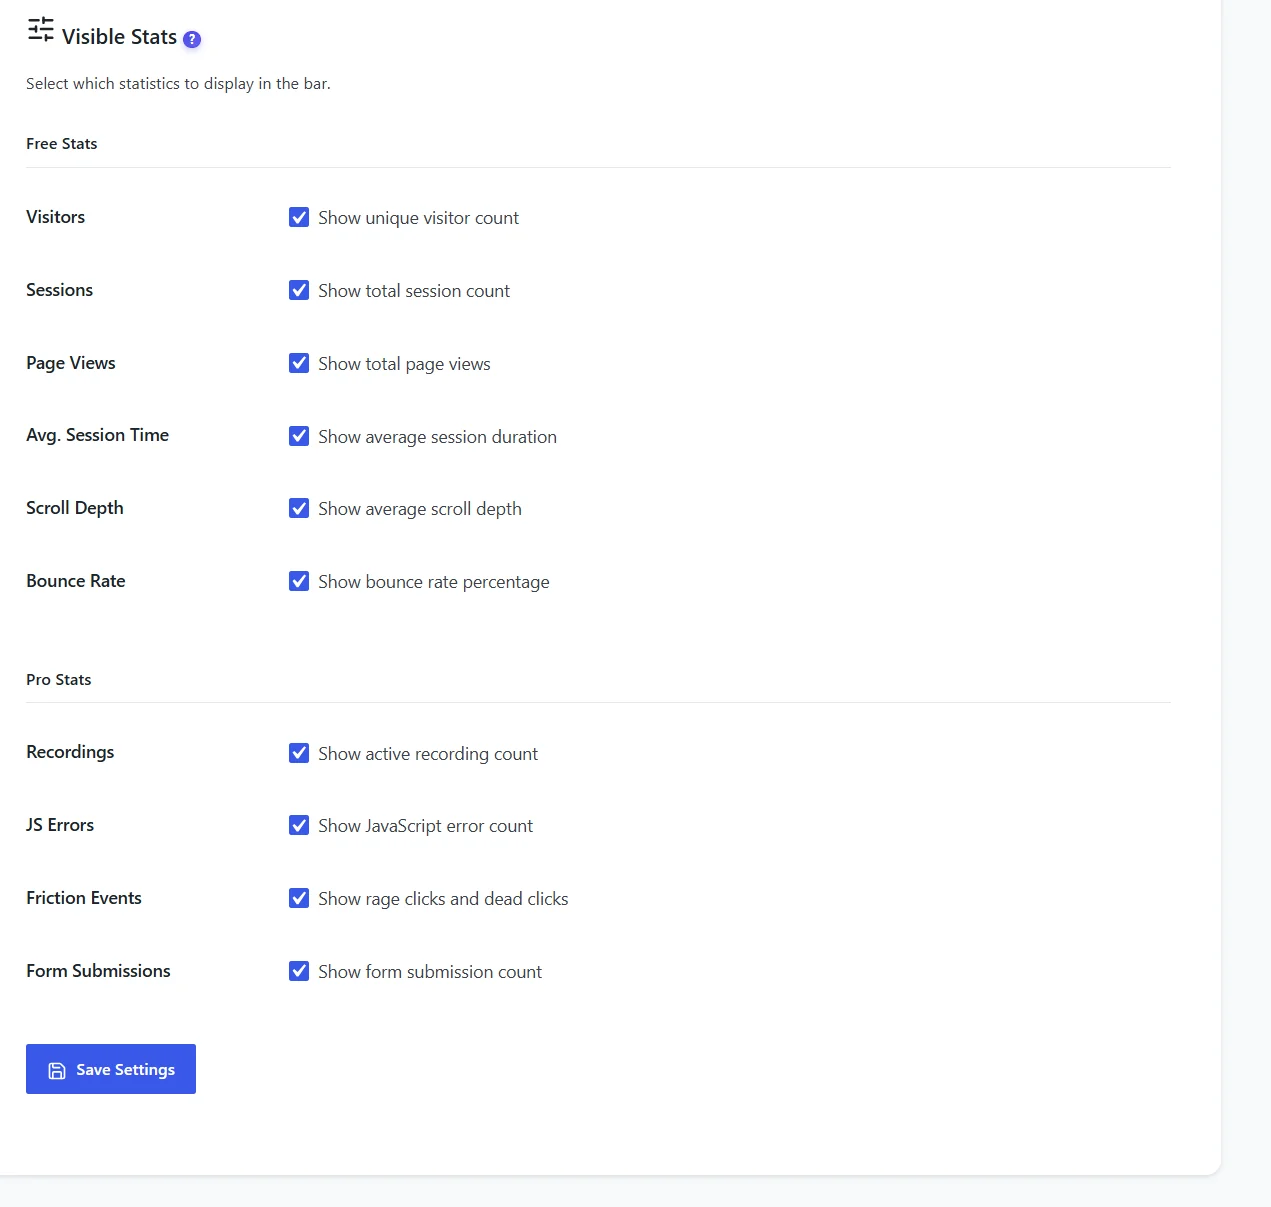
Then choose which numbers appear:
| Free | Pro |
|---|---|
| Unique visitors, sessions, page views | Active recordings |
| Average session time | JavaScript errors |
| Average scroll depth | Friction events (rage and dead clicks) |
| Bounce rate | Form submissions |
Icons in the bar link to the page’s heatmap and recordings, so one click takes you from "this page has a high bounce rate" to "here is what people do on it". The stats load after the page, so the page itself is displayed first. And because it is only added for logged-in administrators, who usually bypass the page cache, it does not affect your cache either.
A simple routine: browse your key pages once a week with the bar on. When a page shows a low average scroll depth, whatever sits low on it (a size table, a shipping note, a review block) is seen by few visitors. Move it up, then compare the next period.
Way 3: Stats right inside the editor
When you edit a published post or page, scroll down to the Post Analytics box (Opti-Behavior logo). It shows the page’s sessions, average time, scroll depth, bounce rate and interactions, new versus returning sessions, where visitors came from, where they went next, and their devices, browsers and countries. You can switch between 24 hours, 7 days, 30 days, 3 months and all time. Buttons open the page’s heatmap and, with Pro, its recordings.
This is in-page analytics for writers: while you improve a page, its numbers are right under your text.
In-page analytics vs reports: when to use which
| Question | Best view |
|---|---|
| Which parts of this page do people use? | Heatmap |
| Is this page doing better or worse this month? | Stats bar or Post Analytics box |
| Which pages across the site need work first? | Reports and Smart Insights |
| Why did this visitor leave? | Session recording (Pro) |
What we saw on optiuser.com: Search Console vs the stats bar
Here is a real case from our own site. In Google Search Console, over the 28 days read on 1 November 2026, our guide WordPress visitor tracking without cookies was shown 170 times for the search "tracking without cookies", at an average position of 24.4, and received 1 click. Our Microsoft Clarity vs Hotjar comparison was shown 44 times for "microsoft clarity vs hotjar", at an average position of 13.1, also for 1 click.
These numbers describe what happens before the visit: Google shows the pages, few people click. They say nothing about what a visitor does once on the page. That second half is what in-page analytics is for, and it is exactly where a search report stops.
The routine to follow for a page like these:
- Open the live page while logged in, with the stats bar on and the period set to the last 30 days.
- Read the average scroll depth and the bounce rate. A low scroll depth on a long guide means the answer sits too far down: move it to the first lines.
- Click the heatmap icon in the bar and check, on desktop and on mobile, whether the table of contents and the internal links get clicks.
- Edit the post and open the Post Analytics box to see where visitors came from and which page they opened next.
- Change one thing, write down the date, and compare the same numbers over the next period.

The search numbers tell you which pages deserve the work: seen often, clicked rarely. The in-page numbers tell you what to change on them.
Five mistakes when you read in-page numbers
- Reading one device only. A link near the top on desktop can sit below the fold on a phone. Check desktop and mobile separately.
- Judging on a few visits. With 20 sessions, one visitor moves the average scroll depth a lot. Use a longer period (30 days or 3 months) before you decide.
- Comparing periods that do not match. Compare 30 days with the 30 days before, not one week with a month.
- Counting yourself. Your own checks add page views. Turn off admin tracking and block your IP in the Opti-Behavior tracking settings before you read the numbers.
- Changing several things at once. If you move the button and rewrite the intro the same day, you will not know which change moved the numbers. One change, one date, one comparison.
Put your stats back on your pages
Opti-Behavior is free on WordPress.org: click heatmaps with no page limit, a stats bar on your live pages, and page stats inside the editor.
In-page analytics FAQ
What is in-page analytics?
In-page analytics shows website statistics directly on top of your real pages, such as the share of clicks each link receives, instead of in separate reports.
Does Google Analytics 4 have In-Page Analytics?
No. In-Page Analytics and the Page Analytics Chrome extension belonged to Universal Analytics, which stopped collecting data in July 2023. GA4 has no overlay on your pages.
What replaced Google’s Page Analytics extension?
Heatmap tools show clicks on top of your page, including clicks on buttons, images and text. On WordPress, Opti-Behavior adds a click heatmap for free, plus a stats bar on your live pages for administrators.
Can visitors see the in-page stats bar?
No. The Opti-Behavior Frontend Stats Bar is shown only to users who can manage the plugin. Visitors never see it.
Does in-page analytics slow down my site?
The Opti-Behavior stats bar is only added for logged-in administrators, and it loads its numbers after the page. Visitors never load it.
The Opti-Behavior Team