
A website UX audit is a structured check of how real visitors use a site: where they click, where they stop, which steps they abandon, and what to fix first. On WordPress you can run one with behavior data you already own, then hand the result to a client or your own team as a short PDF report that lists the problems found and what to do about each one. This guide shows the method step by step, with or without our plugin.
Contents
- What a website UX audit should answer
- Step 1: Collect behavior data before you judge anything
- Step 2: Find the problems and rank them by cost
- Step 3: Turn the findings into a UX audit report
- Step 4: Agree on the fixes, then check the result
- A real audit: optiuser.com, October 2026
- FAQ
- Try it on your own site
What a website UX audit should answer
An audit that ends with “the site could be better” is not useful. A good website UX audit answers four questions, in this order:
- What happened? Traffic, sources, devices and the pages people really visit over a fixed period.
- Where do visitors get stuck? Buttons nobody clicks, pages people leave fast, funnel steps where most of them quit.
- What does it cost? How many visits each problem touches, so the list can be ranked.
- What should we do now? One concrete action per problem, with the page where it happens.
Opinions about colours and fonts come last. Measured behavior comes first, because it tells you which problems are worth your client’s budget.
Step 1: Collect behavior data before you judge anything
Give the audit at least two to four weeks of real visits. Fewer visits means noisy figures: a page with 12 visits does not prove anything. Before you start, make sure that:
- your own visits and your team’s are excluded (admin tracking off, office IP blocked);
- bots and spam visits are filtered out of the figures;
- a page cache does not block the tracking script (see heatmap not working after installing a cache plugin);
- the key paths exist as funnels: product page → cart → checkout, or landing page → form → thank-you page.
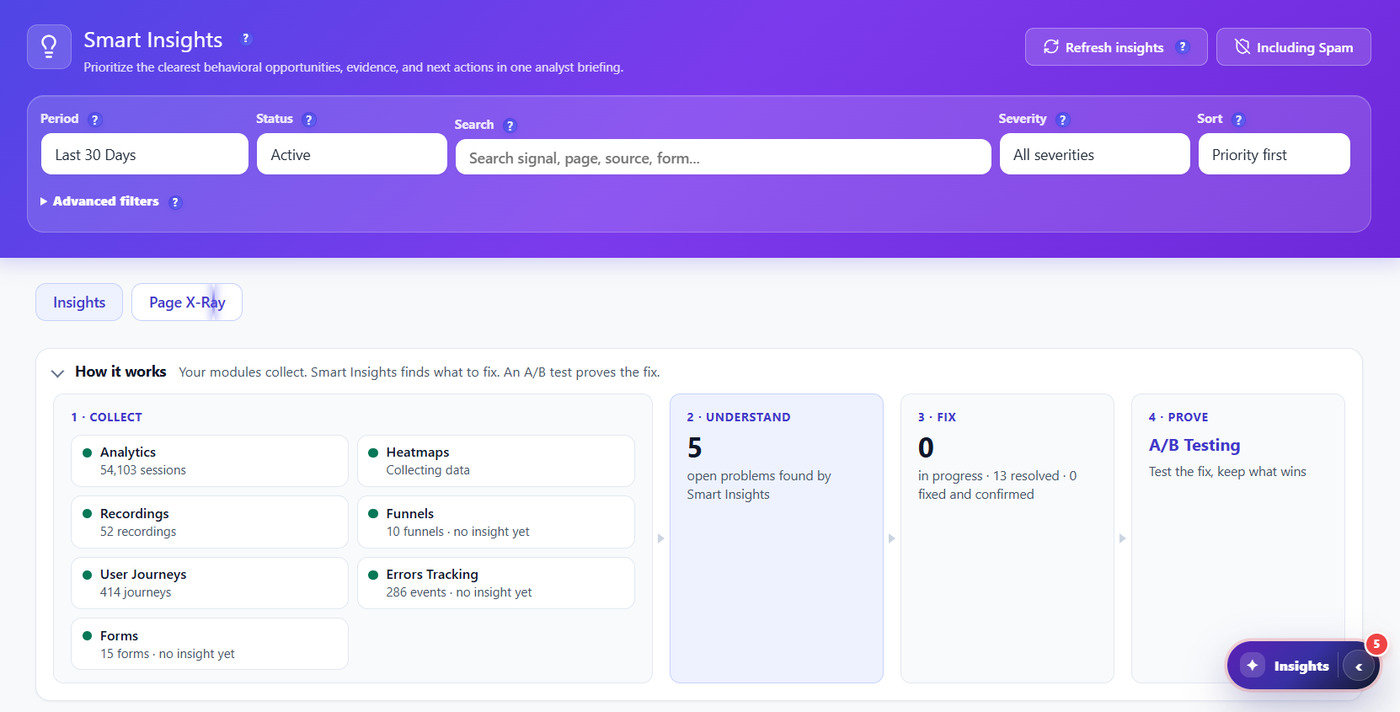
In Opti-Behavior, each module collects one kind of data: Traffic, click heatmaps and funnels in the free plugin; session recordings, user journeys, error tracking and form analytics in Pro. Smart Insights then reads what the modules collected and turns it into a list of open problems.
Step 2: Find the problems and rank them by cost
Go through the data with a fixed checklist, so every audit covers the same ground:
- Pages that lose visitors: high bounce or exit on pages that should lead somewhere (pricing, product, contact).
- Clicks that go nowhere: the click heatmap shows people clicking an image, a heading or a menu label that is not a link. See why a landing page is not converting for the usual causes.
- Funnel drop-off: the step where most visitors quit, and on which device.
- Content nobody reaches: the offer or the call to action sits below the point where most visitors stop scrolling.
- Shop problems on WooCommerce: products viewed a lot but rarely added to cart (see add to cart rate).
Then rank. A broken button on a page with 2,000 visits a month matters more than an ugly footer on a page with 40. Smart Insights does this ranking for you: each open problem comes with the number of visits it touches, the page where it happens and a recommended action.
Step 3: Turn the findings into a UX audit report
Your client will not log in to WordPress to read heatmaps. They need a document. A useful UX audit report is short and always has the same structure:
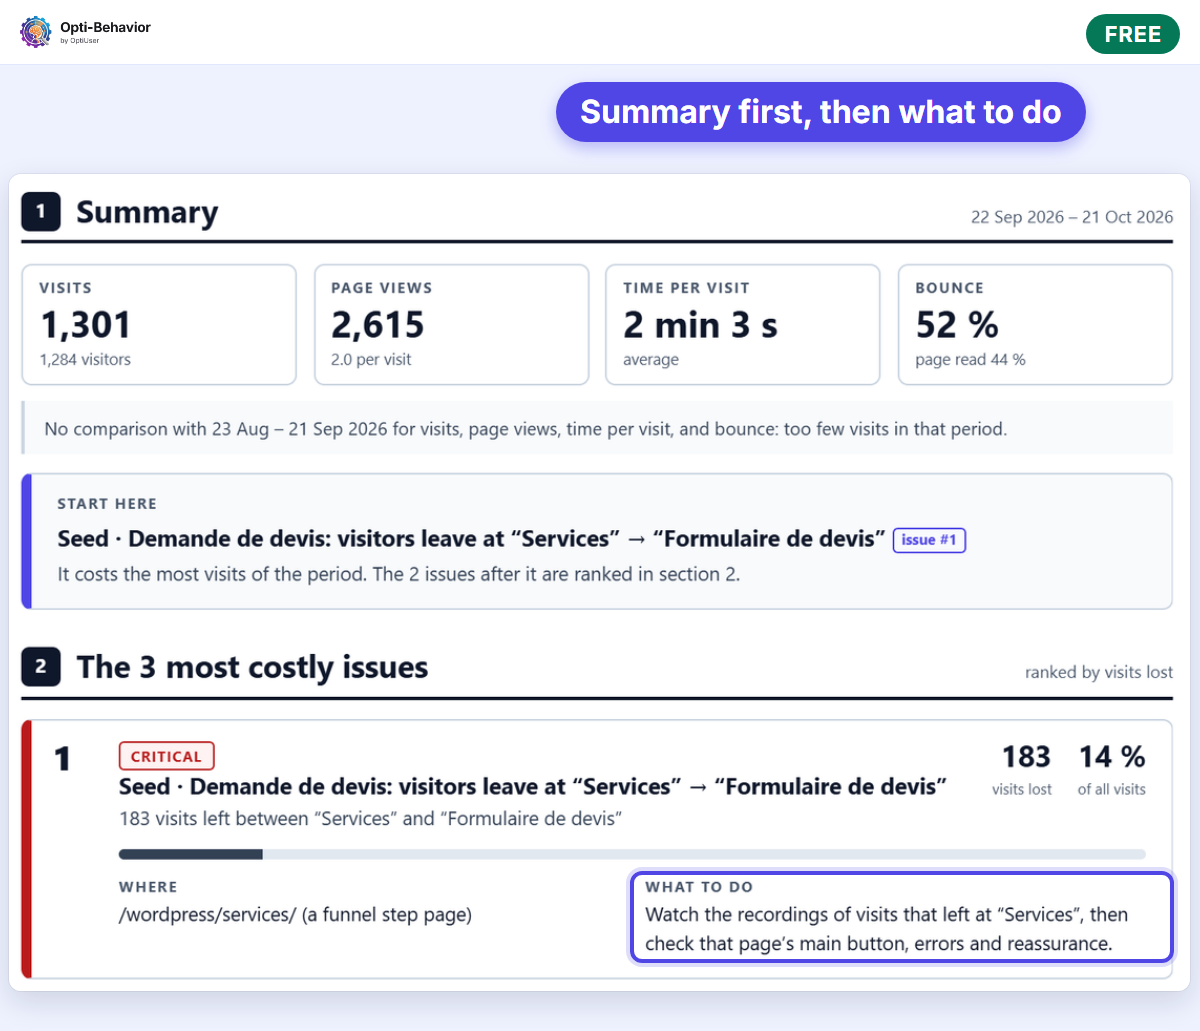
- Summary: the period, key traffic figures compared with the period before, and the three most costly problems.
- One section per area: traffic and sources, most clicked elements, funnels, busiest times, shop, A/B tests.
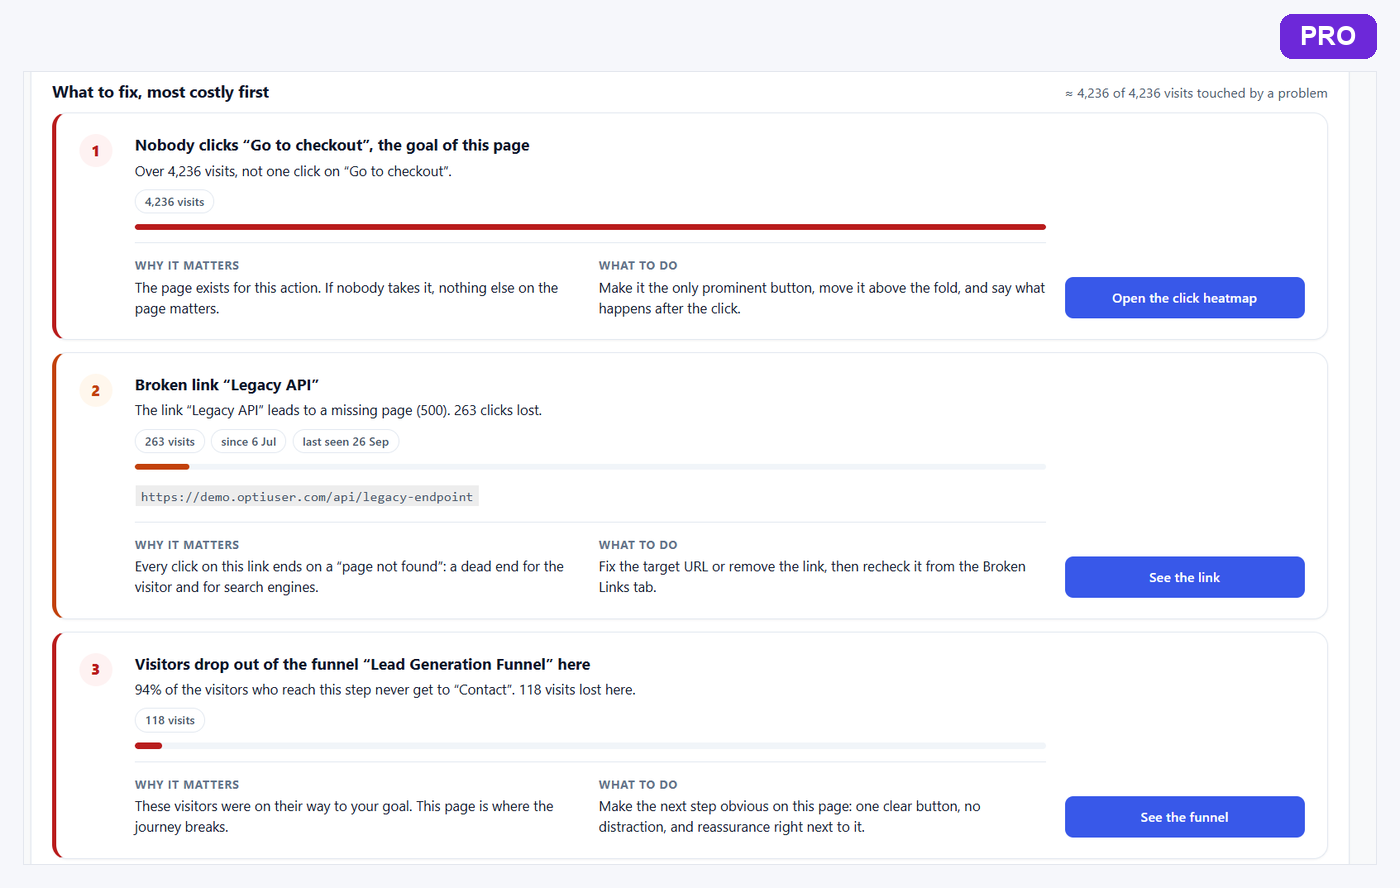
- Each problem as a card: what was found, where, and what to do.
- Appendix: the detail of the most important pages.
Since version 1.10.1, Opti-Behavior builds this report from the same data, in Opti-Behavior › Reports:
- Choose the period (last 7, 30 or 90 days, or two dates). The report compares it with the period before.
- Or click Site report in the header of the Traffic or Smart Insights screen: the report opens with the period you were looking at.
- The report opens in a new tab. Use your browser’s Print › Save as PDF to get the file to send.
- It starts with a Summary (traffic tiles and the three most costly issues, each with Where and What to do), then one section for each part of the site that has data. A section with no data is left out.
Free and Pro versions of the report
- Free: the short site report described above.
- Pro: the full site report, with a card for each of your most visited pages and per-page appendices (up to 10 pages), plus a report for one single page.
- Pro, for agencies: the client’s name on the report (“Prepared for”) and sections you choose to hide from the client.
An optional “Made with Opti-Behavior” line can be added at the end of a report. It is off by default.
Step 4: Agree on the fixes, then check the result
The report is the start of the work, not the end. With your client:
- Pick the two or three problems at the top of the list. Ignore the rest for now.
- Write the fix next to each one: change the button text, make the image a link, shorten the form, move the offer above the fold.
- Note the date of each change.
- Run the same report again over the same length of period after the change, and compare the figures for the pages you touched.
- When a fix is a matter of taste (two headlines, two layouts), test it with an A/B test instead of arguing about it.
Doing the audit again every month with the same report structure gives your client a clear before-and-after, and gives you a reason to talk about the next fixes.
A real audit: optiuser.com, October 2026
Here is the same method applied to our own site. Source: Opti-Behavior Smart Insights on optiuser.com, read on 31 October 2026, period 2 to 31 October 2026, spam traffic excluded. optiuser.com is a small site, so the numbers are small, and each finding says how much it can prove.
Finding 1: phone visitors click our buttons much less
In the button comparison (61 visits), visitors on mobile clicked a button in 49.2% of their visits, against 70.2% on desktop. The gap shows in conversion too: 4.9% for visits from phones, 9.6% for all visitors.
- Where: site pages, on mobile.
- Why it matters: a visitor who never clicks the main button never reaches the next step, whatever the quality of the page.
- What to do: make the main button visible without scrolling on a phone.
- Check: the mobile button click rate and the mobile conversion, 30 days after the change, over a period of the same length.
Finding 2: visitors stop at the URL field of our free heatmap tool
On our free heatmap generator, the field "Your page address" counted 30 visits and 26 field interactions over the period. The plugin’s own verdict on this row is a weak signal: look at recordings first.
- Where: /heatmap-generator/, field "Your page address".
- Why it matters: the tool only helps once a visitor has typed an address. A stop at this field is a stop before any result.
- What to do: watch the recordings (Pro) of the visits that stop at the field before changing anything; then make typing optional with an example page.
- Check: stops at the URL field and visits reaching a heatmap, 30 days after the change.
What this audit teaches
- Split by device first. Our biggest gap was not a page but a device. Looking at all visitors together would have hidden it.
- Write how strong the signal is. On the form row the plugin says the signal is weak. Writing that down stops a team from redesigning a page on a hunch: the next step is to look, not to change.
- Two findings are enough. On a small site, two problems with a clear check are more useful than ten charts nobody acts on.
- No result before the change. The "Check" line is written, the result is not. We will compare the same figures 30 days after each change. An audit that shows an "after" before the fix exists is inventing it.
The same two findings, as rows with an owner, a date and a check, are in our analytics report template. Copy it to write your own UX audit report.
FAQ
How long does a website UX audit take?
The data collection takes two to four weeks of normal traffic. Reading the data and writing the report takes a few hours by hand; with a generated report most of that time goes into choosing the fixes with the client.
Do I need session recordings for a UX audit?
No. Traffic, click heatmaps and funnels already show where visitors get stuck. Recordings (Pro) help you understand why, by watching a few of the visits behind a problem.
Is the PDF white-label?
No. The Pro agency options add your client’s name and hide the sections you choose, but the report still carries the Opti-Behavior footer.
Can I send the report every week automatically?
The site report is printed when you need it. The plugin also has scheduled e-mail reports, which send the key figures and the three most costly issues by e-mail.
What should a UX audit report include?
A summary with the period and the key figures, then one block per problem: where it happens, how many visits it touches, why it matters, what to do and the figure you will check after the fix. Three to five problems, the costliest first.
Try it on your own site
Install the free plugin, wait for a few weeks of visits, then open Opti-Behavior › Reports and print your first site report. To get the full report with per-page appendices, the Page X-Ray report and the agency options, start the Opti-Behavior Pro trial.
The Opti-Behavior Team