
A click heatmap shows every spot where visitors click or tap on a page, painted over the page itself: red where many people click, blue where few do. If visitors come to your site and nobody clicks the button that matters, a click heatmap is the fastest way to see why. It shows what people click instead, and whether they even reach the button.
Short answer: Open the click heatmap of the page, read desktop and mobile apart, and look at your main button. If it is cold, check three causes: it is too low on the page, visitors click things that are not links, or it is too small or misplaced on a phone.
This guide starts from that problem: the goal of the page that nobody clicks. First the diagnosis you can do with any heatmap tool, then how to do it in WordPress with a free click heatmap, and what to check after the fix.
Contents
- Visitors come, but nobody clicks the button
- Why nobody clicks your button: 3 causes a click heatmap reveals
- How to read a click heatmap in 5 minutes
- Click heatmap examples: what to look for on 3 types of pages
- How to get a click heatmap: your options
- A free WordPress heatmap for clicks with Opti-Behavior
- When nobody clicks the goal: Page X-Ray (Pro)
- What to check after the fix
- Click heatmap FAQ
"Visitors come, but nobody clicks the button"
This is the most common complaint we hear from site owners. Analytics says the page gets visits. The contact form, the “Add to cart” button or the newsletter sign-up gets almost nothing. Page views and bounce rate tell you that something is wrong, not what.
A click heatmap answers a different question: what do people try to click on this page? It records clicks on buttons and links, but also on images, headings, icons and text that do nothing. Those unplanned clicks are often the answer.
Why nobody clicks your button: 3 causes a click heatmap reveals
1. The button is below the fold
If the button sits low on the page, many visitors leave before they see it. On the click heatmap, the top of the page is warm, and the area around your button is cold or empty. That is the same pattern you see on a long sales page where the only call to action is at the very end.
Fix: repeat the button near the top, right after the first sentence that explains the offer. Keep the one at the bottom too.
2. Visitors click things that are not links
A product photo, an icon, a bold word, a card with a shadow: people think they can open them. On the heatmap you see clusters of clicks on elements that do nothing, while the real button stays cold. Every click spent on a dead element is a click your button did not get.
Fix: make the clicked element a link to what people expect (the product, the larger image, the article), or make it look less clickable. If the same spot gets many fast repeated clicks, it may be broken or slow. Our guide to rage clicks and dead clicks on WordPress explains how to confirm it.
3. The target is wrong on mobile
A button that works on a laptop can fail on a phone. The layout stacks, the button moves further down, or it becomes too small to tap. Taps then land next to it, on a menu or on nothing at all.
Fix: always read the desktop and mobile heatmaps separately. If the button is warm on desktop and cold on mobile, check its position and the size of its tap area on a real phone.
How to read a click heatmap in 5 minutes
- Pick one page with one goal. A product page (add to cart), a contact page (send the form), a blog post (click the call to action). Write the goal down before you look.
- Wait for enough visits. A map built on a handful of views is noise. Check the number of views shown with the map before you draw conclusions.
- Split desktop and mobile. A tap on a phone and a click on a laptop do not land on the same layout.
- Find your button on the map. Is it warm or cold? Compare it with the hottest area of the page.
- Name the cause. Below the fold, clicks on non-links, or the wrong target on mobile? Pick one change.
Change one thing at a time, note the date, and compare the map over the same number of days afterwards. To keep track of each problem, its fix and its check, use our analytics report template. If you make two changes at once, you will not know which one worked.
Click heatmap examples: what to look for on 3 types of pages
The same map does not mean the same thing on every page. Before you open it, decide what a good pattern looks like for that type of page. Here is what we look for on the three pages most WordPress sites have.
Product page (WooCommerce)
The goal is “Add to cart”. A healthy map shows a warm button and warm product photos, because people open the gallery before they buy. Warning signs: many clicks on the price, the shipping line or the size chart, and a cold button. Those clicks mean visitors look for an answer the page does not give where they expect it. Put the answer next to the button (delivery time, returns, sizes) instead of sending people to another page.
Also look at the variation selectors. If the colour or size buttons are hot but “Add to cart” stays cold, people may pick a variation and then hit an out-of-stock message or an error. If you record sessions, watch a few of those visits to see what they saw.
Contact or quote page
The goal is the submit button of the form. The map often shows warm fields at the top and a cold button. The button is not always the problem: people may stop at one field. Find the last field that still gets clicks; the one after it is often where they quit. Remove it or make it optional, then compare.
Clicks on the phone number or the e-mail address are not a failure. They are contacts too: count them with the form, or the page will look worse than it is.
Blog post
The goal is the call to action, often at the end. On a long post the bottom of the map is usually cold simply because few people read that far. Before you blame the button, check how far visitors scroll. Then look at clicks on the table of contents and on links inside the text: they show which sections people want. If one section gets most of the clicks, put the call to action right after it.
Clicks on screenshots are common in posts. People who click an image want to see it bigger: link it to the full-size file.
One rule for all three
Compare your goal with the hottest element of the page. If the hottest element is not the goal and does not lead to it, you have found where the page loses attention. That is your first change.
How to get a click heatmap: your options
Any heatmap tool that draws click maps can do this work. Pick the one that fits your site.
- Microsoft Clarity is a free cloud tool that draws click heatmaps for any website: you add its script and read the maps in Clarity’s dashboard.
- Hotjar does the same in its own dashboard, with click, move and scroll heatmaps.
- Google Analytics 4 does not draw a click heatmap. With Tag Manager, you can count clicks on the buttons you set up, one by one. Our article on the Google Analytics heatmap shows what is possible.
- A WordPress heatmap plugin records clicks from inside WordPress and shows the map in your admin.
No tool installed yet? Our free website heatmap generator predicts a heatmap of any page from its layout. It is a simulation, not real clicks, but it helps you spot a button that is hard to find.
A free WordPress heatmap for clicks with Opti-Behavior
Opti-Behavior is the WordPress plugin we make. Its click heatmap is in the free version, for desktop and mobile. By default it records heatmaps on posts, pages, WooCommerce products, the home page and the shop page; category, tag and other archive pages are left out. You open a page in the Heatmaps screen, filter by device, and point at a hot area to see how many clicks it received. To install it and check your first map, follow our step-by-step WordPress heatmap guide.
Here is a real click heatmap: our own home page.
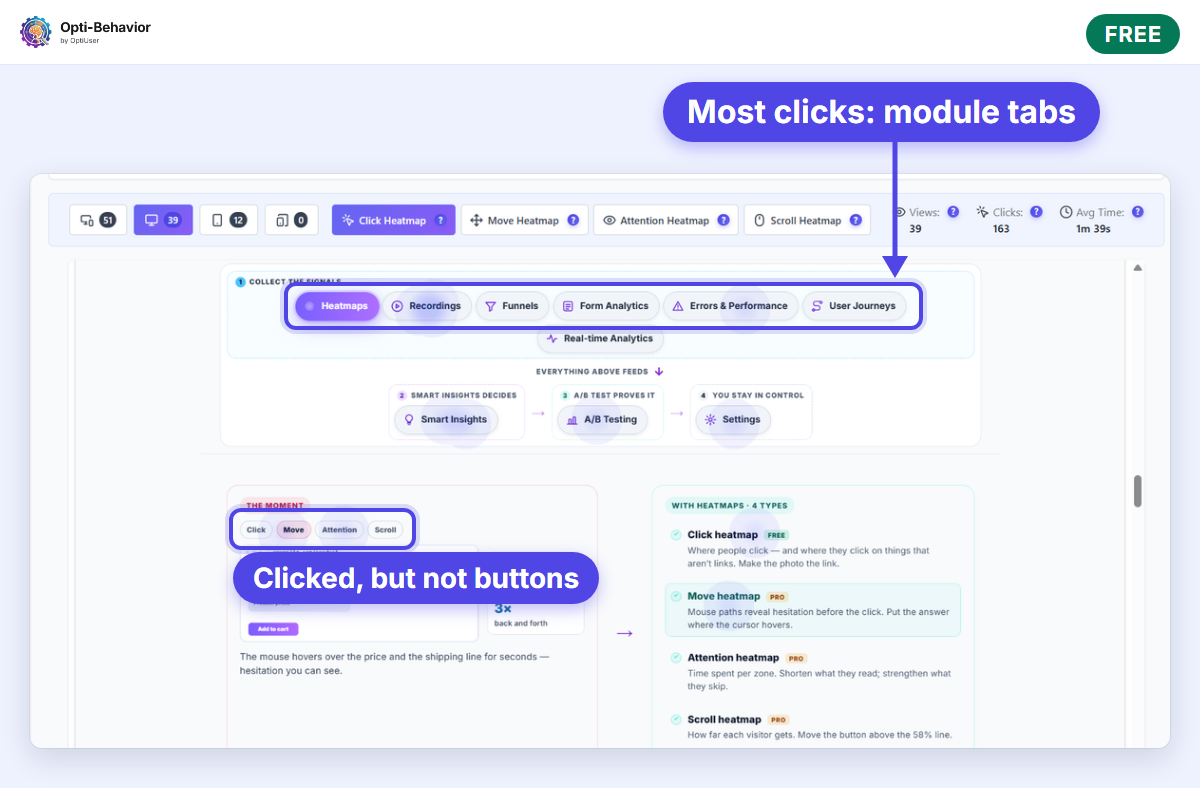
39 desktop views, 163 clicks. Most clicks land on the row of module tabs (Heatmaps, Recordings, Funnels…), which is what that section asks visitors to do. Smaller clusters land on the small Click / Move / Attention labels inside the illustration below the tabs. They are not buttons, but they look like buttons, so people click them: cause 2 of this guide. Our next question is simple: should those labels do something, or look less clickable?
What is Free and what is Pro on this screen:
- Click heatmap (Free): the map itself, per page, desktop and mobile, with views and clicks.
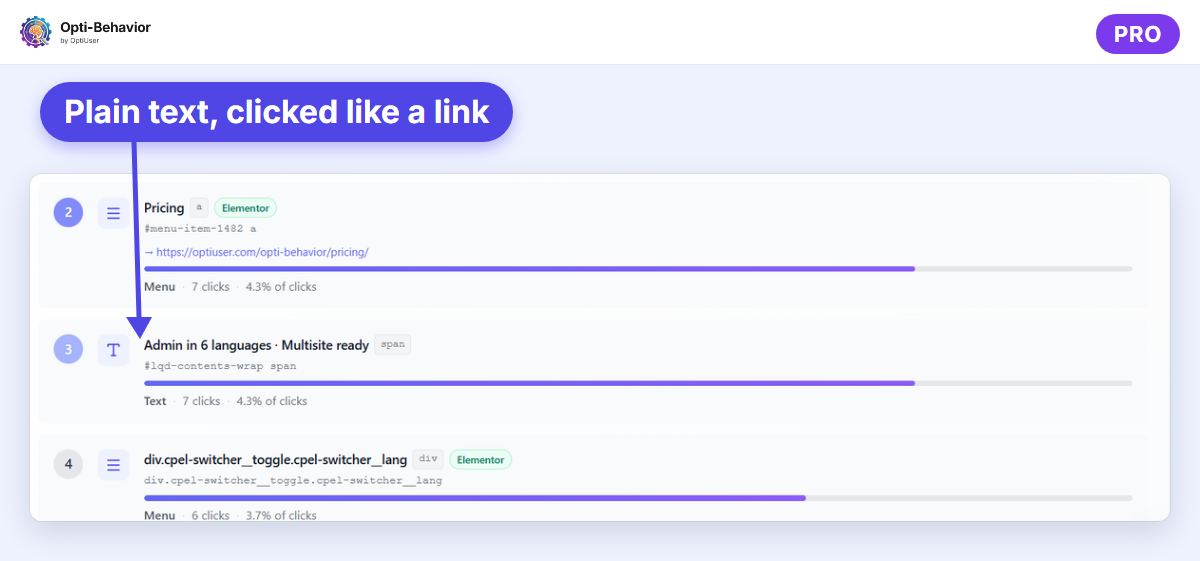
- Most clicked elements (Pro): next to the map, a ranked list of the elements that get the most clicks, with their type (button, menu, text), their clicks and their share of all clicks. You see at once whether your goal is in the list, or whether a menu link or a plain text takes its clicks.
- Scroll, move and attention heatmaps (Pro): the other map types. Our guide to mouse and scroll heatmaps explains what each one shows.
The four heatmap types are described on the heatmaps feature page.
When nobody clicks the goal: Page X-Ray (Pro)
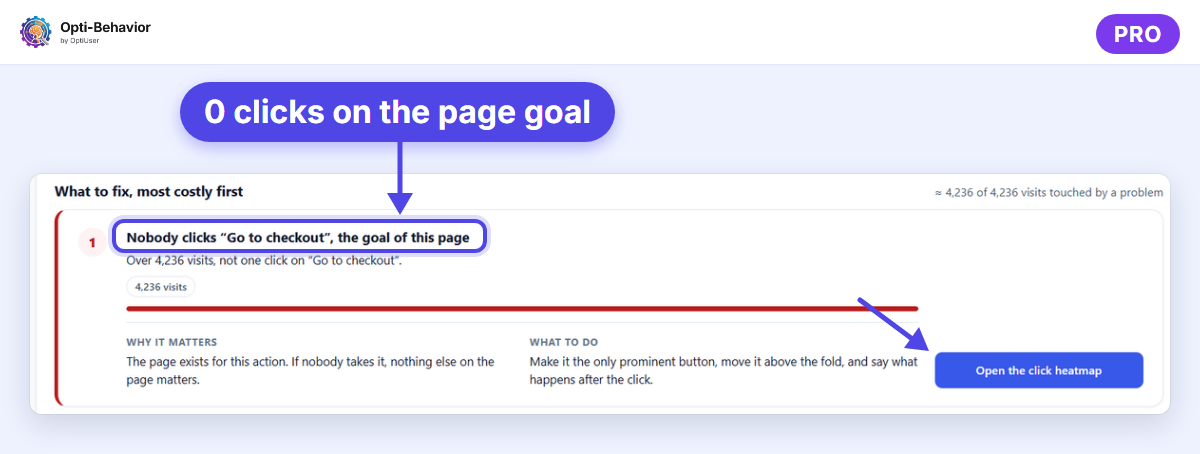
A heatmap shows clicks, but you still have to find the goal on the map and notice that it is cold. Page X-Ray (Pro) does that check for you. It reads each page, works out its main action from the content (a call-to-action button, add to cart, checkout or a download link) and, when the page had visits in the period but not one click on that action, adds it to the problems to fix, ranked by the visits they cost. Each problem says why it matters, what to do, and opens the click heatmap of the page.
See which button nobody clicks
Opti-Behavior is free for WordPress. Its click heatmap shows where visitors click and tap, on desktop and mobile, with the data stored on your own server.
What to check after the fix
- Compare the same page, the same device and the same number of days before and after the change.
- Look at your goal first: is it warmer, and does it get a bigger share of the clicks?
- Check that the clicks on elements that do nothing went down, or moved to the right link.
- Read the mobile map on its own: a fix on desktop can move the button further down on a phone.
- With Pro, open Page X-Ray again: the problem should leave the list once visitors click the goal.
Click heatmap FAQ
What is a click heatmap?
A click heatmap (or click map) is a heatmap that shows where visitors click or tap on a page. Each click is placed on the page and colored by volume. You see which elements get attention, and which elements people try to click even though they are not links.
What is the difference between a click map and a heatmap?
Heatmap is the family name. A click map is one type of heatmap. Scroll, move and attention maps are the others. A click map shows clicks; a scroll map shows how far down people get.
Does Google Analytics have a click heatmap?
No. GA4 counts events, but it does not paint clicks on your page. You need a heatmap tool or a plugin to see a click heatmap.
How many visits do I need before I trust a click heatmap?
There is no fixed number. Wait until the same pattern stays when you compare two periods. If the map changes completely from one week to the next, you do not have enough data yet.
The Opti-Behavior Team