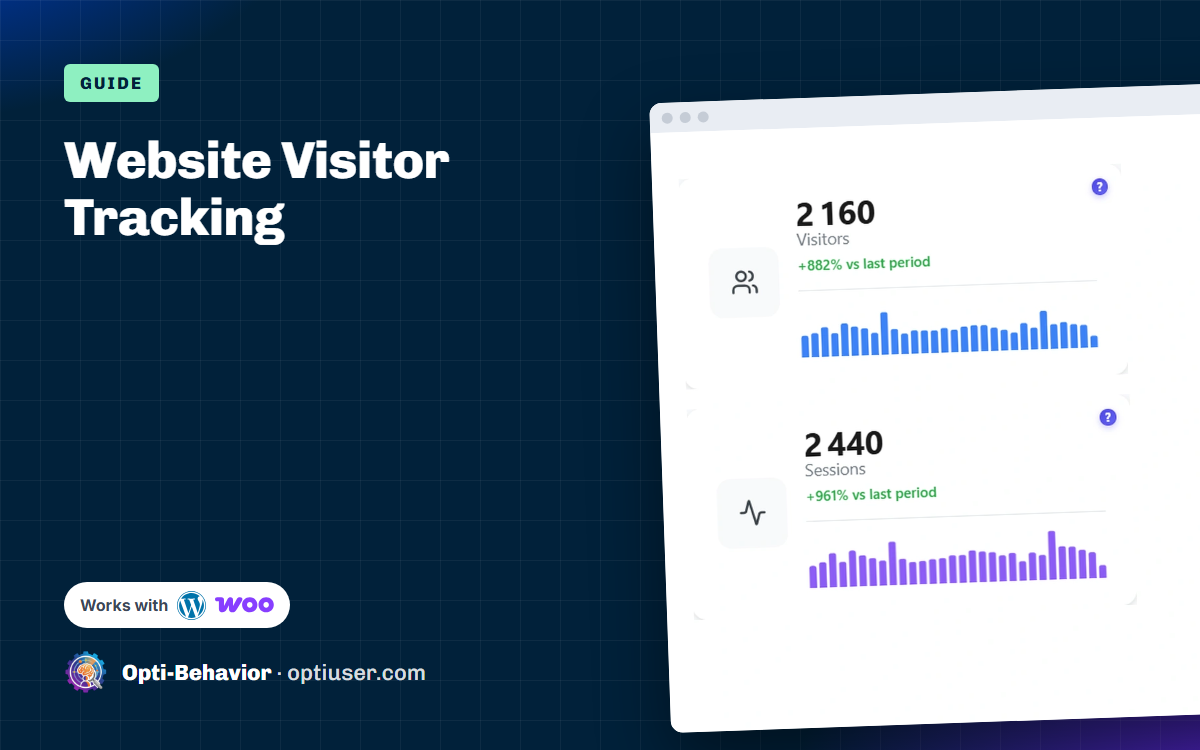

Website visitor tracking means recording how people arrive on your site, which pages they read, what they click and where they leave. On WordPress you can set it up in about ten minutes with a plugin, without pasting code. This guide shows which numbers are worth tracking, how to install it step by step, and how to check that your data is right before you trust it.
One word first: some tools sold as “website visitor tracking” try to name the companies behind your visits (B2B lead identification). This guide is about the other meaning: understanding what visitors do on your pages so you can fix what makes them leave.
Contents
- The problem: traffic you cannot read
- What to track: 6 numbers that answer real questions
- How to set up website visitor tracking on WordPress
- Diagnose: is your visitor tracking data right?
- Website visitor tracking without cookies
- What to check after 7 days
- Reading your first week: a worked example on optiuser.com
- FAQ
The problem: traffic you cannot read
Most site owners see a visitor count and nothing else. The count goes up or down, but it does not say why. Typical signs:
- Visits are stable, but contact forms or orders are falling.
- A page gets traffic from Google, but nobody clicks its main button.
- Mobile visitors leave much faster than desktop visitors, and you do not know where.
- Your numbers include your own visits and bots, so every decision starts from a wrong base.
Each of these costs leads or sales, and a single visitor counter cannot show any of them.
What to track: 6 numbers that answer real questions
Start small. These six numbers answer most questions a WordPress site owner has:
- Visitors and sessions: how many people came, and how many visits they made.
- Top pages: where visitors land and which pages they actually read.
- Traffic sources: search, social, referrals, direct. Tells you which channel is worth your time.
- Devices: desktop, mobile, tablet. A page that works on desktop can be broken on a phone.
- Bounce rate and scroll depth: did visitors read the page or leave at the top?
- Clicks and steps to the goal: what visitors click, and at which step they drop out (cart, checkout, form).
The first five tell you what happens. The sixth starts to tell you why.
How to set up website visitor tracking on WordPress
The steps below use Opti-Behavior, the plugin we build. The free plugin stores the data in your own WordPress database and files, and its default Anonymous mode sets no cookie.
Step 1: install the plugin
In your WordPress admin, go to Plugins > Add New, search for “Opti-Behavior”, click Install Now, then Activate. Tracking starts on its own: there is no code to paste in your theme.
Step 2: exclude your own visits
Open Opti-Behavior > Settings > Traffic & Behavior. Uncheck "Track Admin Users" and add your own IP address in "Block Tracking for IPs". Otherwise your tests and edits are counted as visitors.
Step 3: open the Traffic screen
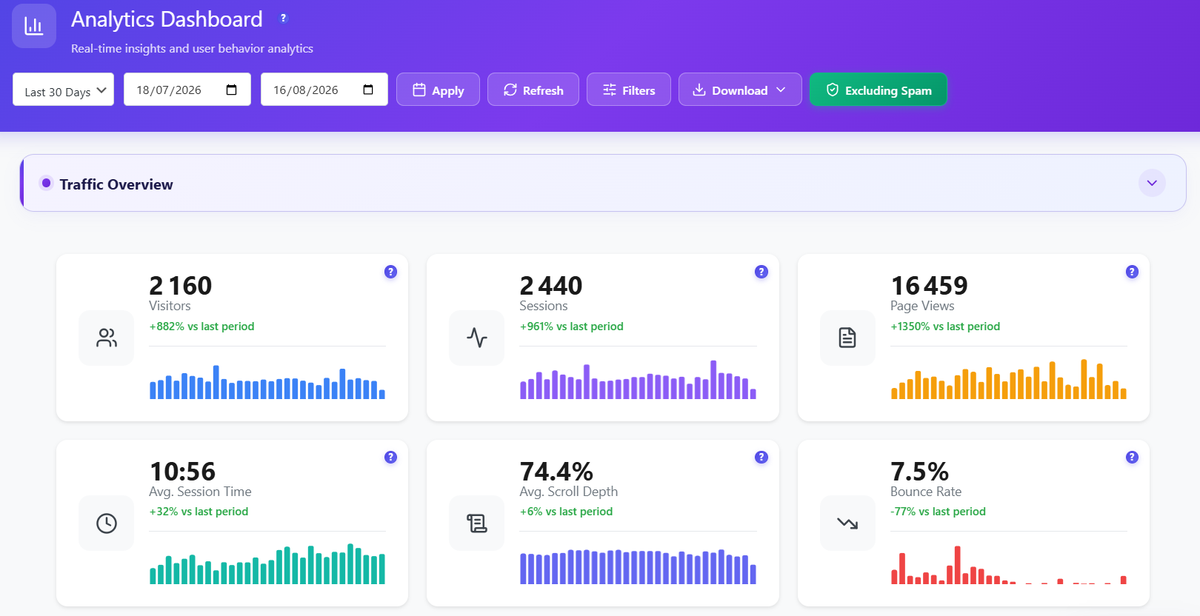
Go to Opti-Behavior > Traffic. After the first visits you see visitors, sessions, page views, average session time, scroll depth and bounce rate, each compared with the previous period, then top pages, sources, devices and countries.
Step 4: add a click heatmap to your key page (Free)
Open Opti-Behavior > Heatmaps and choose the page that matters most: your home page, a product page or your contact page. The click heatmap shows where visitors click on desktop and on mobile, including on things that are not links. Step-by-step: how to add a heatmap to WordPress.
Step 5: build one funnel (Free)
Open Opti-Behavior > Funnels and create the path to your goal, for example Product page > Cart > Checkout > Order received, or Service page > Contact page > Thank-you page. The funnel shows how many visitors reach each step and where most of them leave.
Step 6 (optional, Pro): watch the visits behind the numbers
When a funnel step loses most visitors, numbers stop helping. Session recordings, in Opti-Behavior Pro, let you replay real visits on that step: hesitation, scrolling, clicks that do nothing. Pro also adds scroll heatmaps, form analytics and error tracking.
See what your visitors do, on your own server
Opti-Behavior is free for WordPress. Traffic reports, click heatmaps and funnels, with the data stored in your own WordPress database.
Diagnose: is your visitor tracking data right?
Check these points before you trust a number, with any tool:
- Visit your own site from a phone on mobile data (not your Wi-Fi). Within a few minutes the visit should appear. If not, tracking is blocked.
- A cache or optimization plugin (WP Rocket, LiteSpeed Cache and others) can delay or combine tracking scripts. Fixes plugin by plugin: heatmap not working after installing a cache plugin.
- Compare with a second source: Search Console clicks for the same pages and dates should be lower than or close to your search visits, never far above.
- Look at bot traffic: a sudden spike from one country at night is often automated. Keep spam and bots excluded before you compare periods.
- Do not judge on two days: wait for at least a full week of data before you change a page.
Website visitor tracking without cookies
Many site owners want visitor tracking without adding cookies. In Opti-Behavior, Anonymous mode is the default and sets no cookie; Full Tracking mode sets cookies only after the visitor accepts, through the plugin’s built-in consent banner (off by default) or a consent plugin it detects. Whether your site still needs a cookie banner depends on everything it loads, not only analytics. We explain the details in WordPress analytics without a cookie banner; check your own setup with your data protection adviser.
Worried about speed? We measured PageSpeed on a test page with the plugin on and off: see the measurement.
What to check after 7 days
- Your own visits are not in the numbers (step 2).
- Your top 5 pages match what you expected. If a page you never promote is in the list, find out where its visitors come from.
- Mobile bounce rate vs desktop bounce rate on your key page. A large gap often points to a layout problem on phones: open the mobile click heatmap.
- Your funnel: write down the step that loses the most visitors. That is the first page to work on.
- After you change that page, compare the same number over the next 7 to 14 days, not the next morning.
Reading your first week: a worked example on optiuser.com
We run Opti-Behavior on optiuser.com, the site you are reading. Here is how we read it with the free features, with real numbers and their dates. It is a small site, so the numbers are small: the method is the part you can copy.
1. Turn spam off before you read a single number
On the Traffic screen, the first thing to check is the Excluding Spam switch next to the dates. When it is on, sessions that match your spam rules are left out of the cards and lists, so a burst of empty visits does not inflate your visitors or lower your bounce rate. The rules (minimum time on the site, scrolls and clicks) are in Opti-Behavior > Settings > Traffic & Behavior. The same switch exists on the Funnels screen: use the same setting on both, or the numbers will not match.
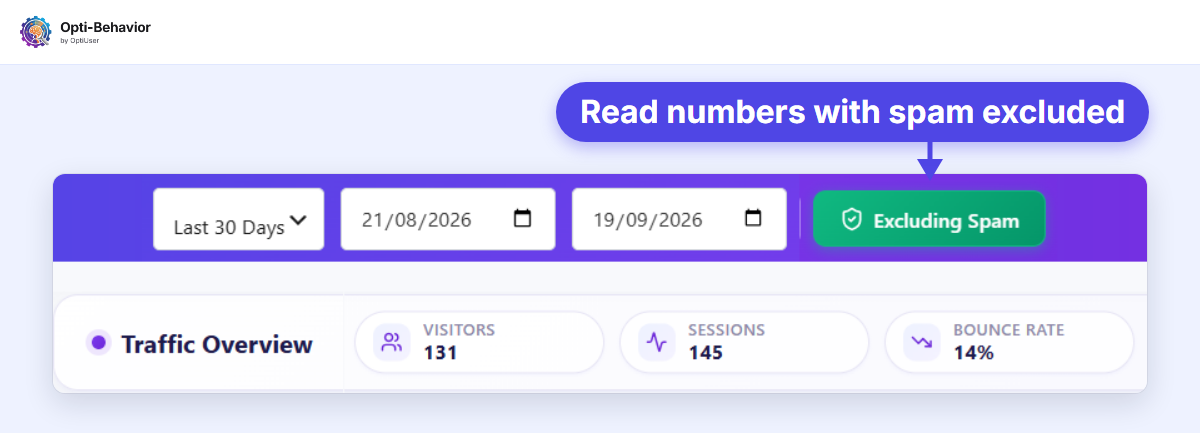
Then write down three numbers for the week, with the dates: visitors, the top page and the share of mobile visits. That is your baseline. Everything you change later is compared with it.
2. Open the click heatmap of the page that matters
Our most important page is the home page, so that is the heatmap we read. Between 16 July and 18 September 2026, the click heatmap of optiuser.com’s home page had 51 page views with click data: 39 on desktop, 12 on mobile and none on tablets. On desktop it recorded 163 clicks, with an average time on the page of 1 min 39 s.
Two things stood out:
- Most clicks went to the row of module tabs near the top (Heatmaps, Recordings, Funnels, Form Analytics, Errors & Performance, User Journeys). Visitors wanted to explore one feature at a time, so each tab must lead somewhere useful.
- Visitors clicked things that are not buttons: the small Click / Move / Attention / Scroll labels inside an illustration. A click on something that does nothing is a sign the visitor expected a link there.
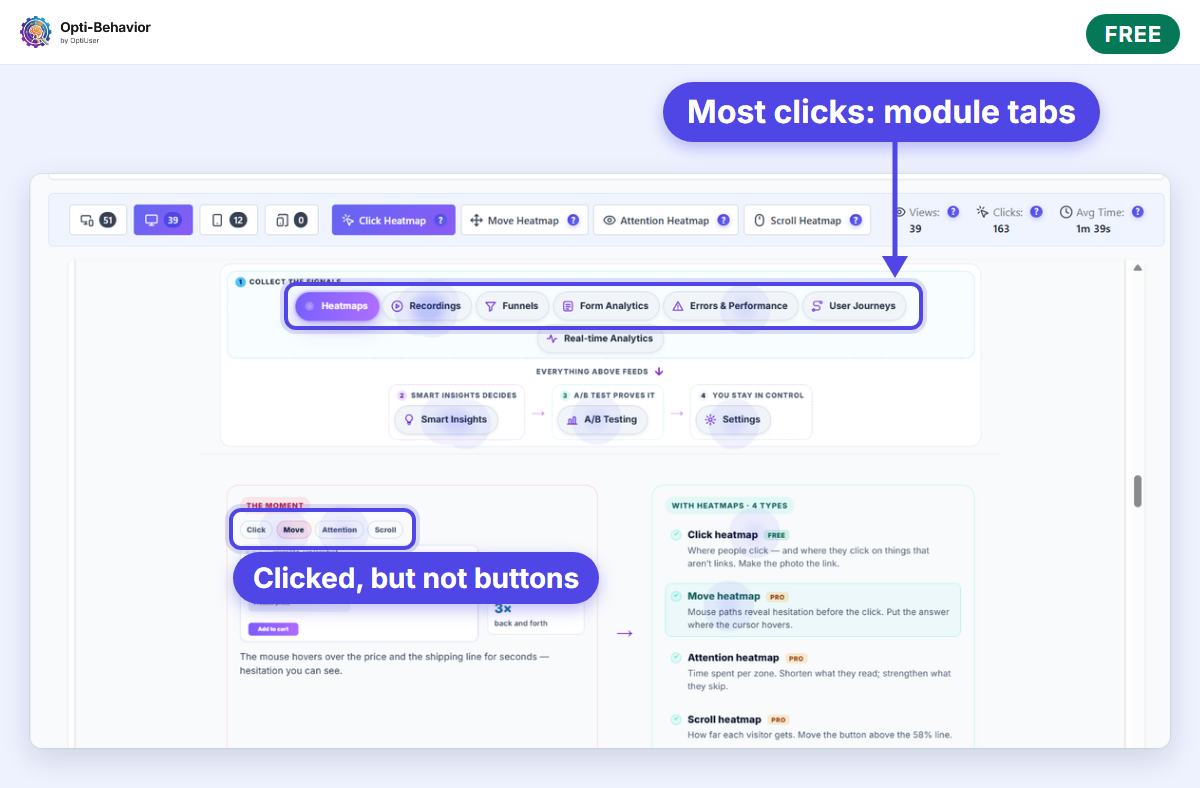
Neither finding shows up in a visitor count. Both point to a precise change: make the most clicked elements lead to the page the visitor wants, and either link the labels people click or make it clear they are not links.
3. Check your numbers against Search Console
Visitor tracking tells you what people do on your pages; Search Console tells you how they found them. Reading both together avoids wrong conclusions. In the 7 days before 1 November 2026, Search Console showed our heatmap generator page 6 times for “website heatmap free”, at an average position of 23, for 1 click. Our add to cart rate guide appeared 3 times for “add to cart rate”, around position 19, with no click.
Two lessons for your own site:
- A page on Google’s second or third page brings very few visits. If the Traffic screen shows almost no search visitors for a page, check its position before you blame the page itself.
- Search clicks in Search Console should never be far above the search visits your tracking shows for the same page and dates. If they are, tracking is missing visits: go back to the diagnosis section above.
4. Write a one-line note, then wait
At the end of the first week, write one line per page you plan to change: the period, spam on, the number you watch, the finding, the change, and the date you will read it again. For example: “Home page, 16/07 to 18/09, spam on, 163 desktop clicks; most clicks on the module tabs; check that each tab leads to its feature page; read again in 14 days.” A note like this stops you from changing three things at once and never knowing which one worked.
FAQ
What is website visitor tracking?
It is the collection of data about visits to a website: where visitors come from, which pages they view, what they click and where they leave. It helps you find the pages that lose visitors.
Can I track website visitors on WordPress for free?
Yes. The free Opti-Behavior plugin includes traffic reports, click heatmaps and funnels. Session recordings and scroll heatmaps are in Pro.
Can I see the name of each visitor?
No, and you should not try with a behavior analytics tool. Visitor tracking shows what visitors do, not who they are. Tools that name companies behind visits are a different category (B2B lead identification).
Where is the data stored?
With Opti-Behavior, visitor data is stored in your own WordPress database and files, on your server.
Start tracking what your visitors do
Opti-Behavior is free for WordPress: traffic reports, click heatmaps and funnels, with the data on your own server.
The Opti-Behavior Team