

Many people open Google Analytics and look for a heatmap. A picture of the page with red spots where people click. They search every menu. They do not find it.
That is because GA4 has no visual heatmap. The old Universal Analytics had a Chrome extension called "Page Analytics" that painted clicks on your pages. It is gone. GA4 only shows numbers and charts.
So how do you get a Google Analytics heatmap? You have three options. Here they are, from weakest to strongest.
Short answer: GA4 cannot show a heatmap. It has a "heatmap" style chart in Explorations, but that is a colored table, not a map of your page. To see clicks and scrolls on your page, add a heatmap tool next to GA4, or instead of it.
Contents
- Google Analytics heatmap: what GA4 can and cannot do
- Option 1: Browser extensions (weak)
- Option 2: Add a cloud heatmap tool next to GA4
- Option 3: A WordPress plugin that does heatmaps and analytics together
- GA4 vs a heatmap tool: what each answers
- How to add a heatmap to WordPress
- Google Analytics heatmap: the bottom line
- Google Analytics heatmap FAQ
Google Analytics heatmap: what GA4 can and cannot do
What it can do
- Count scrolls at 90% of the page (one event, not a map).
- Count clicks on outbound links (enhanced measurement).
- Show a heatmap-style table in Explorations. For example, sessions by day of the week and hour, colored by volume. Useful, but it is not a picture of your page.
- Track custom events on buttons, if you set them up with Google Tag Manager.
What it cannot do
- Show where people click on the actual page layout.
- Show how far down each part of the page people scroll.
- Show clicks on things that are not links (dead clicks).
- Replay a visit.
In short: GA4 tells you how many. A heatmap tells you where. A recording tells you why.
Option 1: Browser extensions (weak)
Some Chrome extensions read your GA4 data and draw dots on your pages. They sound great, but they have big limits:
- They only show clicks you already track as events, usually links.
- They cannot see clicks on images, text or broken buttons.
- They have no scroll or move data.
- They often break on menus, pop-ups and dynamic content.
Fine for a quick look at link clicks. Not a real heatmap.
Option 2: Add a cloud heatmap tool next to GA4
Tools like Microsoft Clarity and Hotjar add a second script that records real clicks, scrolls and moves. Check each tool’s site for its current plans.
This works well. The trade-offs: a second tracking script, a second set of cookies, and your visitor data goes to a second cloud.
Some of these tools offer a Google Analytics integration: check their documentation. See our Microsoft Clarity alternatives if the privacy side worries you.
Option 3: A WordPress plugin that does heatmaps and analytics together
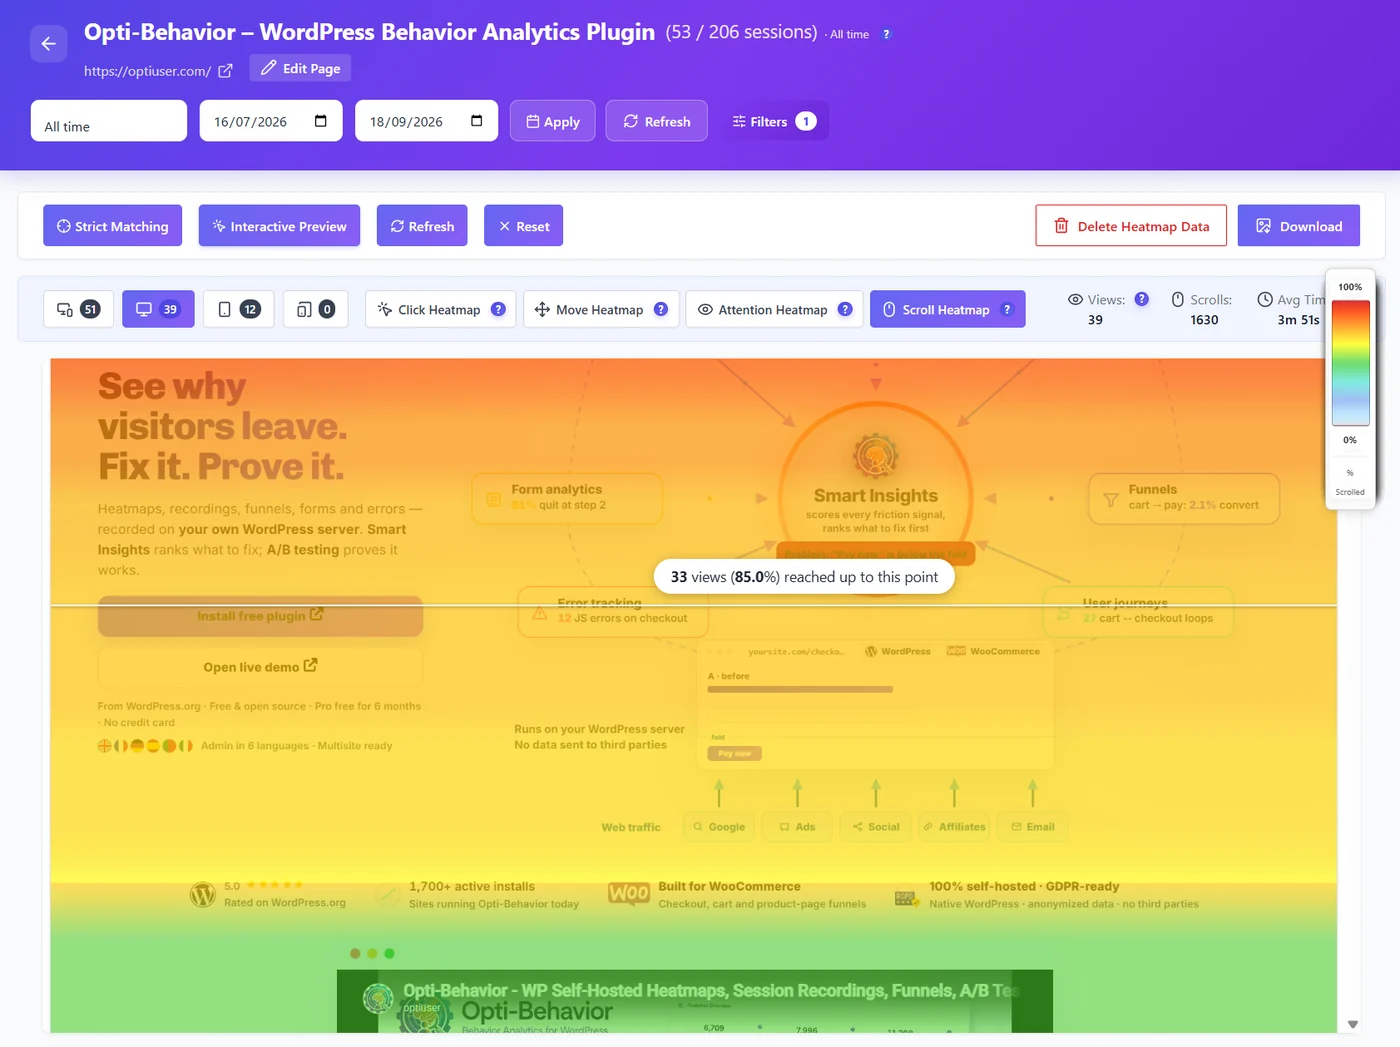
If your site runs on WordPress, you can get real heatmaps without another cloud. Opti-Behavior is a plugin that records clicks and scrolls and paints them on your real pages. All data stays on your server.
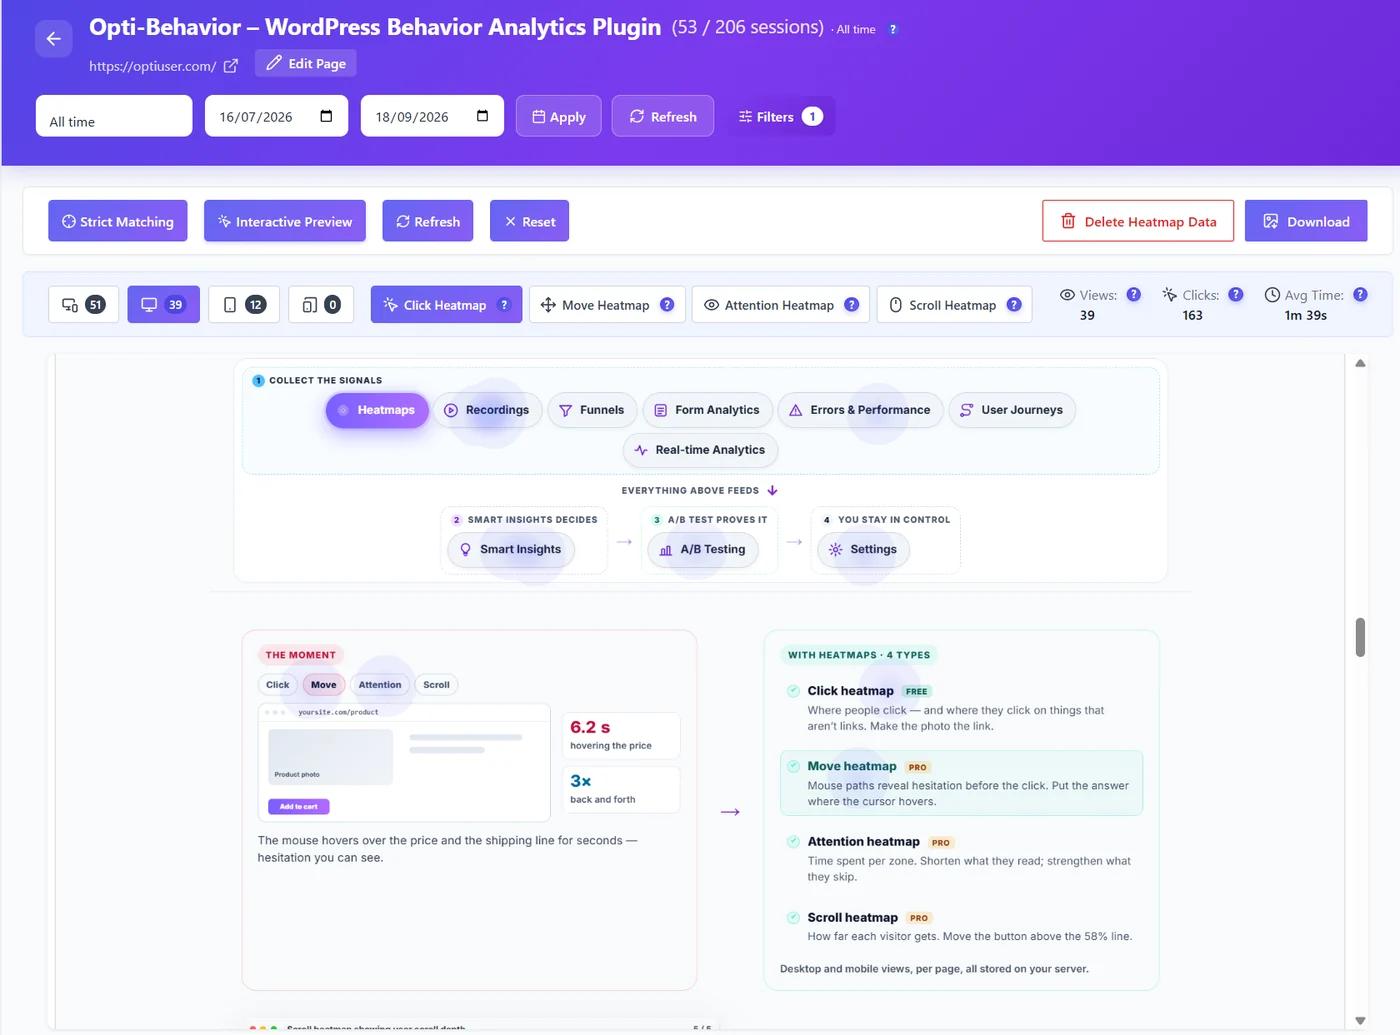
It also gives you the reports people use most in GA4: visits, top pages, traffic sources, devices and countries. So for many small and medium sites, it can cover the main traffic reports they use in GA4. Or you can keep GA4 for Google Ads and use the plugin for page analysis.
- Click heatmaps: free.
- Scroll, move and attention heatmaps: Pro (from €89 per year, 6-month free trial).
- No session limits. Can run without cookies.
GA4 vs a heatmap tool: what each answers
| Question | GA4 | Heatmap tool |
|---|---|---|
| How many people visited this page? | Yes | Yes |
| Which traffic source brings buyers? | Yes | Yes (in most tools) |
| Where exactly do people click? | No | Yes |
| Do people click on things that are not links? | No | Yes |
| How far down do people read? | Only "reached 90%" | Yes, all the way down |
| Why did this visitor leave? | No | Yes, with recordings |
How to add a heatmap to WordPress
- Go to Plugins > Add New and search for Opti-Behavior.
- Install and activate.
- Open Opti-Behavior > Heatmaps after a few visits.
That is all. You can keep GA4 running at the same time. Read our WordPress heatmap guide for tips on reading your first map.
Google Analytics heatmap: the bottom line
There is no true Google Analytics heatmap in GA4. It counts, it does not paint. If you want to see where people click and how far they scroll, add a heatmap tool. For a first look today, our free website heatmap generator simulates a heatmap of any page from its layout; real clicks need a tool on your site. On WordPress you can get a real heatmap and your main traffic reports in one plugin, with the data on your own server.
Get the heatmap GA4 cannot give you
Opti-Behavior is free for WordPress. Real click heatmaps on your real pages, with the data on your own server.
Google Analytics heatmap FAQ
Does Google Analytics 4 have a heatmap?
No. GA4 has no visual heatmap of your pages. Its Explorations can show a colored table, but that is not a map of where people click.
How can I see a heatmap with Google Analytics?
You need a separate heatmap tool. Some cloud heatmap tools offer a GA4 integration. On WordPress, a plugin like Opti-Behavior shows real heatmaps and the main traffic reports in one place.
What happened to the Google Analytics Page Analytics extension?
It worked with Universal Analytics, which Google shut down. It does not work with GA4.
Can I track scroll depth in GA4?
GA4 only records one scroll event when a visitor reaches 90% of the page. A scroll heatmap shows how many people reach every part of the page.