
Website heatmap tools show where visitors click, move and scroll on a page, painted as colors on top of it: warm for busy areas, cold for what people ignore. The right tool depends on three things: session limits, where the data is stored, and the price when your traffic grows. Below we compare 9 tools, free and paid, with a clear pick for each case, including WordPress sites.
There are dozens of website heatmap tools. Most look the same on their home page. The real differences are hidden: session limits, where the data goes, and what you pay when traffic grows.
We make one of these tools (Opti-Behavior), so we are biased. To keep it fair, we list each tool’s weak points, including ours.
Quick answer: Best free cloud tool: Microsoft Clarity. Best for surveys plus heatmaps: Hotjar. Best for WordPress with data on your own server: Opti-Behavior. Best for product teams: PostHog. Best for enterprise: Contentsquare.
Contents
- What to compare in website heatmap tools
- The 9 tools at a glance
- Each tool reviewed: strengths, limits, best use
- How to add a heatmap tool to WordPress
- Free vs paid: what you really get
- How to read your first heatmap
- 5 mistakes to avoid with heatmaps
- The bottom line: which heatmap tool to pick
- Website heatmap tools FAQ
What to compare in website heatmap tools
- Heatmap types. Click, scroll, move and attention. Some tools only do click and scroll.
- Session limits. Many tools stop recording when you hit your monthly quota.
- Data location. Your own server, or the vendor’s cloud. It changes your GDPR setup and who handles your visitor data.
- Mobile heatmaps. Can you split desktop and mobile? You should.
- What comes with it. Recordings, funnels, A/B tests, surveys.
- Price when you grow. Look at the plan for twice your current traffic.
- Install on your platform. On WordPress, a plugin installs from the admin. A cloud tool needs a script in your header, and cache or optimization plugins can block it.
The 9 tools at a glance
| Tool | Best for | Free option | Session limits | Data location |
|---|---|---|---|---|
| Microsoft Clarity | Free heatmaps and replays | Yes, fully free | None | Microsoft cloud |
| Hotjar | Heatmaps plus surveys | Free tier | Yes, by plan | Contentsquare cloud |
| Opti-Behavior | WordPress sites | Yes, free forever | None | Your own server |
| Crazy Egg | Quick insights and simple tests | Trial | Yes, by plan | Crazy Egg cloud |
| Mouseflow | Friction and form analytics | See vendor’s pricing page | Yes, by plan | Mouseflow cloud |
| Lucky Orange | Heatmaps with live chat | See vendor’s pricing page | Yes, by plan | Lucky Orange cloud |
| PostHog | Product and SaaS teams | Monthly free allowance | Pay by usage | PostHog cloud or self-hosted |
| Contentsquare | Large companies | No | Custom | Contentsquare cloud |
| Matomo + Heatmap add-on | Teams running Matomo | Matomo free, add-on paid | None | Your Matomo server |
Prices and plans change. Check each vendor’s pricing page before you buy.
Each tool reviewed: strengths, limits, best use
1. Microsoft Clarity
Free and unlimited. Click and scroll heatmaps, recordings, and AI summaries. The data is stored in Microsoft’s cloud and handled under Microsoft’s own terms. In the EU, most sites ask for consent before loading it: see our Microsoft Clarity GDPR guide.
Pick it if: you want free heatmaps today and you already run a consent banner.
Compare: Opti-Behavior vs Microsoft Clarity
2. Hotjar
The best-known name. Heatmaps, recordings, and the strongest survey and feedback tools on this list. Paid plans are priced by monthly sessions; see the vendor’s pricing page.
Pick it if: you want to ask visitors questions, not only watch them. See our list of Hotjar alternatives if the price is a problem.
Compare: Opti-Behavior vs Hotjar
3. Opti-Behavior
A WordPress plugin that keeps all data on your own server. Click heatmaps, funnels, a real-time dashboard and A/B tests are free forever. Pro (6-month free trial, see our pricing page) adds move, scroll and attention heatmaps, session recordings, form analytics and error tracking. No session limits on any plan.
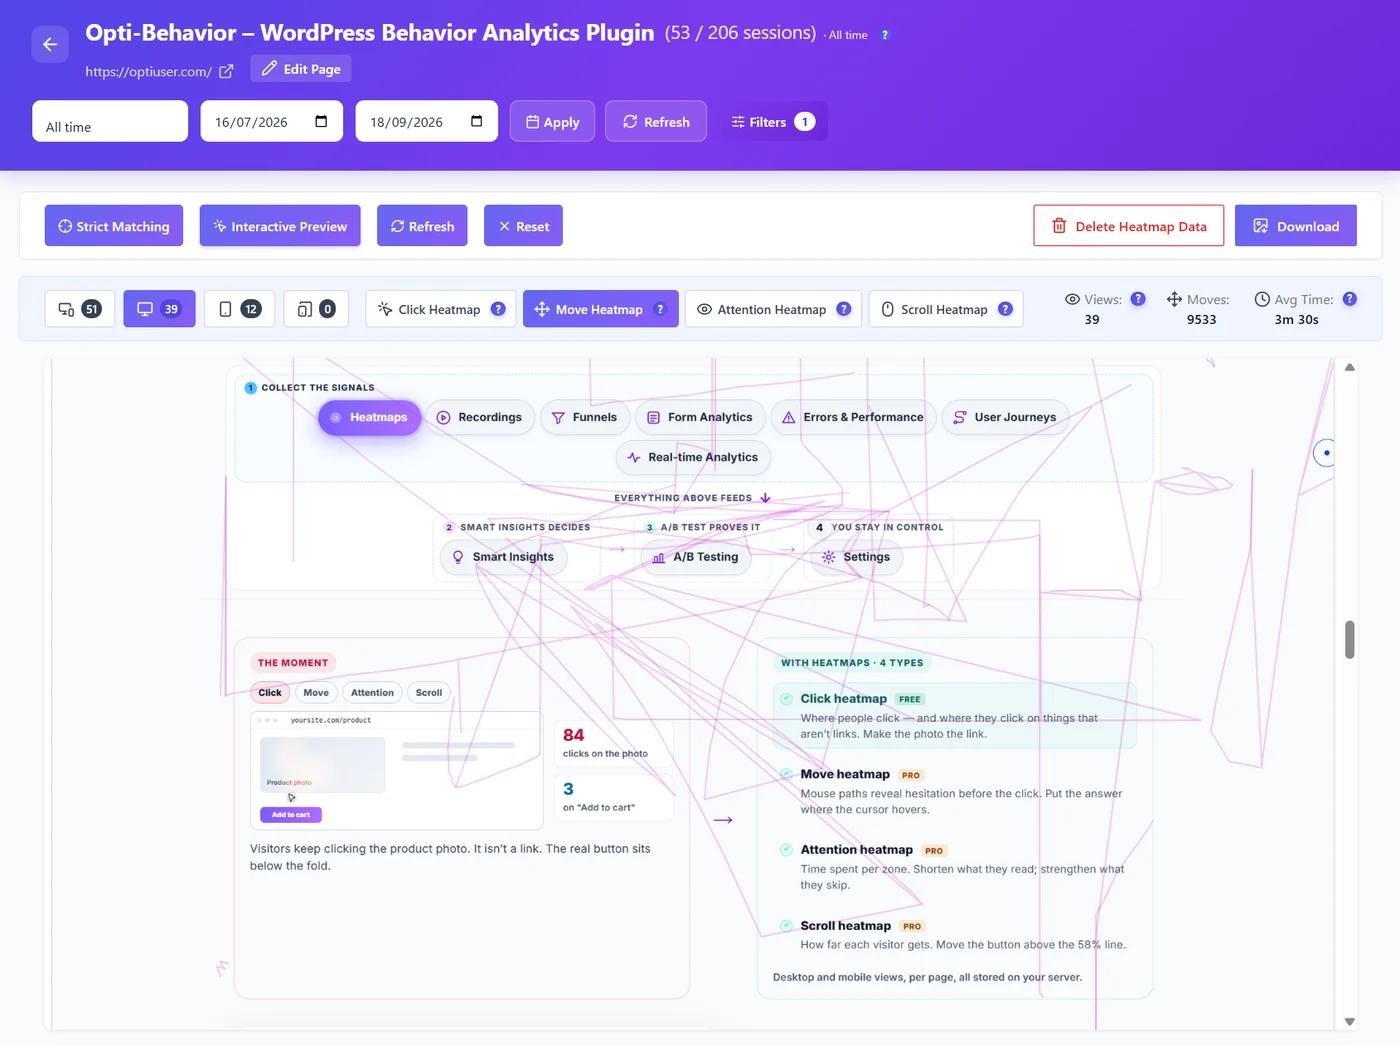
Pick it if: your site runs on WordPress and you want your data, and your costs, under control. Skip it if: your site is not on WordPress, or you need surveys.
4. Crazy Egg
A heatmap pioneer. Its "confetti" view colors each click by where the visitor came from, which is handy for ads and campaigns. Paid plans after a trial.
Pick it if: you run campaigns and want to see which source clicks what.
5. Mouseflow
All four heatmap types, plus friction scores and form analytics. Paid plans are priced by monthly sessions; see the vendor’s pricing page.
Pick it if: you want form analytics in a cloud tool.
Compare: Opti-Behavior vs Mouseflow
6. Lucky Orange
Heatmaps, recordings, live chat and surveys in one tool. Paid plans are priced by monthly sessions; see the vendor’s pricing page.
Pick it if: you want to chat with visitors on the same screen.
Compare: Opti-Behavior vs Lucky Orange
7. PostHog
A full product analytics platform with heatmaps, replays, feature flags and experiments. Built for software teams.
Pick it if: you build an app and have developers.
8. Contentsquare
An enterprise platform with zone-based heatmaps and deep journey analysis. Custom pricing, usually for large companies.
Pick it if: you are a big brand with a dedicated analytics team.
9. Matomo with the Heatmap add-on
Self-hosted analytics with a paid heatmap and recording add-on. Your data stays on your server, but you run and update Matomo yourself.
Pick it if: you already use Matomo.
Compare: Opti-Behavior vs Matomo
How to add a heatmap tool to WordPress
- Choose where the data lives. A plugin such as Opti-Behavior keeps it on your own WordPress server. A cloud tool sends it to the vendor.
- Install it. For a plugin: Plugins > Add New, search its name, then Install and Activate. For a cloud tool: paste its script in your header, with a header plugin or your theme settings.
- Check your cache plugin. Clear the cache and make sure your optimization plugin does not delay or combine the heatmap script. See heatmap not working with a cache plugin.
- Confirm the first data. Open the page in a private window, click around, then open the heatmap report.
Then wait for 100 to 200 visits on a page before you draw conclusions. While you wait, our free website heatmap generator gives a simulated preview of any page, built from its layout, not from visitors.
Free vs paid: what you really get
| Need | Free option that works |
|---|---|
| A few heatmaps on a small site | Microsoft Clarity, Opti-Behavior free |
| Unlimited visits for free | Microsoft Clarity (cloud), Opti-Behavior click heatmaps (self-hosted) |
| No cookies required | Opti-Behavior (data stays on your WordPress server) |
| Heatmaps plus A/B tests for free | Opti-Behavior |
How to read your first heatmap
Whatever tool you pick, ask these questions:
- Is the main button one of the hottest spots?
- Do people click on things that are not links?
- Do most people scroll past your key message, or stop before it?
- Is mobile very different from desktop?
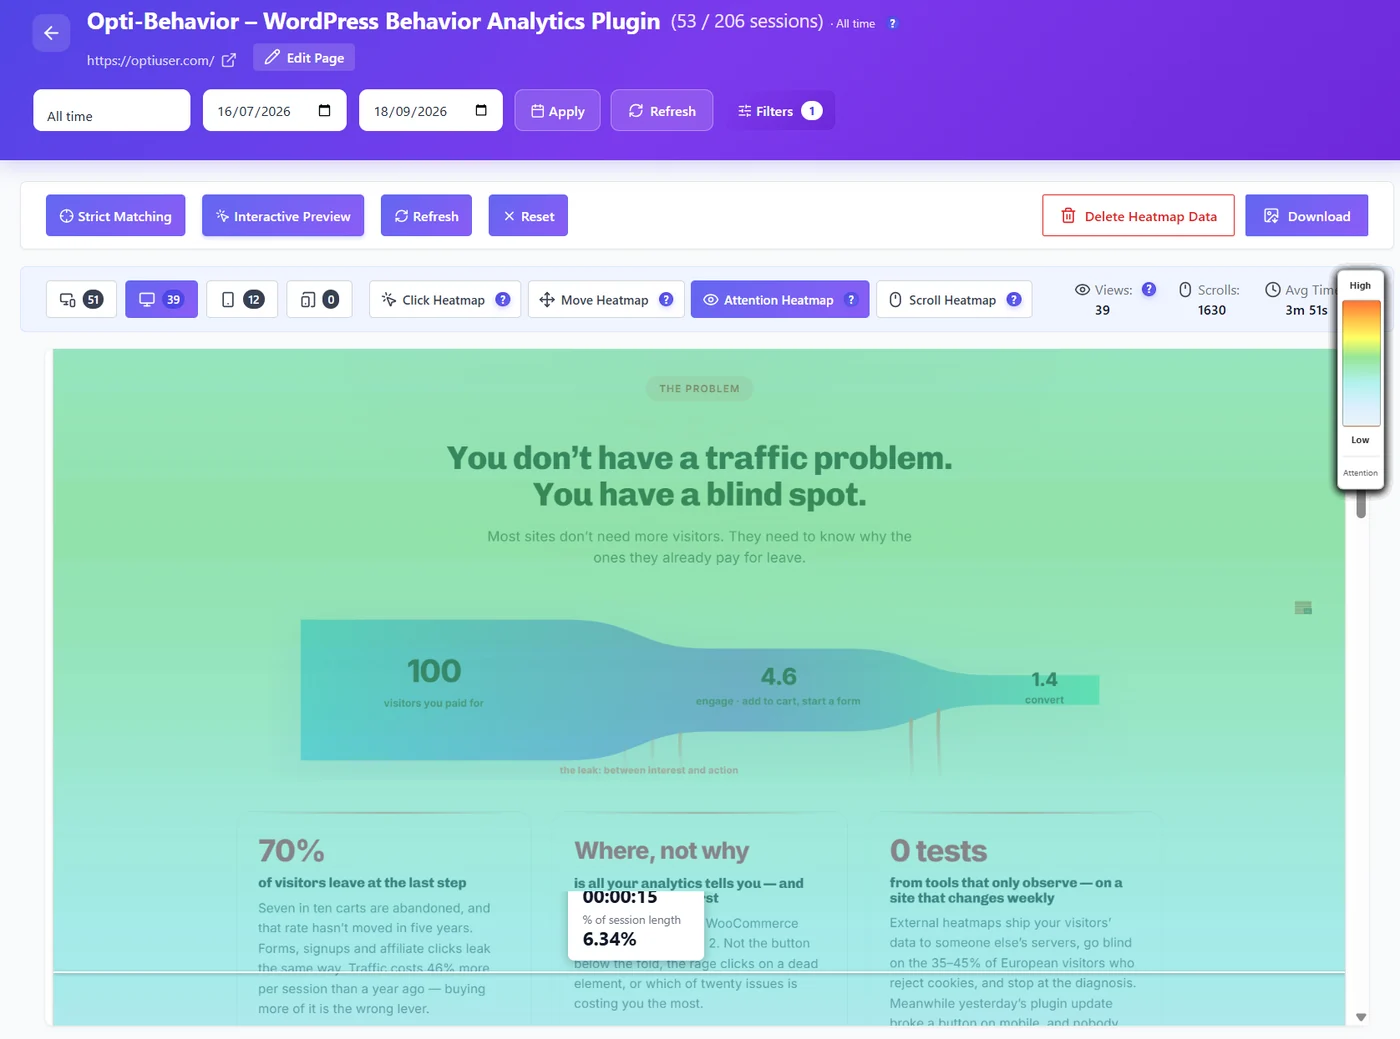
Then fix one thing and measure again. A heatmap is a starting point, not the answer. Our WordPress heatmap guide shows the 7 fixes that heatmaps reveal most often.
5 mistakes to avoid with heatmaps
- Looking at too few visits. Ten visits make a pretty picture, not a pattern. Wait for 100 to 200.
- Mixing desktop and mobile. People use a phone very differently. Always split them.
- Only checking the home page. Your product, pricing and checkout pages often hide bigger problems.
- Forgetting the cache plugin. Some optimization plugins delay or merge scripts, and the heatmap stays empty. Check it the first day.
- Changing five things at once. Fix one thing, then measure again, or run an A/B test.
The bottom line: which heatmap tool to pick
Most website heatmap tools paint the same colors. The real differences are the session limits, the price when your traffic grows, and where your visitor data ends up. Pick one tool, start with the page that earns you money, and fix the biggest problem you see. Then do it again next month. Running WordPress? Our WordPress heatmap plugin comparison covers the options that install as a plugin.
Try a free website heatmap tool for WordPress
Install Opti-Behavior, visit a page, and see your first click map in minutes. No session limits, no cloud.
Website heatmap tools FAQ
What is the best free website heatmap tool?
Microsoft Clarity is the best free cloud tool, with no session limit. For WordPress sites that want data on their own server, Opti-Behavior has free click heatmaps with no limit.
How do website heatmap tools work?
A small script on your page records where visitors click, move and scroll. The tool then paints all those visits on top of an image of your page, using warm colors for busy areas.
Do heatmap tools slow down my website?
A good one adds very little, because the script is small and loads with defer. Test your page with PageSpeed Insights before and after install to be sure.
Can I use Google Analytics as a heatmap tool?
Not really. GA4 has no visual heatmap. You need a separate tool, or a browser extension that only shows basic click data.
How many visits does a heatmap need?
Around 100 to 200 visits on a page usually show a reliable pattern.
Where do website heatmap tools store the data?
Cloud tools such as Microsoft Clarity, Hotjar or Mouseflow store it on the vendor’s servers. Self-hosted options, such as Opti-Behavior or Matomo with its heatmap add-on, store it on your own server. PostHog offers both.