
A problem rarely hits everyone the same way. Where is the problem? splits each insight across eight dimensions and tells you which audience carries it.
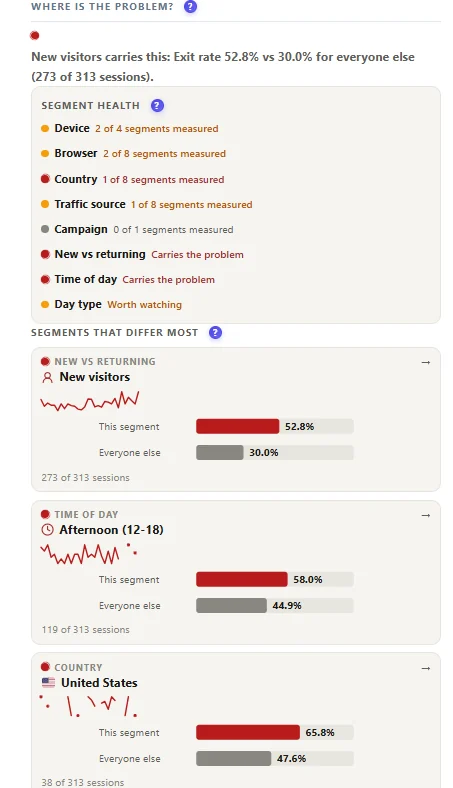
How to read it #
- The verdict – for example “New visitors carry this: exit rate 52.8% vs 30.0% for everyone else (273 of 313 sessions)”.
- Segment health – for each dimension: carries the problem, worth watching, or how many segments could be measured.
- Segments that differ most – this segment against everyone else, with a sparkline of the metric per day.
| Dimension | Example finding | Typical fix |
|---|---|---|
| Device | Mobile exit rate twice desktop | Mobile layout, speed, tap targets |
| Browser | Safari users stuck | A script error on Safari |
| Country | One country bounces | Language, currency, shipping info |
| Traffic source | One source does not engage | Landing page or targeting |
| Campaign | A campaign underperforms | Ad promise vs page |
| New vs returning | New visitors leave | Explain more above the fold |
| Time of day | Afternoon visits worse | Slow server at peak, or a different audience |
| Day type | Weekends worse | Support or delivery times |
Differences are tested for significance; small segments are marked as not measured instead of shouting. Click a bar to re-scope the evidence to that segment. The daily chart shows the metric with the previous period behind it and a first detected marker.
Pro. The free version shows the verdict and the daily chart; the full comparison and segment-filtered evidence need Pro. Start the 6-month free trial.
Expected result #
For each insight you know who is affected, and the report links open on that audience.
FAQ #
Why “0 of 1 segments measured”? #
Not enough visits in that dimension to compare.
Which metric is compared? #
The metric the problem was detected on – for example the CTA click rate for a button problem.


