
The Traffic page (Opti-Behavior → Traffic, titled “Traffic Overview”) is your analytics dashboard: who visits, from where, on which device, how engaged they are, and how much of your traffic is bots or spam.
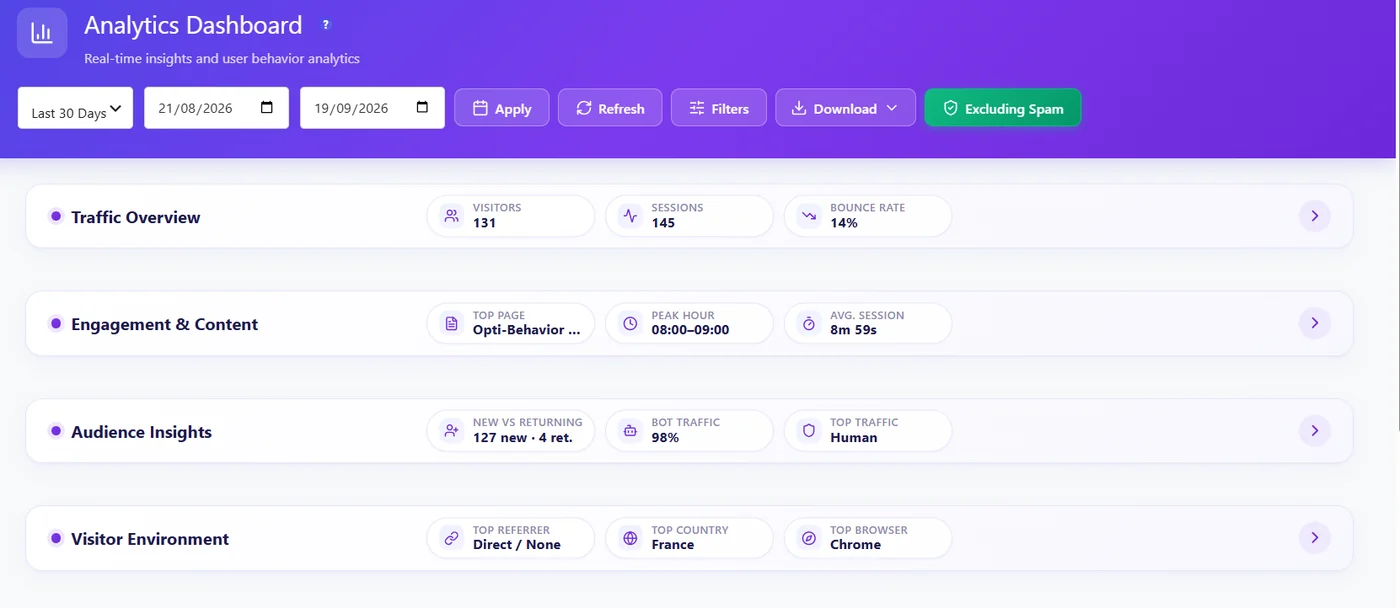
The top bar #
- Period – presets or custom dates, then Apply. Refresh reloads fresh numbers.
- Filters – narrow every widget to a segment (see below).
- Download – export CSV or JSON (see Exporting dashboard data).
- Excluding Spam – on by default: bot, automated and spam sessions are left out of every number.
The four sections #
| Section | Widgets | Question it answers |
|---|---|---|
| Traffic Overview | Visitors, sessions, page views, average session, scroll, bounce + trend chart | How much traffic, and is it growing? |
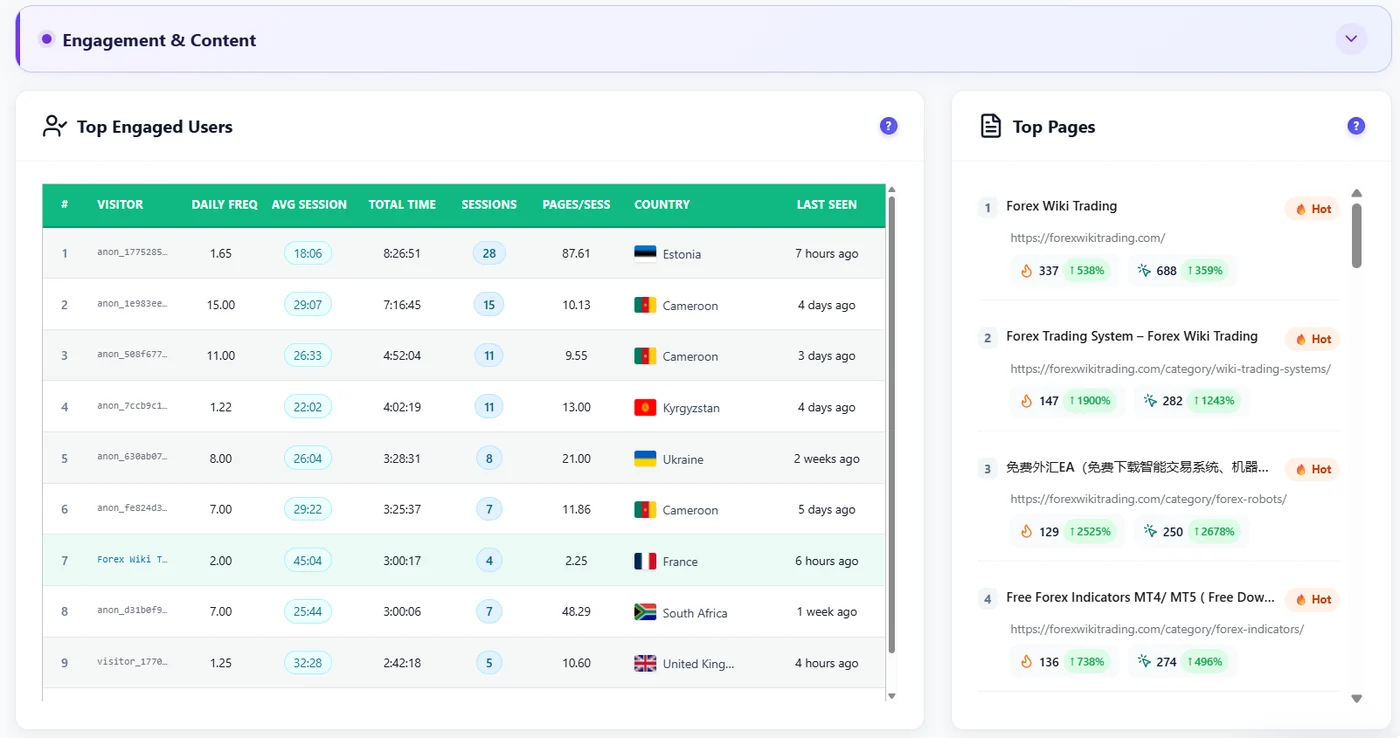
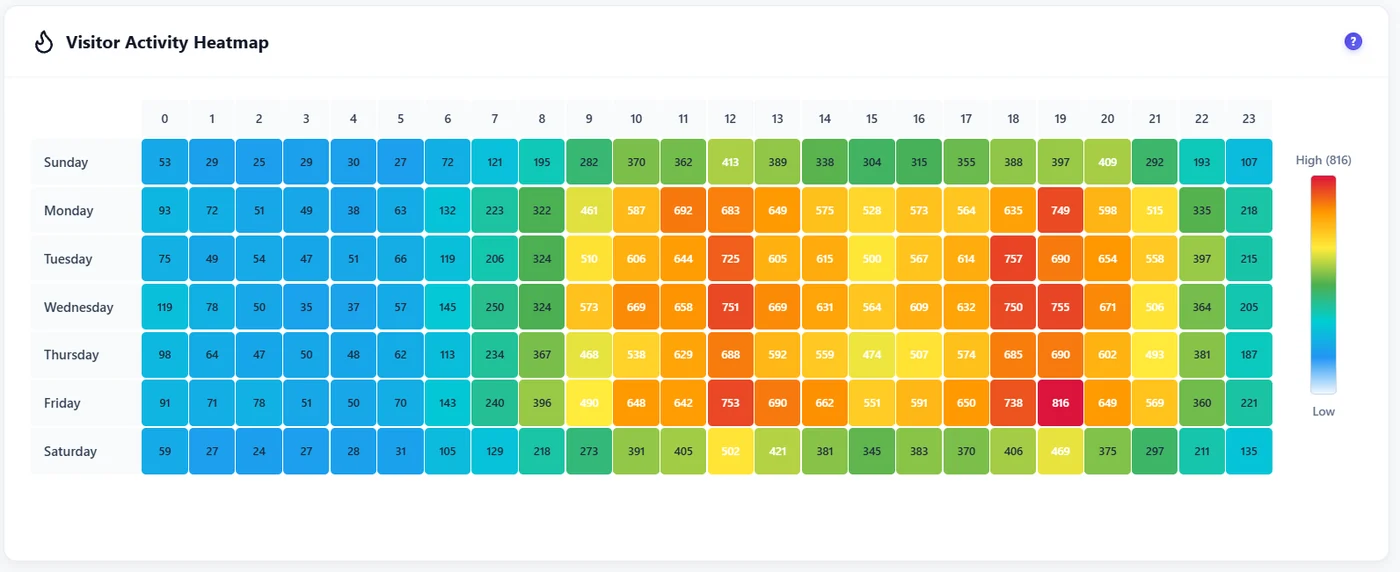
| Engagement & Content | Top engaged users, top pages, visitor activity by day and hour | What do people read, and when? |
| Audience Insights | New vs returning, visited directories, visitor authentication, traffic classification, bots, user intent | Who are they, and how many are real? |
| Visitor Environment | Referrers, countries, browsers, devices, operating systems, screen resolutions | Where do they come from, on what? |
Sections load one by one and can be folded, so the page stays fast even on big sites.
A few widgets in detail #
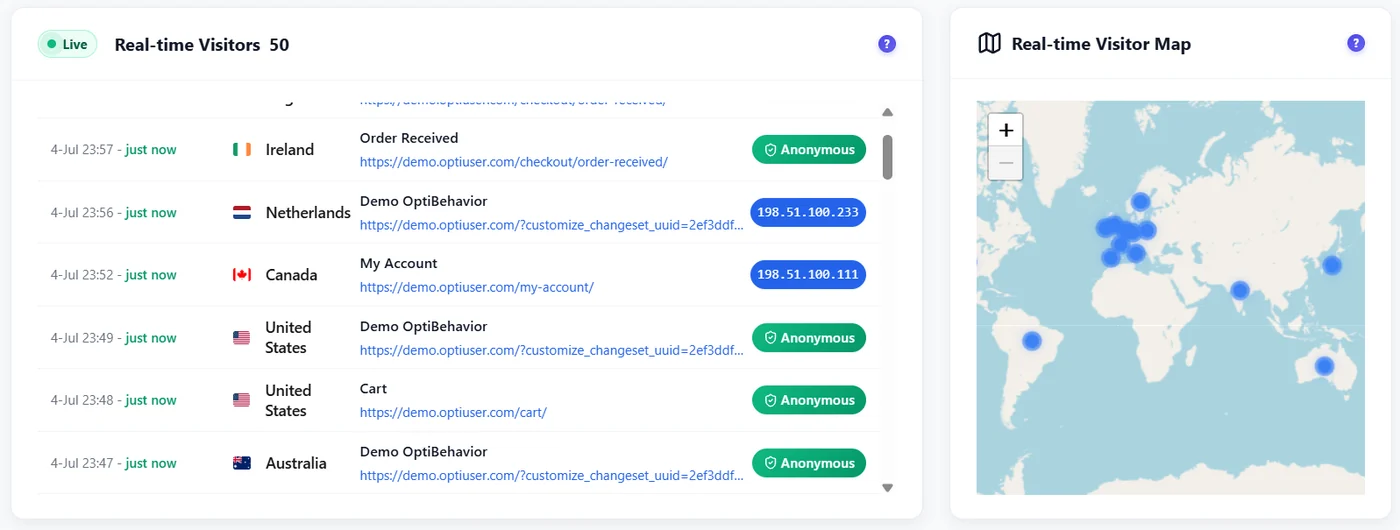
Filters #
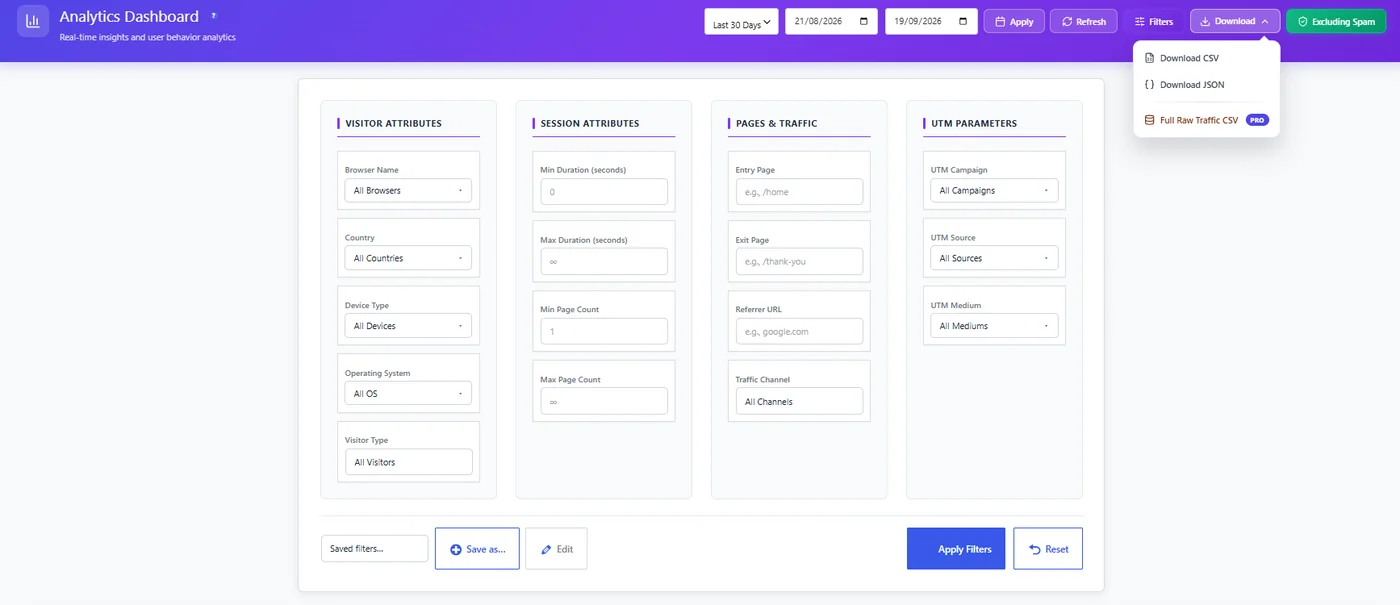
Filters cover visitor attributes (browser, country, device, OS, visitor type), session attributes (duration, number of pages), pages and traffic (entry page, exit page, referrer, channel) and UTM parameters. Save a set with Save as… to reuse it here and in the other reports.
Expected result #
The four sections show numbers for the chosen period, without spam, and every widget follows your filters.
FAQ #
Why do my numbers differ from Google Analytics? #
Opti-Behavior counts visits on your own server, is not blocked by most ad blockers and excludes spam and bots by default. Differences of 10–30% are normal.
Some widgets stay on “Loading”. #
Large sites compute widgets in the background; click Refresh after a few seconds. If it persists, see the troubleshooting articles.
Can I see a single visitor? #
Top Engaged Users lists anonymous visitor IDs. With Pro, open their recordings.


