
Table of Contents
Pro feature. Errors Tracking is part of Opti-Behavior Pro. Start the 6-month free trial to unlock it.
A broken script, a button that does nothing or a slow page silently costs you visitors. Errors Tracking records what really happens in your visitors’ browsers.
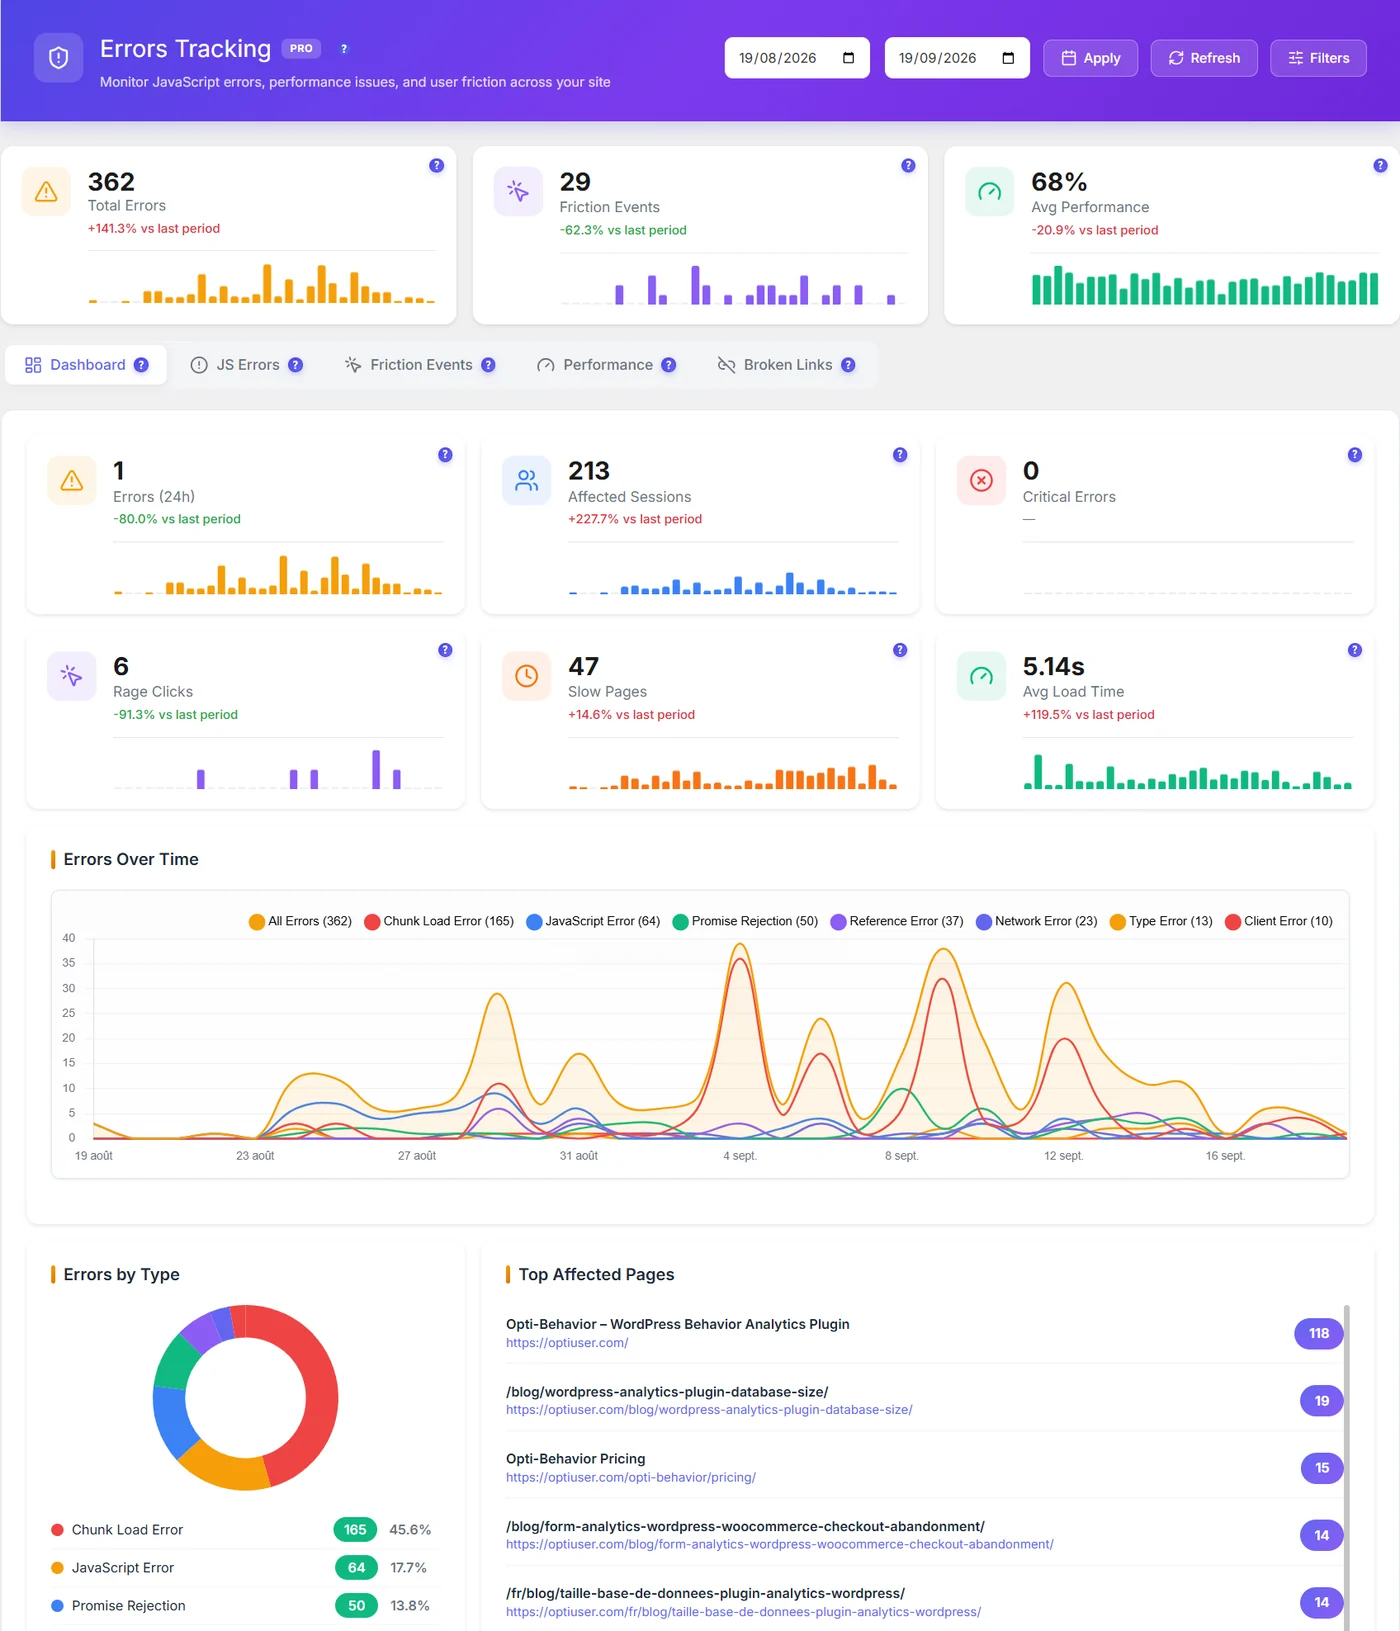
The five tabs #
| Tab | What it shows |
|---|---|
| Dashboard | Totals, trends, errors by type, top affected pages |
| JS Errors | Each script error with its file, line and context |
| Friction Events | Rage clicks, dead clicks and error clicks, with a verdict |
| Performance | Score, load time and Core Web Vitals per page and device |
| Broken Links | Links and resources returning errors |
Reading the dashboard #
- Top cards compare the period with the previous one: more errors is red, fewer is green.
- Errors Over Time by type (chunk load, JavaScript, promise rejection, reference, network, type, client) – a spike the day of an update points to that update.
- Top Affected Pages – each page links to its Page X-Ray report.
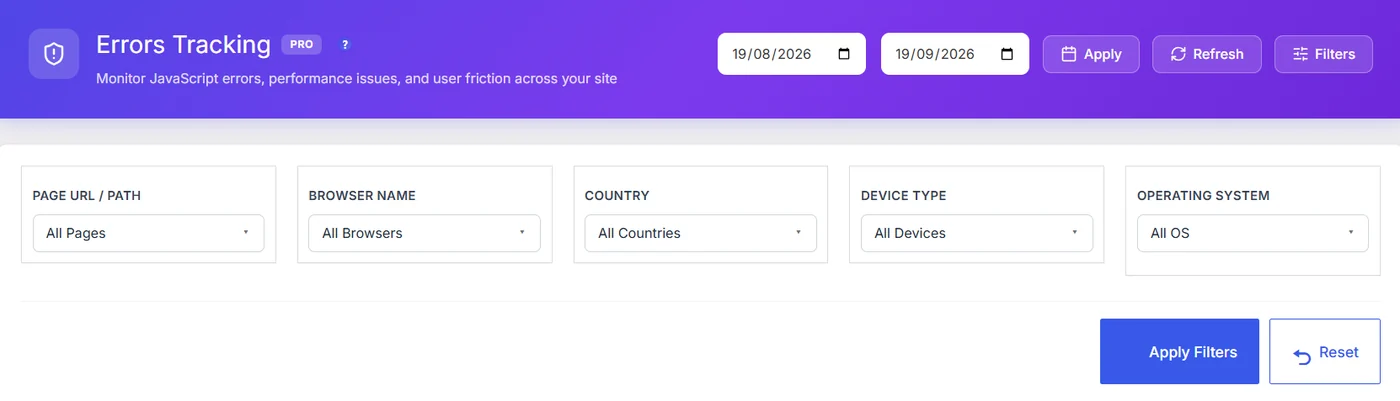
Expected result #
You know which pages and browsers have problems, and which ones to fix first.
FAQ #
Opened from a page, Errors shows only that page? #
Yes: from Page X-Ray or Smart Insights the screen is scoped to that page, period and spam setting.
Are errors from my admin visits counted? #
They follow the admin tracking setting.


