
Table of Contents

What you see per goal #
- Total visitors, test duration, best conversion rate, confidence.
- Statistical significance – current confidence and how far it is from the target (95%).
- Control vs variant – rate, change versus control, visitors, conversions, 95% confidence interval, p-value, and a thumbnail of each version.
How to decide #
| Situation | Decision |
|---|---|
| Confidence ≥ 95% and enough days | Declare the winner |
| Confidence low after the minimum duration | Keep running, or stop: the change makes no real difference |
| Intervals overlap a lot | No clear winner yet |
| Goals disagree | Use the decision engine (Pro) |
Vocabulary #
| Term | Plain meaning |
|---|---|
| Confidence | How sure we are the difference is not chance |
| 95% confidence interval | The range where the true rate probably is |
| p-value | Chance of seeing this difference if the variants were equal – below 0.05 is significant |
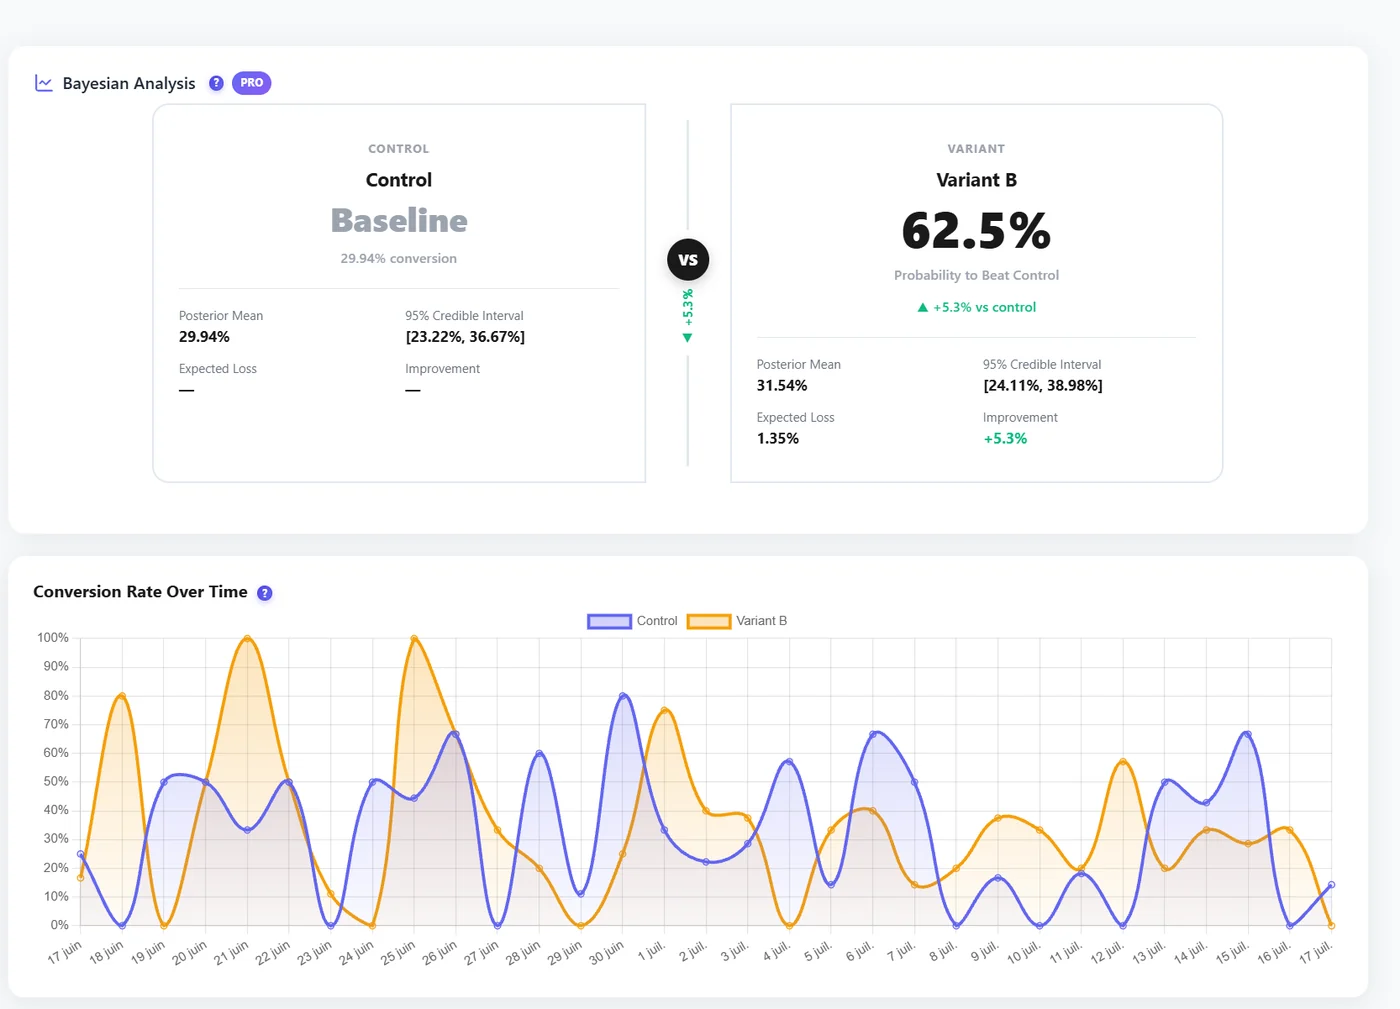
| Probability to beat control (Bayesian) | Chance that the variant is better |
| Expected loss | What you risk by choosing it if it is actually worse |
Expected result #
You can say whether a variant really wins, on which goal, and how sure you are.
FAQ #
Why does the chart zigzag? #
Daily rates on small numbers vary a lot; judge the overall result, not single days.


